WTI(20260123)Today's AnalysisMarket News:
According to data released Thursday, U.S. gross domestic product (GDP), an inflation-adjusted measure of the value of goods and services produced, grew at an annualized rate of 4.4% in the third quarter of last year, the fastest pace in two years.
The report shows that this is one of the two strongest consecutive quarters of growth since the U.S. economy was still in the recovery phase of the pandemic in 2021. After rushing to import goods at the beginning of the year to avoid the implementation of President Trump's comprehensive tariffs, businesses slowed their pace of imports. Despite the volatile trade policy, consumer and business spending remained robust.
With strong growth, a more solid job market, and inflation still above the Federal Reserve's target, the Federal Reserve is expected to keep interest rates unchanged at its meeting next week.
Technical Analysis:
Today's Buy/Sell Threshold:
59.74
Support and Resistance Levels:
61.54
60.87
60.43
59.05
58.61
57.94
Trading Strategy:
If the price breaks above 59.74, consider buying with a first target price of 60.43.
If the price breaks below 59.05, consider selling with a first target price of 58.61.
Wtiusd

WTI(20260109)Today's AnalysisMarket News:
On Tuesday, both the Dow Jones Industrial Average and the Dow Jones Transportation Average hit record closing highs, marking the first buy signal from Dow Theory in over a year.
Technical strategists believe this confirms the bull market that began in late 2022 remains firmly established, even as some previously high-performing AI-related stocks have recently faced pressure.
The Dow Jones Industrial Average's last record closing high was on January 5th, while the Dow Jones Transportation Average's record high was even further back. Dow Jones market data shows that the index's last record closing high was on November 25th, 2024.
Technical Analysis:
Today's Buy/Sell Threshold:
57.58
Support and Resistance Levels:
60.26
59.26
58.61
56.54
55.89
54.89
Trading Strategy:
If the price breaks above 58.61, consider buying with a first target price of 59.26.
If the price breaks below 57.58, consider selling with a first target price of 56.54.

Can geopolitics rescue oil from five-year lows?At some point this year there could be a strong opportunity to buy crude oil, as prices near USD 55 per barrel are potentially unsustainable.
WTI crude oil futures rose more than 3.5% on Thursday to trade above USD 57.9 per barrel, rebounding from a two-day slide. The move, however, was not enough to recover the losses earlier in the week, and prices remain close to the five-year low set in December.
Uncertainty around Venezuelan exports resurfaced after Washington announced plans to maintain indefinite control over the country’s crude sales.
Meanwhile, in Iran, protests have been reported in Tehran and other cities as inflation rises and the currency weakens, adding another layer of geopolitical risk for oil. Unlike Venezuela, Iran continues to export roughly 2 million barrels per day and produces between 3.2 and 3.5 million barrels per day, contributing a meaningful volume of global supply.

Crude Oil Futures Closing the GAP this Week?📊 CRUDE OIL FUTURES (FEB 2026) TECHNICAL ANALYSIS
"The goal of a successful trader is to make the best trades. Money is secondary." — Alexander Elder
The Crude Oil Futures (CLG2026) chart on the 1-hour timeframe shows a significant bearish breakdown as we head into late December 2025. Sellers have taken control after a period of distribution near the recent highs.
📉 CURRENT PRICE ACTION
Ticker: CLG2026 (Crude Oil Feb '26)
Price: 56.93 (+0.05% in the current session)
Trend: The market has experienced a sharp "flush" from the 58.40 level, breaking through multiple support zones in a single high-momentum move.
🚀 CRITICAL LEVELS TO WATCH
UPWARD RESISTANCE
Entry Zone: 58.40 (This was the previous distribution peak and acts as significant resistance on any bounce).
Previous Support: 57.80 (The blue line now acts as a technical "ceiling" for short-term recovery).
DOWNWARD SUPPORT
Market Closing Price: 56.94 (Current area of consolidation following the breakdown).
Target Gap: 56.53 – 56.60 (The chart indicates an "Open Gap" that hasn't been filled yet; price is gravitating toward this zone).
📈 MOMENTUM AND PATTERNS
Distribution Box: The yellow box near the top shows the price struggling to move higher before the aggressive sell-off.
Breakout Move: A large yellow rectangle highlights the high-velocity downward move that invalidated the previous bullish structure.
Gap Theory: The orange arrow points directly to the lower gap, suggesting a high probability that the price will hit the 56.50 range before finding new buyers.
🔍 TRADING STRATEGY
Bearish Bias: The overall short-term outlook is bearish as long as the price remains below 57.80.
Gap Fill Play: Traders are likely watching for a move into the 56.60 "Gap" zone to look for potential "exhaustion" or reversal signs.
Wait for Rejection: If the market rallies back to 57.14, look for rejection candles to confirm the downtrend's continuation.
#CrudeOil #OilTrading #FuturesTrading #TechnicalAnalysis #Commodities #CLG2026 #WTI #TradingStrategy #MarketUpdate

USOILSPOT H4 | Bullish Momentum To ExtendMomentum: Bullish
The price is falling towards the buy entry, which aligns with the 23.6% Fib retracement, which adds significant strength to this level.
Buy entry: 57.88
Pullback support
23.6% Fibonacci retracement
Stop loss: 57.12
Pullback support
38.2% Fibonacci retracement
Take profit: 59.27
Pullback resistance
78.6% Fibonacci retracement
High Risk Investment Warning
Stratos Markets Limited (tradu.com ), Stratos Europe Ltd (tradu.com ):
CFDs are complex instruments and come with a high risk of losing money rapidly due to leverage. 70% of retail investor accounts lose money when trading CFDs with this provider. You should consider whether you understand how CFDs work and whether you can afford to take the high risk of losing your money.
Stratos Global LLC (tradu.com ): Losses can exceed deposits.
Please be advised that the information presented on TradingView is provided to Tradu (‘Company’, ‘we’) by a third-party provider (‘TFA Global Pte Ltd’). Please be reminded that you are solely responsible for the trading decisions on your account. Any information and/or content is intended entirely for research, educational and informational purposes only and does not constitute investment or consultation advice or investment strategy. The information is not tailored to the investment needs of any specific person and therefore does not involve a consideration of any of the investment objectives, financial situation or needs of any viewer that may receive it. Past performance is not a reliable indicator of future results. Actual results may differ materially from those anticipated in forward-looking or past performance statements. We assume no liability as to the accuracy or completeness of any of the information and/or content provided herein and the Company cannot be held responsible for any omission, mistake nor for any loss or damage including without limitation to any loss of profit which may arise from reliance on any information supplied by TFA Global Pte Ltd.

West Texas Oil (WTI)Those who follow my work know that we have shorted oil multiple times and successfully built profits.
In my previous post, I clearly mentioned the final short target, and price reached it perfectly.
🔁 Now the situation has changed, and I see a buying opportunity on the
chart.
We are traders —
we build profits from opportunities, not from bias.
I entered a long position at lower levels, and in my view, this area still offers a valid buying opportunity.
As I always say:
I’m not a political analyst, not an oil analyst, and not an OPEC member.
I’m simply a trader who follows a clear rule:
Price reaches my level and gives a signal → I buy
The level breaks and gives the opposite signal → I sell
📉📈 I don’t care whether the market goes up or down.
There is no bias here.
An opportunity is identified, execution is done,
and the rest is up to the market.
❗️Never try to stand in front of the market
and tell it where it should go because of a trendline
or an indicator.
The market moves ruthlessly in its own direction —
and if you fight it, you’ll only be left watching.
🎯 Real trading skill is finding a way to move with the market,
even when it doesn’t agree with you.
🌹 Stay safe & stay profitable

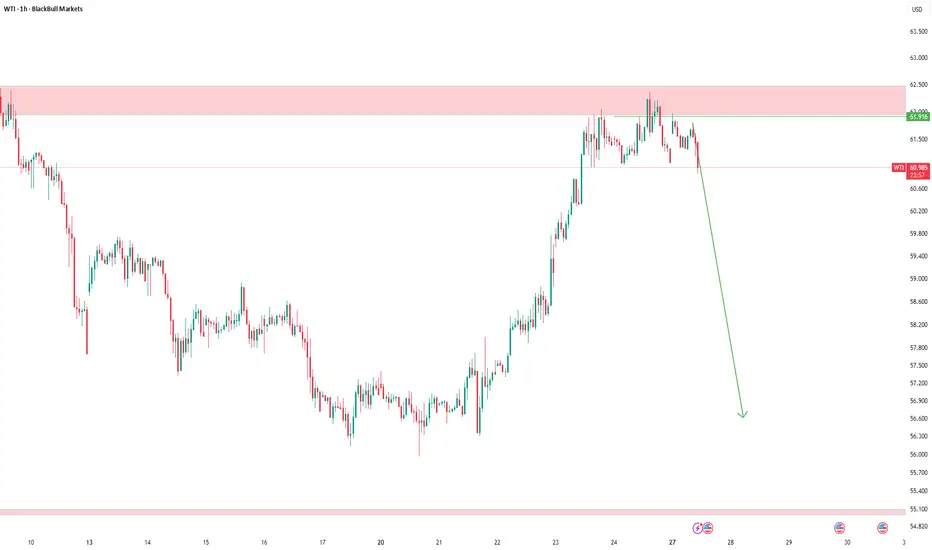
WTI Oil Bearish Outlook | Bear Flag Breakdown or Fakeout Ahead?WTI Oil (XTIUSD) price remains in a clear bearish structure trading below the descending channel and key resistance levels. After rejecting the 61.8% Fibonacci retracement near 58.30 oil continued to make lower highs and lower lows confirming sellers are still in control. The recent bounce from the 55.00 demand zone looks corrective and has formed a bear flag pattern which usually signals continuation to the downside. Price is currently consolidating around 57.20 below previous BOS and under the channel resistance indicating weakness.
As long as oil stays below 58.00–58.50 the bearish bias remains intact with liquidity resting below recent lows.
🔻Sell Setup 1: Bear Flag Rejection (Primary Setup)
- Sell Zone: 57.80 – 58.30
- Reason: Price is forming a bear flag after a strong drop and is rejecting the 61.8% Fibonacci level, with bearish market structure intact.
- Stop Loss: Above 59.50 (above channel & structure high)
- Targets: TP1: 55.00, TP2: 53.00, TP3: 52.00
🔻Sell Setup 2: Higher Resistance Sell (Liquidity Grab)
- Sell Zone: 59.80 – 60.30
- Reason: This zone aligns with strong resistance, previous supply, and descending channel top, where liquidity above recent highs may be taken before reversal.
- Stop Loss: Above 61.00
- Targets: TP1: 57.20, TP2: 55.00, TP3: 53.00
A strong rejection from the sell zone favors continuation lower, while a sustained break above 60.50 would invalidate the bearish setup.
Note
Please risk management in trading is a Key so use your money accordingly. If you like the idea then please like and boost. Thank you and Good Luck!

WTI/USD: Bullish Rally to 62.45?CFI:WTI is gearing up for a bullish rally on the 4-hour chart , with price rebounding from a key support zone near cumulative long liquidation levels, setting up a strong entry opportunity if buyers maintain control and push toward resistance amid recent consolidation. Entry from current levels could also be favorable with proper risk management.
Entry zone between 57.5-58.3 for a buy position. Target at 62.45 near resistance.🎯 Set a stop loss at 56.335 , offering a risk-reward ratio greater than 1:2 . 📊 Watch for confirmation with a bullish close above entry and rising volume, capitalizing on oil's volatility.🌟
Fundamentally , WTI crude has fallen to around $58.13 per barrel as of November 21, 2025, amid supply outpacing demand, but recent breakouts above $60.7 signal near-term positivity despite forecasts of further drops to $53.50-$45.00 due to OPEC+ hikes and record US output. 💡
📝 Trade Setup
🎯 Entry Zone (Long): 57.5 – 58.3
🎯 Target (TP1): 62.45
❌ Stop Loss: 56.335
⚖️ Risk-to-Reward: Greater than 1:2, offering a clean upside swing with defined invalidation.
What's your take on this setup? Drop your thoughts below! 👇

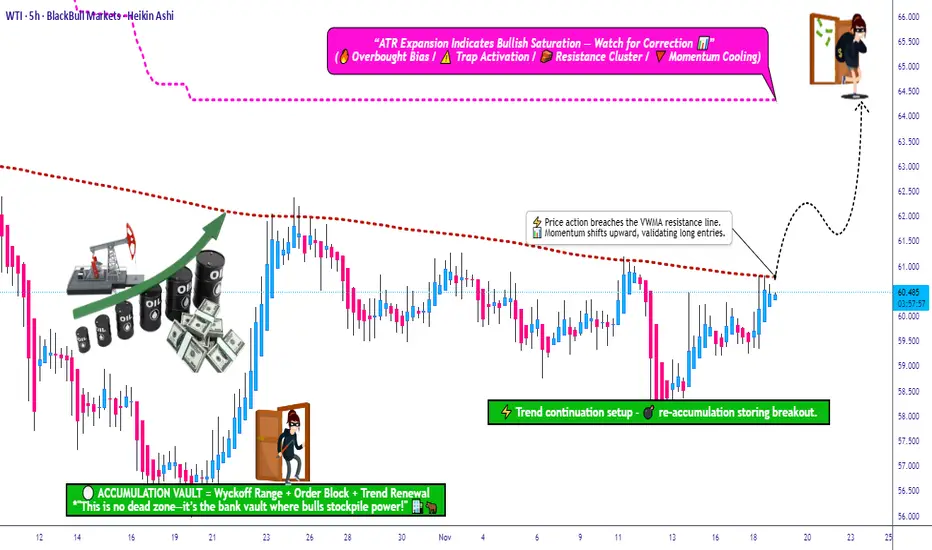
USOIL Breakout Confirmed—Is the Uptrend Ready to Extend?📈 WTI CRUDE OIL (USOIL) – SWING TRADE SETUP | VWMA BREAKOUT CONFIRMED 🛢️⚡
🎯 TRADE OVERVIEW
Asset: WTI Crude Oil (USOIL) – Energies Market
Trade Type: Swing Trade (Multi-Day Position)
Bias: 🟢 BULLISH – Volume Weighted Moving Average (VWMA) breakout confirmed near $61.00
📊 TRADE PLAN
🔹 Entry Strategy: "Thief Layering Method"
Primary Entry Zone: Post-VWMA breakout above $61.00
Layered Limit Orders (Multiple Entry Points):
🟦 Layer 1: $59.00
🟦 Layer 2: $59.50
🟦 Layer 3: $60.00
🟦 Layer 4: $60.50
Note: You can add more layers based on your capital allocation and risk tolerance. This strategy allows averaging into the position as price pulls back.
🛑 Stop Loss Management
Thief's SL: $58.00
⚠️ IMPORTANT: Dear Ladies & Gentlemen (Thief OG's),
This is MY stop loss level. Adjust YOUR stop loss based on YOUR strategy and risk management plan. I do not recommend blindly following my SL – manage your own risk and capital accordingly.
🎯 Take Profit Target
Primary Target: $64.00
Technical Reasoning:
SuperTrend ATR line acts as strong dynamic resistance
Potential overbought zone + bull trap risk
Escape with profits before reversal pressure
⚠️ IMPORTANT: Dear Ladies & Gentlemen (Thief OG's),
This is MY take profit target. Take YOUR money at YOUR own risk. You are responsible for your profit-taking strategy – trail stops, scale out, or exit fully based on YOUR trading plan.
🔗 CORRELATED PAIRS TO WATCH (USD-Denominated)
Monitor these related assets for confirmation and risk assessment:
🛢️ Energy Sector:
Brent Crude Oil (UKOIL) – Typically trades $2-5 above WTI; if Brent is bullish, WTI usually follows
Natural Gas (NATGAS) – Energy sector sentiment indicator
💵 Currency Pairs:
USD/CAD – Inverse correlation to oil (CAD = petro-currency). If oil rises, USD/CAD typically falls
DXY (US Dollar Index) – Strong dollar = bearish pressure on oil. Watch for weakness in DXY to support oil rally
📈 Equity Markets:
Energy Sector ETFs (XLE) – Tracks US energy stocks; bullish XLE confirms oil sector strength
S&P 500 (SPX) – Risk-on sentiment supports commodity prices
⚡ Key Correlation Points:
Oil ↑ + USD/CAD ↓ = Strong bullish confirmation
Oil ↑ + DXY ↓ = Supportive macro environment
Oil ↑ + XLE ↑ = Energy sector momentum aligned
💬 Engagement Call-to-Action
👍 If you found this analysis helpful, smash that LIKE button!
💬 Drop your thoughts in the comments – are you bullish or bearish on oil?
🔔 FOLLOW for more professional trade setups and market insights!
WTI Oil Market Outlook: Sell Zones & Key LevelsOil is still respecting a broader downtrend structure with consistent lower highs and lower lows. Price recently reacted from the $62–63 resistance zone (trendline + supply) confirming another lower high and maintaining bearish momentum. As long as oil stays below this zone the chart suggests a continuation toward the downside with next supports sitting near $56.30, $52.50 and potentially $50.00 if bearish pressure accelerates.
Only a clean breakout above $63 with strong candles would invalidate this bearish outlook and shift momentum toward the $66–70 zone.
🔻 Sell Setup 1
- Entry Zone: 62.00 – 63.00
- Stop Loss: 63.80
- Targets: TP1 59.00, TP2 56.30, TP3 52.50
🔻 Sell Setup 2
- Entry: Break below 57.50 and retest
- Stop Loss: 59.20
- Targets: TP1 56.30, TP2 52.50, TP3 50.00
Note
Please risk management in trading is a Key so use your money accordingly. If you like the idea then please like and boost. Thank you and Good Luck!

WTI Crude Oil – Update
I’ve entered a short position around this zone.
I don’t predict the market — I just follow opportunities.
It doesn’t matter what happens after entry; I simply follow my plan.
Those who’ve been following me know my system:
At a 1:1 reward, I close half of my position — that means zero risk.
If the market reverses and hits my stop, I lose nothing.
If it keeps moving, I use a trailing stop to catch as much of the move as possible.
That’s what real position management looks like.
And if my level breaks, I don’t just sit and watch — I’ll go long with the market.
I don’t predict or guess the future;
I trade with discipline, patience, and respect for the market.
I’m a trader, not a fortune teller.
WTI(20251027)Today's AnalysisMarket News:
① September's US CPI fell short of expectations across the board, leading traders to bet on two more Fed rate cuts this year.
② White House National Economic Council Director Hassett stated the data was "excellent," indicating slowing inflation and easing pressure on the Fed.
③ The White House stated that inflation data may not be released next month, a first for the time being. Technical Analysis
Technical Analysis:
Today's Buy/Sell Levels:
61.54
Support and Resistance Levels:
62.86
62.37
62.05
61.03
60.71
60.22
Trading Strategy:
If the market breaks above 62.05, consider entering a buy position, with the first target at 62.37.
If the market breaks below 61.54, consider entering a sell position, with the first target at 61.03.

WTI Crude Oil
As shown in my previous analysis (pinned below this post), we shorted oil from the range high.
Now price has reached the range low, where two key buy levels are marked on the chart ✅.
🔹 If these levels break, the opposite scenario still stands.
🔹 We’re not in OPEC, we don’t make political or war decisions, and we don’t give orders to the market.
🔹 We are traders, simply trying to profit from opportunities.
⚡️ Remember: being biased toward your analysis = blowing up your account and losing confidence.
🎯 Always follow the market, never fight it.

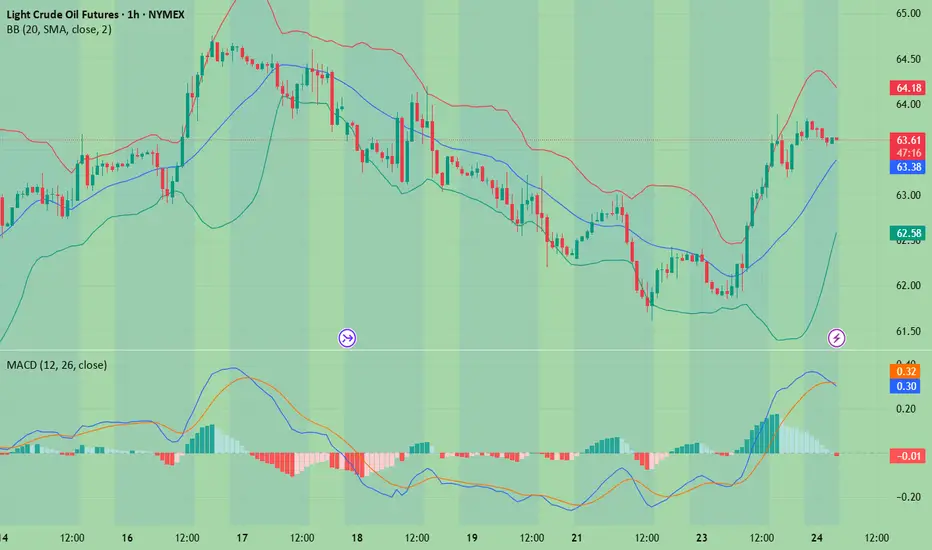
WTI Crude Nears Yearly LowsOver the past three trading sessions, WTI crude has fallen by more than 3.5%, as bearish sentiment has regained control of the market. Uncertainty over global oil demand has heightened investor caution, particularly amid the escalation of trade tensions between the United States and China, which has reignited fears of a slowdown in global trade. This scenario could directly impact the consumption of energy products such as oil, leading to a further decline in demand in the short term. As this atmosphere of concern persists, selling pressure is likely to continue strengthening in the coming sessions.
Strong Bearish Bias
Persistent selling pressure has reinforced the downward trendline that has remained in place throughout 2025, with no significant bullish corrections indicating a potential structural shift in market strength in the short term. As a result, the bearish bias continues to dominate, consolidating the market’s downward trajectory. As the price approaches key support levels, it will be crucial to determine whether current selling pressure remains a decisive force in upcoming price movements.
RSI
The RSI line continues to fall below the neutral 50 level, signaling that bearish momentum remains dominant on average over the past 14 sessions. However, it’s worth noting that the price is approaching a key support area, while the RSI nears the 30 level, considered the oversold zone. This could suggest a potential imbalance in market forces and open the door to short-term technical rebounds in the sessions ahead.
MACD
The MACD histogram remains below the neutral line (0), confirming that the short-term moving averages continue to show bearish momentum. If this pattern persists, it could result in stronger selling pressure extending into the medium term.
Key Levels to Watch:
$66 – Major Resistance: Aligns with the 200-period moving average. A bullish move reaching this level could trigger a temporary buying bias and challenge the prevailing downtrend line.
$62 – Near-Term Resistance: Corresponds to the 50-period moving average. If the price stabilizes around this area, it could lead to a neutral sentiment and a period of sideways consolidation in the short term.
$57 – Critical Support: Represents the lowest price levels of the year for WTI. A break below this level could intensify bearish pressure, although it may also serve as a support barrier, allowing for short-term technical corrections to the upside.
Written by Julian Pineda, CFA – Market Analyst

WTI Oil Shorting Opportunity | Technical + Macro Confirm📌 WTI CRUDE OIL | Money-Making Thief Plan 🛢️ (Swing/Day Trade)
🗡️ Thief Strategy Plan (Bearish Bias)
Plan: Bearish setup confirmed — sellers in control after MA rejection of bulls 📉
Entry (Layered Style):
63.000 🔪
62.500 🔪
62.000 🔪
61.500 🔪
(You may increase or adjust layers based on your own plan)
Stop Loss (Thief SL): @64.000 ❌
⚠️ Adjust SL according to your risk & strategy
Target (Thief TP): Key resistance zone + overbought trap @4.6700 🎯
Note: Dear Ladies & Gentlemen (Thief OG’s) — I don’t recommend locking only my TP. Take your profits wisely & manage risk responsibly. 💰
❓ Why This Plan?
Moving average rejection confirms sellers’ dominance ⚔️
Technical indicators showing strong sell bias 📉
Layered entry strategy helps in catching moves efficiently 🎯
Oversupply risk + weak demand = bearish fuel 🔥
Retail & institutions both leaning short-side heavy 🐻
🔍 Market Analysis (Technical + Fundamental + Macro + Sentiment)
📊 Real-Time Price Action - Sep 05
Daily Change: -1.03%
Monthly Change: -2.84%
Yearly Change: -8.44%
😊 Retail & Institutional Sentiment
Retail Traders: 35% 🐂 | 55% 🐻 | 10% 😐
Institutional Traders: 30% 🐂 | 60% 🐻 | 10% 😐
🌡️ Fear & Greed Index
Current: 25/100 — Fear 😟
Mood: Cautious, driven by oversupply fears + weak demand
⚒️ Fundamental Score: 40/100 (Bearish)
U.S. crude inventories unexpectedly +2.42M vs. -2.19M expected 📈
OPEC+ considering production increase 🌍
Weak China demand signals 📉
🌐 Macro Score: 35/100 (Bearish)
Fed rate cut expectations (25bp likely in September) 💸
Global slowdown fears 🌎 (Europe + Asia weak data)
Geopolitical risks (Russia-Ukraine) limited impact 🚨
🏁 Overall Market Outlook: Bearish (Short Bias) 🐻
Declining prices + rising inventories + OPEC+ supply hike risk
Technicals = Strong Sell (daily/weekly)
Sentiment favors sellers across the board
🔮 Key Takeaway
WTI/USOIL remains heavy under supply pressure + demand weakness.
Market sentiment is fearful, with both retail & institutions leaning short.
⚡ Keep eyes on U.S. jobs data + OPEC+ decisions for any trend shifts.
📌RELATED PAIRS TO WATCH
BRENT CRUDE ( TVC:UKOIL ): $66.42 (-1.8% daily)
NATURAL GAS ( FX:NGAS ): $2.84 (-0.7% daily)
ENERGY ETFS: XLE, USO, UCO
OANDA:CADJPY : Oil-correlated currency pair
ENERGY STOCKS: NYSE:XOM , NYSE:CVX , NYSE:COP , NYSE:SLB
✨ “If you find value in my analysis, a 👍 and 🚀 boost is much appreciated — it helps me share more setups with the community!”
#USOIL #WTI #CrudeOil #ThiefTrader #EnergyMarkets #Commodities #OPEC #SwingTrade #DayTrade #OilAnalysis

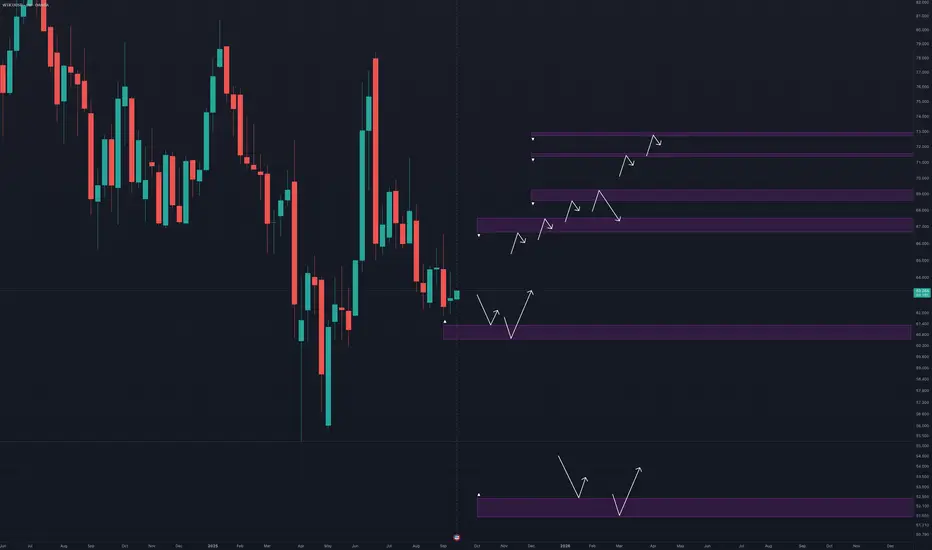
WTI Crude Oil🔹 I’ve marked the key resistance zones.
🔹 If I see a reversal signal at any of these levels, I’ll go short.
🔹 The breakout scenario is always valid too—if a level breaks, I’ll take the trade in the direction of the market.
🚫 No bias towards numbers, levels, or analysis.
✨ The key is to flow with the market, not fight it. If you try to stand against it, the market won’t just take your money—it will crush your confidence too.
🎯 We’re only a small part of a bigger picture. Stay flexible, stay unbiased.

WTI(20250924)Today's AnalysisMarket Analysis:
Federal Reserve Chairman Powell stated that the policy rate remains somewhat restrictive, but allows the Fed to better respond to potential economic developments; tariffs are expected to have a one-time pass-through effect; and decisions will "never be based on political considerations." Fed spokespersons noted that Powell's comments indicate that he believes interest rates remain tight, potentially opening the door for further rate cuts.
Technical Analysis:
Today's Buy/Sell Levels:
63.01
Support and Resistance Levels:
65.01
64.26
63.77
62.24
61.75
61.01
Trading Strategy:
On a break above 63.77, consider a buy entry, with the first target at 64.26.
On a break below 63.01, consider a sell entry, with the first target at 62.24
Crude Oil Monthly Forecast: September 2025
The West Texas Intermediate Crude Oil market has been rather negative during the month of August, but at the end of the month we saw the market bounce roughly 50% of the move, and as I do this analysis at the end of the month, we are sitting at a crucial level.
This does make a certain amount of sense, because there are a lot of questions right now about where the global economy is going.
Crude Oil and the Economy
Keep in mind that crude oil is extraordinarily important for most economies, and of course the transportation of goods and services. In other words, crude oil will rally in times of economic growth but also will struggle in times where growth is extraordinarily limited. That’s the question we find ourselves trying to answer at the moment, and this may be part of the reason why we are hanging around and trying to sort out where we are going next.
Another major problem at the moment is the fact that Russia, OPEC, in the United States are all ramping up production, which of course will drive down price as supply is getting to be too much. Between that and the possibility of the global economy slowing down, this could be a very bad sign for crude oil. This isn’t to say that we need to fall apart, just that it might be extraordinarily difficult for oil to get a bit of a bid at the moment.
Ultimately, I think the $65 level continues to be an area of interest, as the price has acted like a magnet more than once. If we can rally from here, somewhere around the $60 level I would expect to see a lot of resistance. On the other hand, if we drop from here, I think somewhere around the $60 level there should be significant support. Anything below would be an extraordinarily negative sign. I believe we are trying to find some type of range, perhaps between the $62 level and the $67 level, but we will have to wait and see how that plays out. Either way, I would anticipate choppy and basically sideways action for the month.

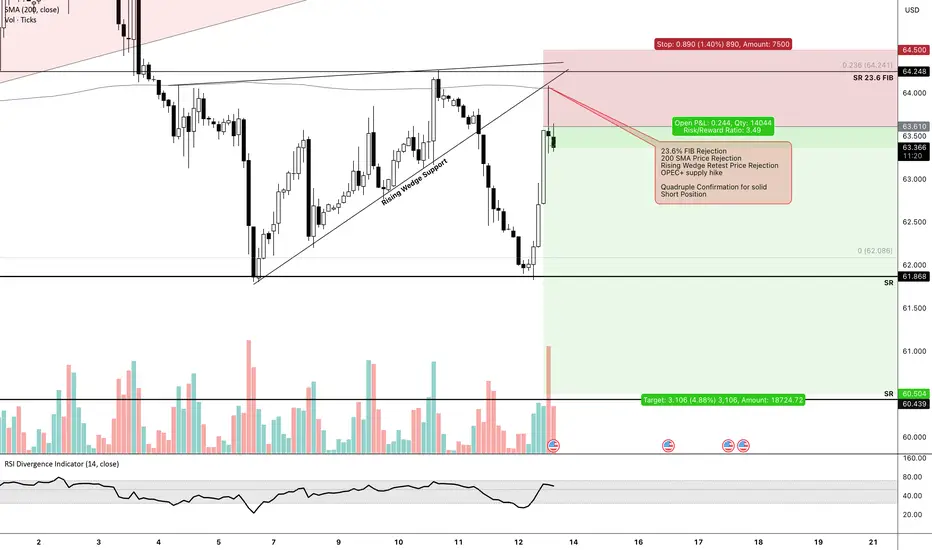
OIL Trade Setup - September 12th📲 NFX TRADE ALERT – Swing Setup
💹 Instrument: Crude Oil GBEBROKERS:USOIL
🛒 Trade Type: Swing – Sell at Market
📍 Entry: $63.60
⛔ Stop Loss: $64.50
✅ Target Profit: $60.50
📊 Trade Setup Analysis – GBEBROKERS:USOIL
🔻 23.6% FIB rejection
🔻 200 SMA rejection
🔻 Rising wedge retest rejection
🔻 OPEC+ supply hike
That’s quadruple confirmation supporting a solid short position.
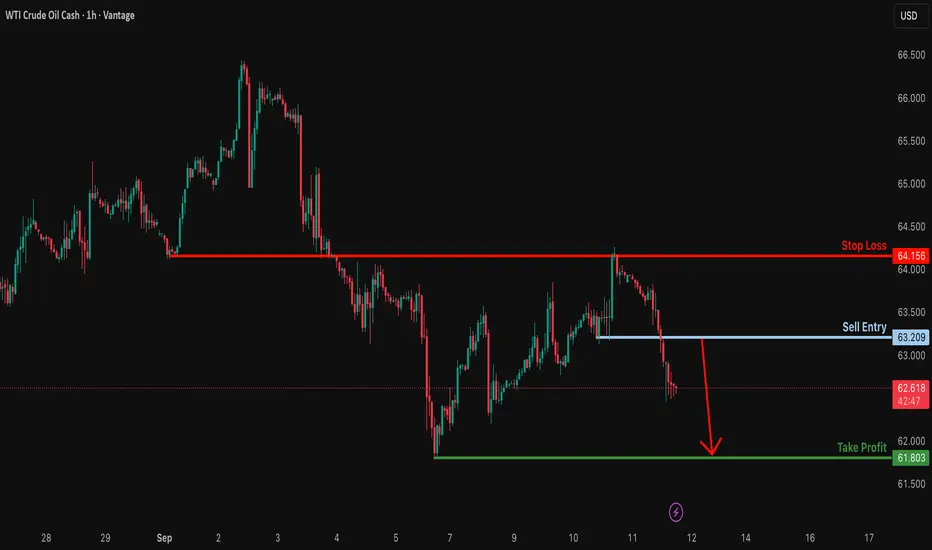
Bearish continuation?USO/USD is rising towards the resistance level, which is a pullback resistance, and could drop from this level to our take profit.
Entry: 63.20
Why we like it:
There is a pullback resistance level.
Stop loss: 64.15
Why we like it:
There is an overlap resistance level.
Take profit: 61.80
Why we like it:
There is a swing low support.
Enjoying your TradingView experience? Review us!
Please be advised that the information presented on TradingView is provided to Vantage (‘Vantage Global Limited’, ‘we’) by a third-party provider (‘Everest Fortune Group’). Please be reminded that you are solely responsible for the trading decisions on your account. There is a very high degree of risk involved in trading. Any information and/or content is intended entirely for research, educational and informational purposes only and does not constitute investment or consultation advice or investment strategy. The information is not tailored to the investment needs of any specific person and therefore does not involve a consideration of any of the investment objectives, financial situation or needs of any viewer that may receive it. Kindly also note that past performance is not a reliable indicator of future results. Actual results may differ materially from those anticipated in forward-looking or past performance statements. We assume no liability as to the accuracy or completeness of any of the information and/or content provided herein and the Company cannot be held responsible for any omission, mistake nor for any loss or damage including without limitation to any loss of profit which may arise from reliance on any information supplied by Everest Fortune Group.
WTI Crude Oil – Range Support in FocusWe're waiting for price to reach the bottom of the range, and with a solid buy signal, we’ll consider going long.
However, since this level has been tested multiple times, it’s highly vulnerable to stop fishing — so caution is key.
As always, we’re ready for all scenarios:
If price breaks below, we’ll wait for a pullback to enter short.
But right now, we’re watching the range support for potential longs

Crude Oil Warning $66.40 Flip Signals $63.86 TargetWTI rolled over after failing near $68.66096 (top red dashed line). The breakdown through $66.40002 turned that level into resistance 🚧. After a sharp selloff, price is now hovering around the $65.54 area (thin entry line labeled 65.54232), just beneath the minor pivot band at 65.54 / 65.52 / 65.21 (green dashed cluster labeled 65.54232 • 65.52347 • 65.20824). The structure is lower-high → lower-low, which keeps momentum bearish while price holds below $66.40. If sellers keep control, the next magnet is the confluence support around $63.86661 (first lower green dashed line), with extension into $63.51000–$63.46746 if momentum accelerates.
You can also see repeated “S” tags on the push down from the high and into the mid-range, while the “B” tags cluster only at pullback lows—classic distribution behavior. Any spikes toward $66.07 (label 66.07275) and especially $66.40 should attract supply unless bulls reclaim and hold above that zone.
Trade setup 🎯 (from the chart):
• Entry: $65.54232 (≈ $65.54)
• Stop-loss: $66.07275 (≈ $66.07), conservative SL above $66.40002 if you prefer more room
• Targets: $63.86661 first take-profit; stretch targets $63.51000 → $63.46746
This offers a solid bearish R:R while price stays capped beneath $66.40. As it moves your way, book small profits 💰 at each objective, trail stops 🔒 (e.g., to $65.52 once under $65.21), and size the position to your own risk tolerance—WTI can spike on headlines.
Invalidation: A sustained reclaim and hold above $66.40 would neutralize the immediate bearish bias and open room back toward $68.66. Until then, the path of least resistance remains down 📉.
