WUSD - Wormhole | Leading Interoperability Platform | BlackRockHi
Wormhole has 2B+ in TVL and leads bridging and crosschains transactions for BlackRock and some other big institutions.
This is not a trading advice.
Thanks
Gex
WUSDT

WORMHOLE W/USD - 1DAY - 1 WEEK TFOn the chart, we can see two channels : one reflects the reaction to previous movement and the other shows the potential current setup.
Inside of each channel, there is a zone of uncertainty (marked with dashed lines) — within this range the price may shake out weak hands and accumulate positions.
After a breakout and confident candle close above this zone, we can expect a strong upward move.
The key point is to wait for a candle body to close above the zone boundary to confirm the impulse.
Additionally, the price is still moving within a global descending channel.
To reach higher targets it’s crucial for the market to break out and hold above the upper boundary of this long-term downtrend channel.

Wormhole to da moonWormhole did not just accumulate for 180 days to pump and dump around this zone. Q1 is going to be awesome for W accumulations.
First two targets are very conservative, will be playing step by step.
Box zone determines bullishness
Wormhole is going to be one of the coins to talk during 2025.
Merry Christmas!

W Secondary. Reversed Head and Shoulders Key Area. 18 09 25Logarithm. 3 days.
Main trend 23 03 2025
A breakout of the previously mentioned key resistance (pair to USD) occurs on huge buying volume and an exit from the sideways trend (inverse head and shoulders).
Local targets, in case the inverse head and shoulders pattern is realized and a bowl forms at the next resistance level (previous consolidation).

WUSDT UPDATE#W
UPDATE
W Technical Setup
Pattern: Bullish Falling Wedge Pattern
Current Price: $0.2145
Target Price: $0.3010
Target % Gain: 110.29%
$W is breaking out of a falling wedge pattern on the 1D timeframe. Current price is $0.2145 with a target near $0.3010, showing about 40% potential upside. The breakout confirms bullish momentum with structure favoring continuation. Always use proper risk management.
Time Frame: 1D
Risk Management Tip: Always use proper risk management.

WUSDT UPDATE#W
UPDATE
W Technical Setup
Pattern: Bullish Falling Wedge Pattern
Current Price: $0.2145
Target Price: $0.3010
Target % Gain: 40.29%
$W is breaking out of a falling wedge pattern on the 1D timeframe. Current price is $0.2145 with a target near $0.3010, showing about 40% potential upside. The breakout confirms bullish momentum with structure favoring continuation. Always use proper risk management.
Time Frame: 1D
Risk Management Tip: Always use proper risk management.

$WUSDT Breakout: 269% Potential Ahead!$W just broke past a major resistance level, setting its sights on 0.4075, which could mean a massive 269% Gain.
After a long downtrend, it's finally showing some serious bullish momentum.
If this continues, we could see some big moves heading into October.
DYOR, NFA

W Market Update📊 $W Market Update
If $W retraces to the green zone around $1.279 🟢
👉 Potential bounce area for long entry 🚀
⚡ Trade smarter, not hope 🔑

WUSDT Forming Falling WedgeWUSDT is currently forming a strong bullish setup as it has developed a classic Falling Wedge pattern, which is historically known as a reversal and continuation pattern. This structure often indicates that selling pressure is weakening while buyers are gradually stepping in with stronger momentum. The breakout potential from this wedge suggests a strong upside opportunity supported by good volume, signaling that market participants are positioning for a possible bullish rally.
With an expected gain of 50% to 60%+, WUSDT is becoming an attractive pick for traders looking for high-reward setups. The increasing trading activity reflects growing confidence among investors, and this could act as a catalyst for significant price movement once the breakout is confirmed. Strong buying volume further validates the possibility of sustained bullish momentum in the near term.
The combination of a falling wedge breakout and rising investor interest creates an ideal scenario for WUSDT to enter its next growth phase. As long as it maintains support levels and continues to attract liquidity, the probability of a sharp upward move remains high. Many traders will be keeping a close eye on this pair, as the current chart setup aligns well with previous successful wedge breakouts seen across the market.
✅ Show your support by hitting the like button and
✅ Leaving a comment below! (What is You opinion about this Coin)
Your feedback and engagement keep me inspired to share more insightful market analysis with you!

Inverted Head & Shoulders · Wormhole TokenI added the little pattern to the picture. Keep in mind that this is a weekly chart. So the pattern looks small but it actually covers a long period of time because of each candle contains 7 days of price action. Weekly.
Head and shoulders. That's the pattern. In this case inverted because the standard pattern is a bearish reversal signal. It tends to show up at the top of a trend. You get the left shoulder (a high/peak) followed by the head (a higher high), then the right shoulder (lower high) and you have your reversal pattern. When the neckline of the pattern breaks comes the crash.
When the patterns shows up at the end of a downtrend it becomes the "inverted head and shoulders (iH&S)" as a bullish reversal signal.
In this chart each point has really high volume. How interesting. And this week is producing the highest volume ever and it is buying and it is green. This is all happening at the bottom.
The left shoulder produced high volume in March/April. Then the head has really high volume in June, and the right shoulder has the highest volume ever now, late August 2025.
The bottom is in now for more than two months. The bottom range has been active for more than five months.
Wormhole Token already hit bottom.
WUSDT is preparing for a massive bullish run. This trading pair can grow for years, the same for many others. Just like many projects did between 2023 and 2024. Remember, the market is big now. Just because one project peaks doesn't mean the entire market is in the same place. They will all peak, but it takes time.
Years of higher highs and higher lows. Your position is safe.
Trust the Master.
Namaste.

WUSDT Bullish Reversal Confirmed?BINANCE:WUSDT has been moving within a descending channel since the start of the year, forming lower highs and lower lows. Recently, the price broke out of the channel resistance, showing strength with increased buying volume. This breakout suggests that bearish momentum is weakening, and a potential bullish reversal could be underway.
Stop loss : $0.070
Target: 100%-250%
Cheers
Hexa

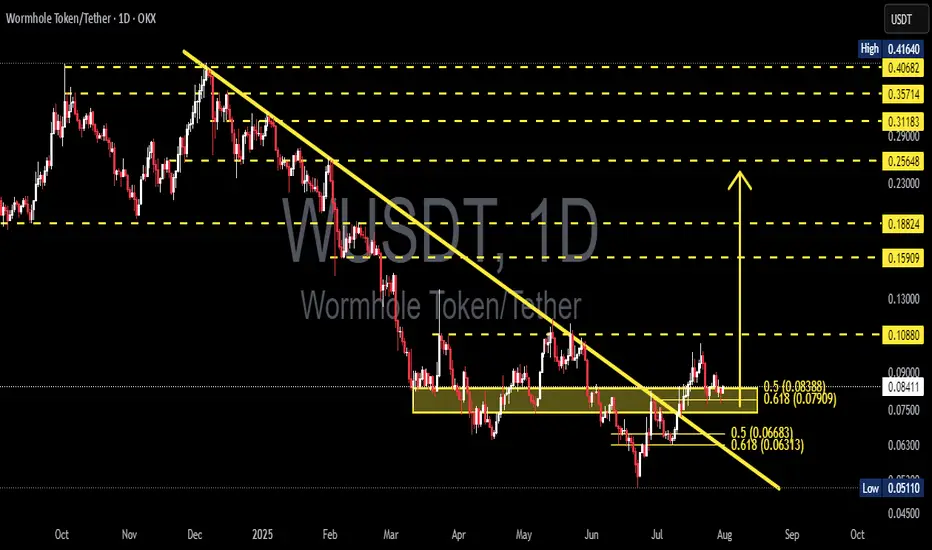
WUSDT Major Downtrend Break! Now Testing the Golden Pocket!🧩 Overview:
Wormhole Token (WUSDT) has finally broken out of a long-standing downtrend line that has been pressing the price down since February 2025. This breakout is a significant technical development and now the price is undergoing a critical retest phase — a moment that could mark the beginning of a major bullish reversal.
Price is currently consolidating around the Fibonacci 0.5–0.618 retracement zone (0.079–0.084), commonly known as the "Golden Pocket Zone" — a popular area for smart money accumulation.
---
🧠 Pattern & Structure:
📉 A long-term descending trendline was decisively broken, signaling a potential shift in market sentiment.
📦 A consolidation range is forming within a yellow support box — between 0.07909 and 0.08388, a prior resistance zone that is now being retested as support.
🔁 This is a classic breakout-retest structure, often seen before major price expansions.
---
🟢 Bullish Scenario (Reversal Potential):
If the price holds above the 0.079–0.084 support range, it sets the stage for a potential bullish continuation. Key upside targets include:
🔹 0.10880 – Previous distribution zone.
🔹 0.13000 – Psychological and structural resistance.
🔹 0.15909 – March resistance.
🔹 0.18824 – Measured move target from breakout.
🔹 0.23000–0.29000 – Expansion zone if momentum sustains.
A strong bullish candle closing above 0.09000 with increasing volume would strengthen this outlook.
---
🔴 Bearish Scenario (Failed Retest):
If the Golden Pocket fails to hold:
Price may retrace to lower supports:
🔻 0.07500 – Minor support zone.
🔻 0.06300 – Key support from June.
🔻 0.05110 – Yearly low and last line of defense. A breakdown below this level would revalidate the bearish trend.
Traders should be cautious if daily closes fall below the yellow zone with high selling volume.
---
💡 Conclusion & Strategy:
WUSDT is currently at a critical technical juncture. A confirmed breakout has occurred, but the retest phase is what will validate the strength of this move.
🎯 Swing traders may look for entries within the 0.079–0.084 range with invalidation below 0.075.
📉 Short-sellers might wait for a confirmed breakdown below this support with volume confirmation.
Momentum is building — the next move could define the mid-term trend.
---
📊 Chart Highlights:
✅ Downtrend Breakout: Confirmed
✅ Retesting Key Fibonacci Zone (0.5–0.618)
✅ Former Resistance → Becoming Support
🚨 Crucial Bullish-Bearish Decision Zone
#WUSDT #WUSDTAnalysis #WormholeToken #CryptoBreakout #GoldenPocket #PriceAction #FibonacciLevels #AltcoinReversal #TechnicalAnalysis
WUSDT Approaching Major Breakout Point in Descending Channel!WUSDT is trading inside a well-defined descending channel on the daily chart. Price is now testing the upper boundary of the channel, showing signs of bullish strength after a strong move from the lower support.
If the price breaks and closes above the channel resistance, it could trigger a bullish trend reversal with a potential move toward the $0.23 zone.
Cheers
Hexa

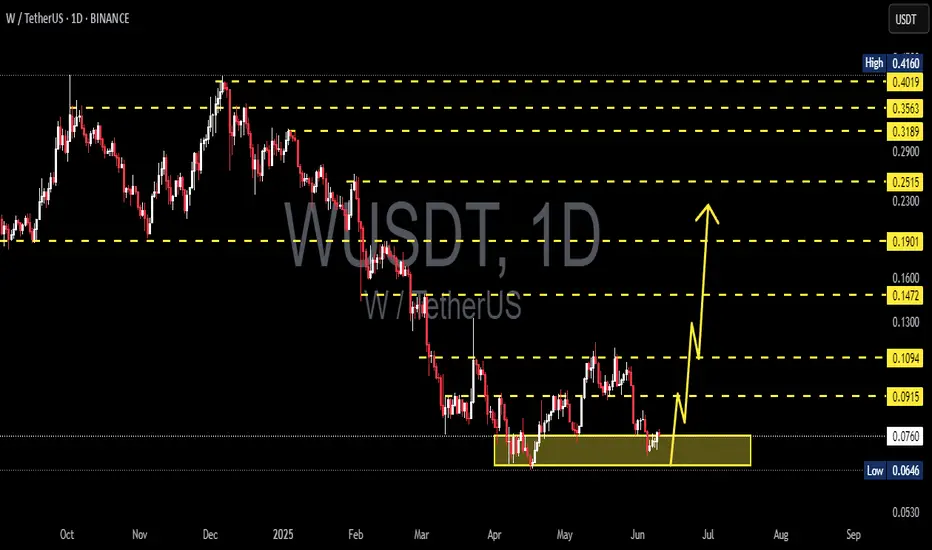
W/USDT Breaks Downtrend! Is This the Start of a Bullish Reversal🔍 Pattern and Chart Structure:
Timeframe: 1D (Daily)
Pattern: Breakout from a Descending Trendline that has been intact since late 2024.
Support and Resistance Levels:
Closest support: $0.0744
Key resistances: $0.0915 – $0.1087 – $0.1446 – $0.1852 – $0.2528 – $0.3197 – $0.4017
Volume & Momentum: The chart shows a price breakout above the descending trendline, likely accompanied by increased buying volume (volume confirmation is important).
🚀 Bullish Scenario:
If the price holds above the broken trendline:
A confirmed breakout occurs if the daily candle closes above $0.0744 and pushes toward $0.0915 and beyond.
Gradual target levels:
1. $0.0915 → $0.1087
2. $0.1087 → $0.1446
3. $0.1446 → $0.1852 (strong psychological resistance)
4. With strong bullish momentum, potential rally towards $0.25 – $0.40 range
📌 Note: If the price forms a higher low after the breakout, it further confirms a trend reversal.
🔻 Bearish Scenario:
If this breakout turns out to be a false breakout:
Price fails to hold above $0.0744
Drops back down to the support range around $0.0630 → $0.0500
If the price breaks below $0.0500, a further decline toward historical support at $0.0450 is possible
📌 A bearish confirmation would come from a daily candle closing back below the trendline with increased selling volume.
🧩 Conclusion:
Currently, W/USDT shows signs of a possible reversal after breaking the major long-term downtrend.
Breakout validation requires volume confirmation and strong follow-through.
The potential upside is attractive, but caution is advised in case of a false breakout.
#WUSDT #CryptoBreakout #AltcoinAnalysis #BullishReversal #TechnicalAnalysis #CryptoTrading #DescendingTrendline #BreakoutAlert #AltcoinSeason #SupportResistance

Wormhole Token Recovers From Bottom & Activates 2,400% PotentialTrue bottom and true recovery. We have a great situation here, this is a pair that has more than 2,400% potential for growth. The chart looks great right now, the signals are strong and confirmed.
Good afternoon my fellow Cryptocurrency trader, I hope you are having a nice Saturday. Let's consider this chart, a great opportunity for sure.
Wormhole Token (WUSDT) entered bottom zone 11-March, so already 111 days trading at bottom prices. The best time to buy.
After this initial low in March we have huge volume after a few days, and just two days ago another strong buyers day with a followup composed of two bullish signals. The DragonFly Doji yesterday and the full green candle today.
These are all strong bullish signals fully confirmed, which means higher prices next. I am showing only the daily chart but the potential for growth is extraordinary when focused on the long-term. This publication is time-based.
Right now we have great entry timing and prices...
The time is right, the time is ripe.
Another great altcoin for those looking to profit massively from the 2025 bull market.
Thank you for reading.
Namaste.

w partners with Ripple XRP.. alt season gemwhen alt season comes Q4 i expect $W to scam pump..
today it pumped 24% on the news with the partnership with Ripple / CRYPTOCAP:XRP
im waiting for a bottom around 3-4c to DCA in..
sell zone around 55-70c Q4

WUSDT Forming Falling WedgeWUSDT is beginning to show a powerful breakout signal from a well-defined falling wedge pattern, a classic technical setup often followed by strong bullish momentum. After weeks of steady downward pressure, the price has now pushed above the upper trendline, supported by growing volume, which further confirms the potential reversal in trend. This technical structure typically precedes large percentage moves, and in this case, an upside potential of 130% to 140%+ is projected.
This surge in price action is drawing significant attention from investors and traders alike, as WUSDT is currently trading at relatively undervalued levels with a visible shift in sentiment. The bullish wave forming on the chart shows not only strong technical demand but also a renewed sense of accumulation across the market. The broader altcoin market cycle also supports such aggressive moves as traders rotate into undervalued tokens with high reward potential.
Increased trading activity and volume on the breakout confirms that institutional and retail interest is gaining momentum in WUSDT. The aggressive price target zones indicate strong confidence among market participants. The coin’s technical setup aligns well with the crypto market’s current appetite for breakout plays, particularly those emerging from falling wedges and descending channels.
Given these factors, WUSDT presents an exciting opportunity for traders who are looking to capture sharp upward moves. With strong chart structure, breakout confirmation, and positive investor sentiment, the probability of a sustained bullish trend is high. A close watch on price continuation and support holding will be key as this move unfolds.
✅ Show your support by hitting the like button and
✅ Leaving a comment below! (What is You opinion about this Coin)
Your feedback and engagement keep me inspired to share more insightful market analysis with you!

WUSDT 1D Analysis W ~ 1D Analysis
#W Buy back gradually from here if you still have confidence in this coin with a short term target of at least 15%+
WUSDT 1D AnalysisW ~ 1D✅ Analysis
#W Buy after successfully breaking through this resistance line with a short-term target of at least 10%+
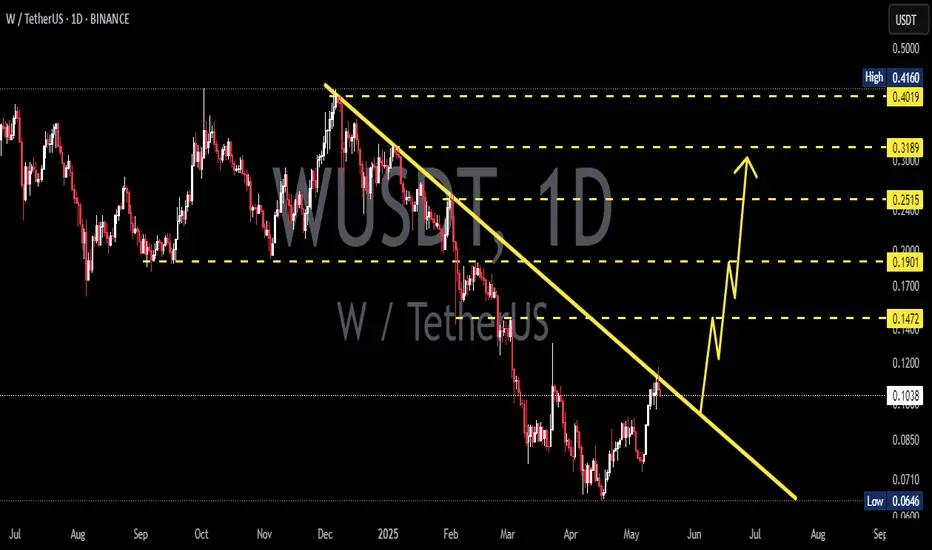
W / USDT Main trend. 23 03 2025Logarithm. Time frame 3 days. Descending channel, price in local clamping in consolidation at dynamic support of the internal channel. From listing -94% at the moment.
Local percentages, medium-term and long-term to key zones of chart logic and liquidity, are shown on the chart as a guide for building your tactics and risk control.
🔴 There is potential for a decline to external support of a large descending channel (optional). I showed this option for building tactics and money management. Such assets in terms of liquidity, as a rule, decrease by 96-98%
🟢 If, from this price clamp, the price goes up , then the first resistance is the dynamic resistance of the internal channel (from which there may be a local reversal). Then the external (similarly). If the trend breaks and exits the descending channel, then strong resistance is the previous consolidation of 0.24-0.36
Locally, this clamping zone looks like this.

Strong Breakout on WUSDT: Potential for Major Bullish Move WUSDT has recently completed a strong breakout from a key resistance zone, signaling a potential shift in momentum and attracting significant attention from traders. The technical setup points to a confirmed breakout with increased trading volume, which typically precedes a powerful rally. This move is further supported by market participants showing renewed interest in the project fundamentals, positioning WUSDT for a potential bullish continuation.
With solid volume pouring in post-breakout, WUSDT looks ready to make a major move to the upside. Current market structure indicates a healthy retest of the breakout level, setting the stage for a possible rally of 250% to 300% in the coming sessions. Such gains are within reach, especially if broader market sentiment remains positive and volume continues to climb.
Investor confidence in WUSDT is growing, as many see it as an undervalued gem ready to reclaim higher levels. Its technical strength, combined with strong buying activity, presents an attractive opportunity for both swing traders and long-term holders. Watch for key psychological resistance levels to act as future targets while support holds firm below.
✅ Show your support by hitting the like button and
✅ Leaving a comment below! (What is You opinion about this Coin)
Your feedback and engagement keep me inspired to share more insightful market analysis with you!

Trading opportunity for WUSDTBased on technical factors there is a Buy position in :
📊 WUSDT
🔵 Buy Now or Buy Stop by 0.89
🪫Stop loss 0.0740
🔋Target 0.1240
📏 R/R 4,2
💸RISK : 1%
We hope it is profitable for you ❤️
Please support our activity with your likes👍 and comments📝
