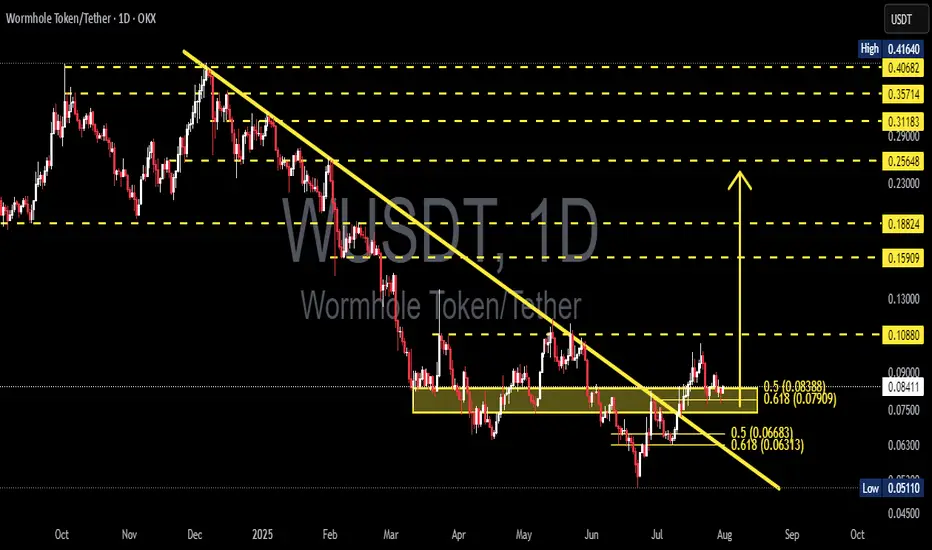
WUSDT Major Downtrend Break! Now Testing the Golden Pocket!🧩 Overview:
Wormhole Token (WUSDT) has finally broken out of a long-standing downtrend line that has been pressing the price down since February 2025. This breakout is a significant technical development and now the price is undergoing a critical retest phase — a moment that could mark the beginning of a major bullish reversal.
Price is currently consolidating around the Fibonacci 0.5–0.618 retracement zone (0.079–0.084), commonly known as the "Golden Pocket Zone" — a popular area for smart money accumulation.
---
🧠 Pattern & Structure:
📉 A long-term descending trendline was decisively broken, signaling a potential shift in market sentiment.
📦 A consolidation range is forming within a yellow support box — between 0.07909 and 0.08388, a prior resistance zone that is now being retested as support.
🔁 This is a classic breakout-retest structure, often seen before major price expansions.
---
🟢 Bullish Scenario (Reversal Potential):
If the price holds above the 0.079–0.084 support range, it sets the stage for a potential bullish continuation. Key upside targets include:
🔹 0.10880 – Previous distribution zone.
🔹 0.13000 – Psychological and structural resistance.
🔹 0.15909 – March resistance.
🔹 0.18824 – Measured move target from breakout.
🔹 0.23000–0.29000 – Expansion zone if momentum sustains.
A strong bullish candle closing above 0.09000 with increasing volume would strengthen this outlook.
---
🔴 Bearish Scenario (Failed Retest):
If the Golden Pocket fails to hold:
Price may retrace to lower supports:
🔻 0.07500 – Minor support zone.
🔻 0.06300 – Key support from June.
🔻 0.05110 – Yearly low and last line of defense. A breakdown below this level would revalidate the bearish trend.
Traders should be cautious if daily closes fall below the yellow zone with high selling volume.
---
💡 Conclusion & Strategy:
WUSDT is currently at a critical technical juncture. A confirmed breakout has occurred, but the retest phase is what will validate the strength of this move.
🎯 Swing traders may look for entries within the 0.079–0.084 range with invalidation below 0.075.
📉 Short-sellers might wait for a confirmed breakdown below this support with volume confirmation.
Momentum is building — the next move could define the mid-term trend.
---
📊 Chart Highlights:
✅ Downtrend Breakout: Confirmed
✅ Retesting Key Fibonacci Zone (0.5–0.618)
✅ Former Resistance → Becoming Support
🚨 Crucial Bullish-Bearish Decision Zone
#WUSDT #WUSDTAnalysis #WormholeToken #CryptoBreakout #GoldenPocket #PriceAction #FibonacciLevels #AltcoinReversal #TechnicalAnalysis
Wusdtsignals
WUSDT Approaching Major Breakout Point in Descending Channel!WUSDT is trading inside a well-defined descending channel on the daily chart. Price is now testing the upper boundary of the channel, showing signs of bullish strength after a strong move from the lower support.
If the price breaks and closes above the channel resistance, it could trigger a bullish trend reversal with a potential move toward the $0.23 zone.
Cheers
Hexa

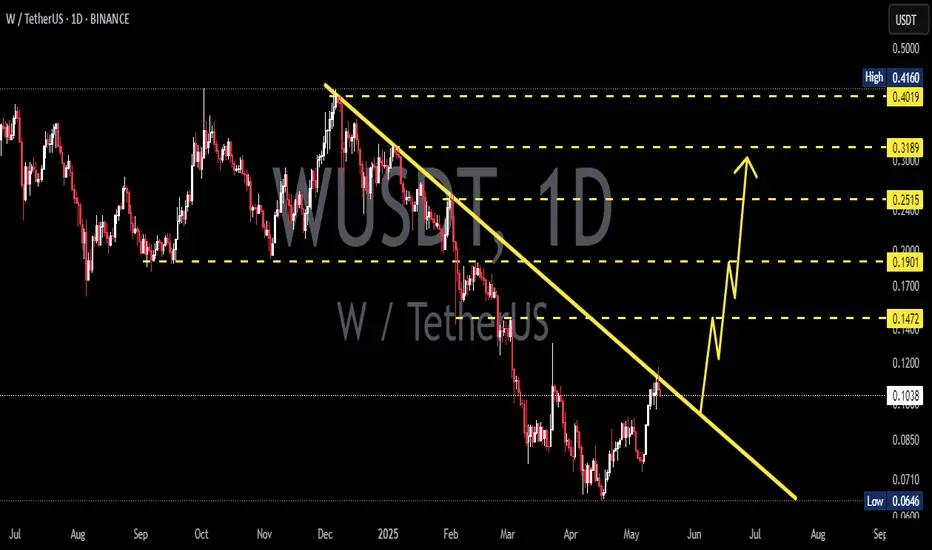
W/USDT Breaks Downtrend! Is This the Start of a Bullish Reversal🔍 Pattern and Chart Structure:
Timeframe: 1D (Daily)
Pattern: Breakout from a Descending Trendline that has been intact since late 2024.
Support and Resistance Levels:
Closest support: $0.0744
Key resistances: $0.0915 – $0.1087 – $0.1446 – $0.1852 – $0.2528 – $0.3197 – $0.4017
Volume & Momentum: The chart shows a price breakout above the descending trendline, likely accompanied by increased buying volume (volume confirmation is important).
🚀 Bullish Scenario:
If the price holds above the broken trendline:
A confirmed breakout occurs if the daily candle closes above $0.0744 and pushes toward $0.0915 and beyond.
Gradual target levels:
1. $0.0915 → $0.1087
2. $0.1087 → $0.1446
3. $0.1446 → $0.1852 (strong psychological resistance)
4. With strong bullish momentum, potential rally towards $0.25 – $0.40 range
📌 Note: If the price forms a higher low after the breakout, it further confirms a trend reversal.
🔻 Bearish Scenario:
If this breakout turns out to be a false breakout:
Price fails to hold above $0.0744
Drops back down to the support range around $0.0630 → $0.0500
If the price breaks below $0.0500, a further decline toward historical support at $0.0450 is possible
📌 A bearish confirmation would come from a daily candle closing back below the trendline with increased selling volume.
🧩 Conclusion:
Currently, W/USDT shows signs of a possible reversal after breaking the major long-term downtrend.
Breakout validation requires volume confirmation and strong follow-through.
The potential upside is attractive, but caution is advised in case of a false breakout.
#WUSDT #CryptoBreakout #AltcoinAnalysis #BullishReversal #TechnicalAnalysis #CryptoTrading #DescendingTrendline #BreakoutAlert #AltcoinSeason #SupportResistance

WUSDT 1D AnalysisW ~ 1D✅ Analysis
#W Buy after successfully breaking through this resistance line with a short-term target of at least 10%+
WUSDT – Major Resistance Zones Ahead! “This is where the battle happens—will resistance hold, or are we about to see an explosive breakout?”
🔥 Key Insights:
✅ Red Lines = Strong Resistance – These levels have proven themselves before, and now they are back in play.
✅ Risking 1R on Both – Calculated risk, sniper execution. No random entries, just smart positioning.
✅ LTF Confirmation is Everything – Price touching resistance means nothing—we wait for true weakness or strength before pulling the trigger.
💡 How I’m Trading This Like a Pro:
If Price Rejects Hard: I’ll wait for a clear LTF (5M/15M) breakdown with CDV divergence before shorting.
If We Break Resistance: No panic buys—I’ll wait for a clean breakout, retest, and LTF strength confirmation before considering longs.
Stops? Last swing high. Precision over emotions.
📉 Final Thought:
Retail traders FOMO, real traders wait. Patience, execution, and data-driven decisions win the game. We don’t guess—we react like pros.
“Follow me if you’re tired of chasing bad trades. Let’s trade like the 1%.” 🚀🔥📊
A tiny part of my runners;
💼 STMXUSDT: 2 Buying Areas
🐢 TURBOUSDT: Buy Zones and Buyer Presence
🌍 ICPUSDT.P: Massive Upside Potential | Check the Trade Update For Seeing Results
🟠 IDEXUSDT: Spot Buy Area | %26 Profit if You Trade with MSB
📌 USUALUSDT: Buyers Are Active + %70 Profit in Total
🌟 FORTHUSDT: Sniper Entry +%26 Reaction
🐳 QKCUSDT: Sniper Entry +%57 Reaction
j
A tiny part of my runners:
🎯 ZENUSDT.P: Patience & Profitability | %230 Reaction from the Sniper Entry
🐶 DOGEUSDT.P: Next Move
🎨 RENDERUSDT.P: Opportunity of the Month
💎 ETHUSDT.P: Where to Retrace
🟢 BNBUSDT.P: Potential Surge
📊 BTC Dominance: Reaction Zone
🌊 WAVESUSDT.P: Demand Zone Potential
🟣 UNIUSDT.P: Long-Term Trade
🔵 XRPUSDT.P: Entry Zones
🔗 LINKUSDT.P: Follow The River
📈 BTCUSDT.P: Two Key Demand Zones
🟩 POLUSDT: Bullish Momentum
🌟 PENDLEUSDT.P: Where Opportunity Meets Precision
🔥 BTCUSDT.P: Liquidation of Highly Leveraged Longs
🌊 SOLUSDT.P: SOL's Dip - Your Opportunity
🐸 1000PEPEUSDT.P: Prime Bounce Zone Unlocked
🚀 ETHUSDT.P: Set to Explode - Don't Miss This Game Changer
🤖 IQUSDT: Smart Plan
⚡️ PONDUSDT: A Trade Not Taken Is Better Than a Losing One
💼 STMXUSDT: 2 Buying Areas
🐢 TURBOUSDT: Buy Zones and Buyer Presence
🌍 ICPUSDT.P: Massive Upside Potential | Check the Trade Update For Seeing Results
🟠 IDEXUSDT: Spot Buy Area | %26 Profit if You Trade with MSB
📌 USUALUSDT: Buyers Are Active + %70 Profit in Total
🌟 FORTHUSDT: Sniper Entry +%26 Reaction
🐳 QKCUSDT: Sniper Entry +%57 Reaction
📊 BTC.D: Retest of Key Area Highly Likely
I stopped adding to the list because it's kinda tiring to add 5-10 charts in every move but you can check my profile and see that it goes on..

WUSDT 1WW ~ 2D
#W If you still have Conviction on this coin,. This is a very good support block for now,. Buy in stages. Target 20%++

WUSDT 1WW ~ 2D
#W If you still have Conviction on this coin,. Buy gradually inside this pattern,. Or if you are a trader who plays it safe, wait for this resistance line to be successfully broken. minimum target 20%++

WUSDT 3DW ~ 3D
#W Retesting this support level,. If you still have Conviction on this coin,. This support block would be a very good buy for now, with minimal short-term targets 20%+

WUSDT Potentially a low risk buyThe crypto space is potentially set for a bull run as we have seen BINANCE:BTCUSDT gain momentum and finally breaking above the 73,630.47 recent high to hit a new all time high of about flying slightly above the 76,000 mark. This has triggered momentum in most alt coins and BINANCE:WUSDT is no different.
We have seen market creating multiple bottoming out around the 0.1947 zone, I would love to see price breaking out of the 0.2787 area and retest same before taking a long with targets at 0.5 and probably 1.3 area.
For every trade you plan to take, do a thorough analysis yourself as past results does not guarantee future results. #WUSDT

WUSDT 3DW ~ 3D
#W If you still have Conviction on the coin,. Buy gradually within this pattern, with a minimum target of 20%+,. When this resistance line is successfully broken,. Bulls will start to dominate.

WUSDT Forms Bullish Flag: Targeting Strong Upside PotentialWUSDT technical analysis update
WUSDT has formed a bullish flag pattern on the 1-hour chart, and the price is now moving toward the flag resistance for a potential breakout. The price is currently trading above both the 100 and 200 EMA. Once the breakout is confirmed, we can expect a strong bullish move. Additionally, the price has already broken the double-bottom resistance on the daily chart and formed the flag pattern just above it.

#W (SPOT) entry range( 0.199 - 0.21) T.(0.249) SL (0.1937)entry range ( 0.199 - 0.21)
Target(0.249)
SL .4H close below (0.1937)
1:2 Trade
**** #Manta ,#OMNI, #DYM, #AI, #IO, #XAI , #ACE #NFP #RAD #WLD #ORDI #BLUR #SUI #Voxel #AEVO #VITE #APE #RDNT #FLUX #NMR #VANRY #TRB #HBAR #DGB #XEC #ERN #W ****
