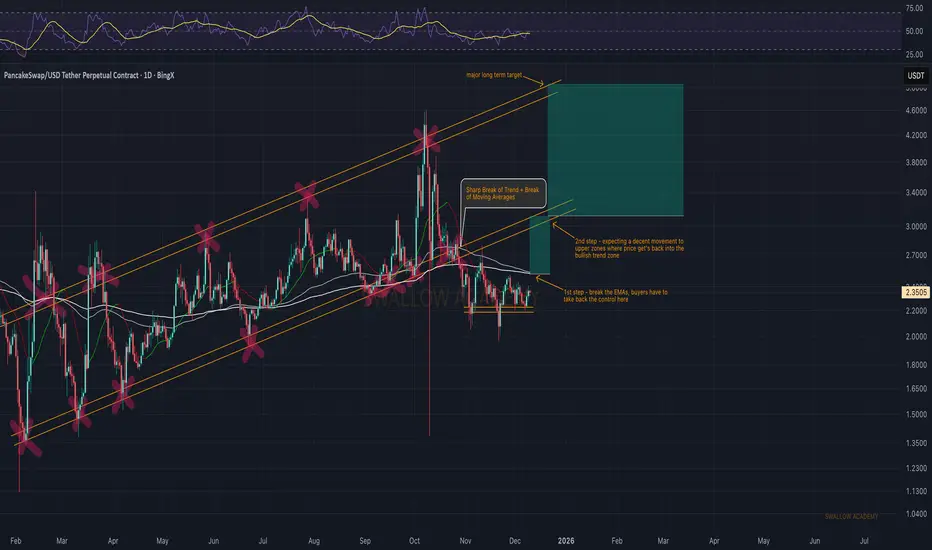
Pancake Swap (CAKE): Getting Ready To Enter The Bullish TrendCAKE is holding the support zone, but buyers still need to take back control by reclaiming the EMAs. That’s the first step before we even think about a move into the upper zones.
If buyers manage to secure the EMAs, we should see price pushing back toward the old bullish trend zone. That’s where the clearer momentum shift forms and the long-term target becomes realistic again. For now, it’s all about reclaiming those EMAs and building from this support.
Swallow Academy
X-indicator
SHIB fighting EMAHey guys, SHIB is setting up for a potential breakdown on the 1H timeframe, and the risk-reward is looking pretty clean for short positions right now.
Price is trading at $0.00000853, sandwiched between EMA20/50 resistance at $0.00000857-858 and the make-or-break EMA200 support at $0.00000852. The ADX reading of 56.0 confirms we're in a strong trending environment, and that trend is decidedly bearish. RSI at 30.8 is approaching oversold, but without bullish divergence and with volume running 77% below average, there's no conviction for a reversal yet.
The setup: short entries around $0.00000855 with a tight stop above $0.00000865 (invalidation if we reclaim the EMA cluster). First target sits at the Bollinger Band lower support at $0.00000844, with an extended target at $0.00000838 if the EMA200 breaks. That gives us roughly 1:2.5 risk-reward on the conservative target and 1:4+ if we get the full move. The MACD remains bearish, MFI shows weak money flow at 36.5, and the internal market state is reading choppy with only 17% directional confidence, but the sell signals are stacking up.
Key risk: if price reclaims $0.00000859 (BB middle band) with volume, this whole setup gets invalidated and we could see a squeeze back toward $0.00000874. But until that happens, the path of least resistance is down, especially with such weak participation on bounces.
How are you playing this move? Waiting for the EMA200 break or already positioned short?

ICP USDT LONG SIGNAL---
📢 Official Trade Signal – ICP/USDT
📈 Position Type: LONG
💰 Entry Price: 3.419
---
🎯 Take-Profit Targets (Partial Exits):
• TP1: 3.472
• TP2: 3.541
• TP3: 3.596
• TP4: 3.660
• TP5: 3.743
• TP6: —3.828
---
🛑 Stop-Loss: 3.300
📊 Timeframe: 15m
⚖️ Risk/Reward Ratio: ≈ 2.03 (based on TP4)
💥 Suggested Leverage: 5× – 10×
---
🧠 Technical Analysis Summary
ICP is showing signs of bullish momentum after finding support near the 3.419 level. The market structure on the 15-minute chart indicates a potential upward shift, with price action forming higher lows and testing key resistance zones. The identified take-profit levels align with previous swing highs and liquidity concentrations.
The critical upside targets are:
3.472 → 3.541 → 3.596 → 3.660
A confirmed break above TP1 (3.472) is expected to accelerate momentum toward the subsequent targets, particularly if accompanied by increasing buying volume.
---
⚙️ Trade Management Rules
✔ Take partial profit at each TP level
✔ Move stop-loss to entry point once TP1 is reached
✔ Trail stop-loss upward as price advances
✔ No re-entry if stop-loss (3.300) is triggered
✔ Confirm bullish structure and momentum before entering
---
📌 TradingView Hashtags
#ICPUSDT #ICP #CryptoSignal #LongSetup
#TradingView #FuturesTrading #TechnicalAnalysis
---
Disclaimer: Always practice proper risk management and verify market conditions before entering any trade.

Bitcoin vs. Tech: The "Catch-Up" PlayThe market is whispering a secret: Tech (QQQ) is leaving Bitcoin behind. While the Nasdaq has already smashed through resistance and is sprinting higher, Bitcoin is stuck napping in a descending channel. But in trading, divergence is just opportunity in disguise.
The Setup:
The Pattern: Bitcoin is painting a textbook Bull Flag—a pause that refreshes.
The Signal: Look at the Cyan Diamonds appearing right now on the BTC chart. Historically, these specific algo prints mark the exact moment "smart money" starts accumulating before the next leg up.
The macro bull trend is still very much alive despite the short-term noise.
The Trade: Bitcoin is coiled like a spring. If the correlation holds, BTC is due to "catch up" to the QQQ breakout. Watch for a break above the upper blue trendline. If that snaps, the nap is over, and the race is back on.
Current Status: Loading the next impulse move up.

Ribbon Flip SignalsRibbon Flip Signals highlight the exact moment when market momentum shifts and the trend direction changes. When the ribbon transitions from bearish to bullish, a Buy Flip appears, signaling rising strength and a potential upward move. When the ribbon shifts from bullish to bearish, a Sell Flip appears, marking weakening momentum and a likely reversal or exit point.
Ribbon Flip Signals help traders spot trend changes early, filter out noise, and enter only when momentum aligns with direction. This makes every shift in the ribbon a clear, actionable signal rather than just a visual change.

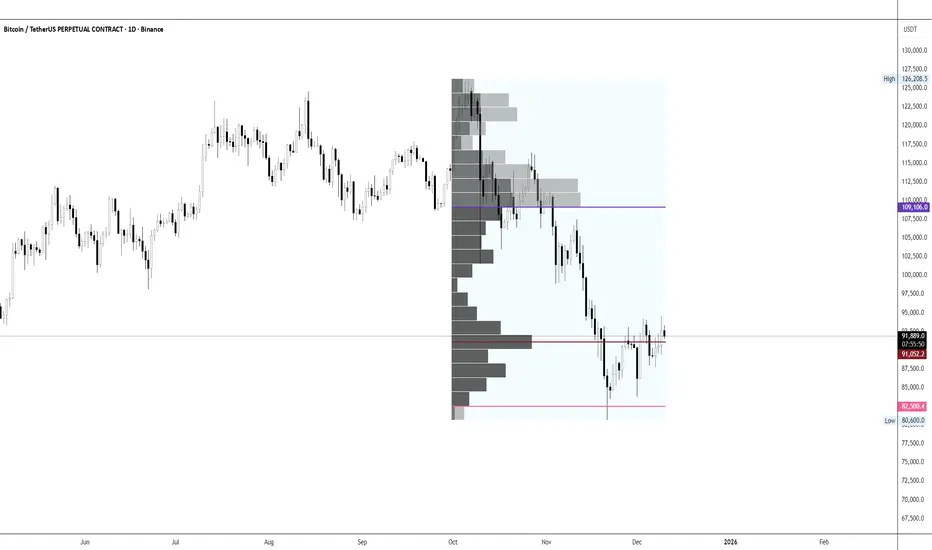
Quarterly BTC Key levels (Q4 BTC)These are key BTC Quarterly levels , invalidation to these levels are good for trading BTC
Novartis Wave Analysis – 10 December 2025- Novartis reversed from strong resistance level 133.35
- Likely to fall to support level 128.00
Novartis recently reversed up from the resistance area between the strong resistance level 133.35 (which has been reversing the price from the start of October) and the upper daily Bollinger Band.
The downward reversal from this resistance zone stopped the previous minor impulse wave i from the end of November.
Given the strength of the resistance level 133.35, Novartis can be expected to fall to the next support level 128.00.

XRPUSDTENTRY:2.0623_2.0422
SL: 2.0072
TP:2.2256
**Please observe capital management. There is no responsibility for your profits or losses.**

USDCHF what a great trade.Trade Entry – USD/CHF
Date: 10/12/25
Time (UK): 08:00
Market Context:
High → Low retracement: Price respected the 78.6% Fibonacci level with a clean wick rejection.
H4 Structure: Presence of a H4 Order Block (OB) aligned with a pin bar rejection, adding confluence for a reversal.
Fundamentals: FOMC scheduled later (high-impact news), so risk management tightened.
Plan / Execution:
Entry Bias: Short (based on 78.6% rejection + H4 OB + pin bar).
Target: 30 pips (quick in-and-out trade due to news risk).
Risk Management: Avoid holding through FOMC; take profit early.
Notes:
Maintain disciplined exit—don’t extend TP because of upcoming volatility.

Solana Sitting in Wholesale Zone: Here’s What the Chart ShowsA **Fibonacci retracement** from ~95 (0 level) to ~296 (1.0 level).
The major levels highlighted:
0.382 ≈ 171.87
0.618 ≈ 219.37
1.0 ≈ 296.25
1.618 ≈ 420.63
Price currently around 135–136
Region coloring:
Wholesale zone** (green, ~95–140)
Equilibrium zone** (yellow/green, ~170–220)
Retail zone** (red, ~296+)
The dotted trendline beneath price suggests long-term support rising over time.
🧠 What This Chart Appears to Communicate (Educational Interpretation)
1. **Price is currently in the “Wholesale” or Discount Zone
Visually, this means:
According to the chart’s structure, this is the lower end of the recent multi-year range.
This part of the chart is often interpreted as the “accumulation” region.
This is NOT advice, just a description of how the chart is labeled.
Equilibrium Levels Above Price (171–220 Zone)
These levels are often seen as:
Areas where previous sellers and buyers met
Places where price consolidates before choosing direction
3. Retail Zone (296+)
This is where:
Prior highs exist
Buyers in that zone historically may have been late
Higher risk of reversal historically in charts marked this way
Again, not advice, just technical labeling.
4. The 1.618 extension (≈420) marks the aggressive upside target
This is a classic Fib extension often referenced in trend-continuation models.
💡 Neutral, Educational “Trade Idea Structure” Based on the Chart
🟩 Scenario A: Range Reversion Toward Equilibrium (Educational)
If price stays above the rising trendline near ~130:
Hypothetical target zones:
First structural zone: **0.382 (~171.87)**
Secondary zone: **0.618 (~219.37)**
Reasoning (educational only):
Price often revisits equilibrium after spending time in deep discount zones.
🟧 Scenario B: Midrange to High-End Rotation (Hypothetical)
If price breaks above ~220 and holds weekly structure:
Targets shown on chart:
1.0 Fib (~296)
1.618 extension (~420)
This represents a trend-continuation idea.
🟥 Scenario C: Breakdown of Wholesale Zone
If the weekly structure fails and price falls below ~95:
Risk zone technically identified:
Price could revisit prior demand zones not shown on this chart.
This is what invalidation could look like from a purely chart-structural perspective.
Observations (No prediction)
Solana's weekly structure has made *higher lows since Oct/Nov*, which can indicate strengthening relative structure.
Price is currently sitting on trendline-like support.
The 171–220 band is a major pivot region visible on the chart.

Buying the Box, Selling at the major levels. Huge Potential. I will buy this and sell 25% at each of the major levels I highlighted. I think this stock has absolutely huge potential based on the chart.

lCID is about to pump like crazy. IM BUYING NOW.Huge fib level on the monthly that I pulled from a sneaky move in the past. Huge levels on the yearly chart (marked) that we will hopefully pump to. This is a retracement play, this stock is trash, but that doesnt mean we wont retrace to test untested levels.

AUDCADUptrend will continue , you can make long order to make profit , the bullish trend has also been confirmed on higher time frames .

PLAY/USDT — Tight Ascending Structure Pressing Into Major ResistHey there!
December 10, 2025
PLAY has been coiling inside a very tight ascending structure, gradually pushing into its main resistance zone.
This type of price action is a classic sign of pressure building before a potential breakout.
The chart is showing one of the strongest bullish setups it has formed in weeks.
🔍 Technical Overview
Current price: ~$0.0336
4EMA: ~$0.0309 → price is consistently holding above it.
Volume has increased during the recent push upward, confirming genuine interest and accumulation near resistance.
📊 Market Structure Breakdown
1. Ascending triangle formation (late November → December)
Price is forming:
Higher lows
Flat resistance around $0.034–0.035
Tight compression inside a rising structure
This pattern generally signals bullish continuation, especially when forming beneath a clear resistance band.
2. First breakout attempts with rejection wicks
PLAY has already tested the resistance zone multiple times:
Each test produced upper wicks
But none resulted in a structural breakdown
Lows continue to rise each time
This means sellers are losing control and buyers are absorbing supply.
3. Price remains above EMAs → momentum still bullish
The short-term trend is clean:
Price riding the EMA
Higher lows maintained
No breakdown from structure
As long as PLAY stays above $0.031–0.032, the bullish thesis remains intact.
🧱 Key Levels
Major Support Zones
$0.031–0.032 → ascending triangle support
4EMA (~$0.031) → dynamic support
A breakdown below these would weaken the bullish setup.
Resistance to Break
$0.034–0.035 → key ceiling
This is the zone PLAY must close above to trigger expansion.
🎯 Breakout Targets
If PLAY breaks above $0.035, the next targets are:
$0.040 → minor liquidity level
$0.050–0.055 → next structural resistance
This is where the chart has historical supply and where liquidity is likely hiding.
The distance between current price and higher levels is large — meaning the breakout could have strong follow-through.
🔮 Outlook
PLAY is in a high-pressure compression against resistance, forming a textbook continuation pattern.
Bullish if:
Price closes above $0.035
Higher lows continue
Volume increases on the breakout
This would open the door to $0.040 and then $0.050+.
Bearish only if:
Price falls below $0.031
Ascending structure breaks
EMAs lose support
Until then, momentum remains clearly bullish.
Have an amazing week!

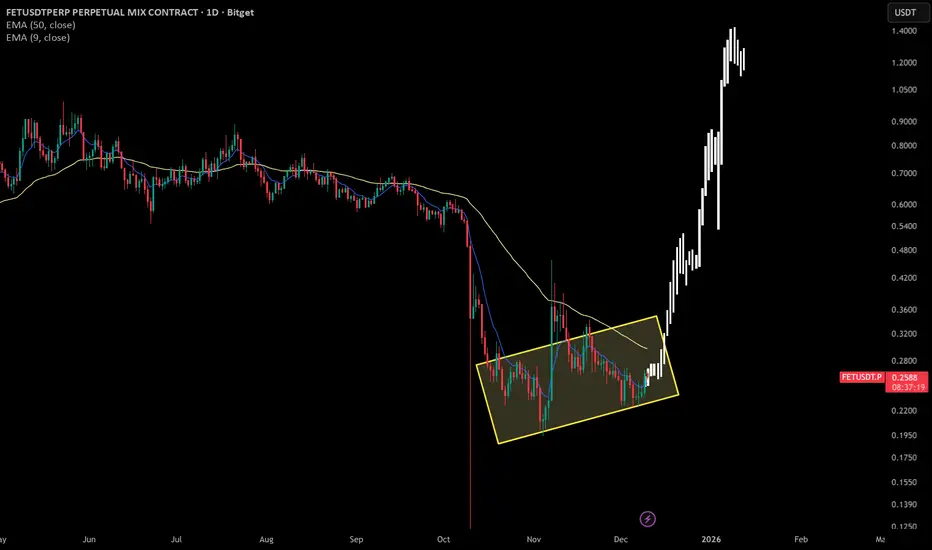
$FET bullish setupey traders,
I’m feeling pumped today and bringing you the second analysis of the day. The last time I talked about NYSE:FET I was wrong and the price dropped sharply. This time, backed by my previous analysis on Ethereum dominance, I believe Fetch could perform quite well over the coming months.
Leaving behind the legal issues with Ocean Protocol, it seems the project is about to regain momentum. It has been forming higher lows over the past few weeks, and I’ve noticed some very interesting on-chain accumulation.
Because of that, I think it may enter a small rally in the next few months:
1st target → $0.50
2nd target → $0.80
3rd target → $1.00
As I always say — stay smart and stay calm!
AUDCAD - Stuck in a Range… Bears Eye the Upper Boundary!📦AUDCAD has been moving inside a clear horizontal range , with price repeatedly rejecting the upper resistance zone highlighted in red. Each time price tapped this area, sellers regained control and pushed it downward.
⚔️Price is now approaching that same resistance once again. As long as this zone holds, we will be looking for sell setups, expecting AUDCAD to reverse back toward the lower bound of the range.
📉The bias remains bearish within this structure unless buyers manage to break and close above the resistance with strength.
Do you think AUDCAD will respect the range again? Share your thoughts below 👇
⚠️ Disclaimer: This is not financial advice. Always do your own research and manage risk properly.
📚 Stick to your trading plan regarding entries, risk, and management.
Good luck! 🍀
All Strategies Are Good; If Managed Properly!
~Richard Nasr

ENA USDT LONG SIGNAL---
📢 Official Trade Signal – ENA/USDT
📈 Position Type: LONG
💰 Entry Price: 0.2559
---
🎯 Take-Profit Targets (Partial Exits):
• TP1: 0.2605
• TP2: 0.2686
• TP3: 0.2744
• TP4: 0.2798
---
🛑 Stop-Loss: 0.2482
📊 Timeframe: 15m
⚖️ Risk/Reward Ratio: ≈ 3.17 (based on TP4)
💥 Suggested Leverage: 5× – 10×
---
🧠 Technical Analysis Summary
ENA/USDT is showing signs of bullish momentum, with price action holding above a critical support zone. The market structure on the 15-minute chart suggests a potential upward shift, supported by increasing buying pressure near the entry level. The take-profit targets are aligned with key resistance zones where liquidity is likely concentrated.
The primary upside targets are sequenced as follows:
0.2605 → 0.2686 → 0.2744 → 0.2798
A confirmed move above TP1 (0.2605) could accelerate bullish momentum toward the higher targets, especially if supported by rising volume.
---
⚙️ Trade Management Rules
✔ Take partial profit at each TP level
✔ Move stop-loss to entry (break-even) once TP1 is reached
✔ Trail stop-loss upward as price advances toward higher targets
✔ No re-entry if stop-loss (0.2482) is triggered
✔ Confirm bullish structure and volume support before entering
---
📌 TradingView Hashtags
#ENAUSDT #ENA #CryptoSignal #LongTrade
#TradingView #FuturesTrading #TechnicalAnalysis
---
Reminder: Use proper risk management. Adjust position size according to your risk tolerance, especially when using leverage.

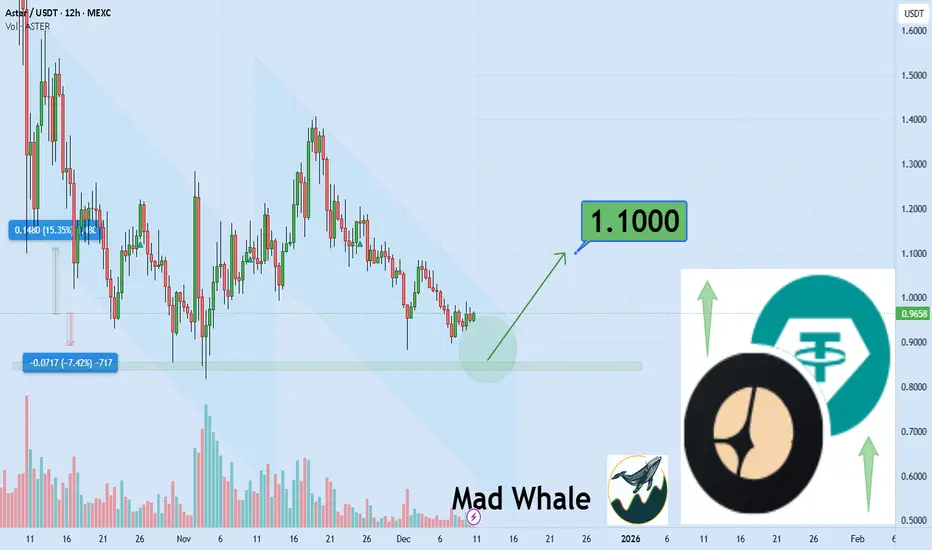
ASTER can touch upper targets 15%gain toward 1.10$Hi the support and resistances on the chart are based on the previous data and weekly candlesticks if BINANCE:ASTERUSDT holds this last support the potential of 15% gain is logical toward 1.10$
HYPE ready for more gain 14% gain toward 33$Hi the support and resistances on the chart are based on the previous data and weekly candlesticks if KUCOIN:HYPEUSDT holds this last support the potential of 14% gain is logical toward 33$

DYDXUSDT 12H#DYDX is moving inside a falling wedge pattern on the 12H timeframe. In case of a breakout above the wedge resistance, the potential upside targets are:
🎯 $0.2254
🎯 $0.2500
🎯 $0.2699
🎯 $0.2897
🎯 $0.3180
🎯 $0.3541
⚠️ Always remember to use a tight stop-loss and maintain proper risk management.

XRP Technical Outlook: Channel Break Could Signal New Highs !!The price is currently moving within a bullish channel and may reach the upper boundary of this channel. If the channel is broken to the upside, we can expect a new all-time high (ATH) for Ripple.

EUR/GBP Bearish Structure Activated After Technical Breakouts!🔥 EUR/GBP "THE CHUNNEL" 📉 BEARISH REVERSAL SETUP | Day/Swing Trade
📊 CURRENT MARKET DATA (Dec 10, 2025)
Live Price: 0.8737
Bias: BEARISH ⬇️
Setup Confirmed: Hull MA Pullback + TMA Breakout ✅
🎯 THE SETUP
📍 ENTRY STRATEGY: "THIEF LAYERING METHOD"
Multiple sell limit orders (layer your entries for optimal positioning):
Layer 1: 0.87600
Layer 2: 0.87500
Layer 3: 0.87400
💡 Thief OG's: Adjust layers based on your risk appetite & account size
🛑 STOP LOSS
Thief SL: 0.87700
⚠️ RISK DISCLAIMER: Dear Ladies & Gentlemen (Thief OG's), this is MY stop loss level based on MY strategy. You MUST adjust your SL according to YOUR OWN risk tolerance and trading plan. Not financial advice.
🎯 TAKE PROFIT TARGET
Primary Target: 0.86950
Technical Confluence:
✅ SuperTrend ATR acting as strong support zone
✅ Oversold conditions building
✅ Trap zone + correlation confirmation
✅ Hull MA trend reversal confirmed
💰 PROFIT MANAGEMENT: Dear Ladies & Gentlemen (Thief OG's), I do NOT recommend blindly following my TP. Scale out, trail stops, and take profits at YOUR discretion. Your money = your rules. Trade at your own risk.
🔗 RELATED PAIRS TO WATCH (Correlation Analysis)
💵 GBP PAIRS (Inverse Correlation)
FX:GBPUSD - Currently: 1.3314 ✅ Watch for GBP weakness confirmation
OANDA:GBPJPY - Currently: 208.53 ✅ Risk sentiment indicator
OANDA:GBPCHF - Negative correlation with EUR/GBP
💶 EUR PAIRS (Direct Correlation)
FX:EURUSD - Currently: 1.1637 ✅ Euro strength barometer
OANDA:EURCHF - Currently: 0.9352 ✅ Safe-haven flow indicator
OANDA:EURJPY - Currently: 182.20 ✅ Risk-on/risk-off confirmation
🔑 KEY CORRELATION INSIGHTS:
If GBP/USD strengthens → EUR/GBP likely drops ✅ (Supports our bearish bias)
If EUR/USD weakens → EUR/GBP likely drops ✅ (Double confirmation)
EUR/CHF movement → Shows Euro capital flows
GBP/JPY above 208 → Risk-on environment (monitor closely)
Watch for: GBP strength OR Euro weakness = EUR/GBP downside acceleration 🚀
📈 TECHNICAL ANALYSIS
Confirmed Signals:
🔵 Hull Moving Average pullback reversal pattern
🔺 Triangular Moving Average breakout (bearish)
📉 Price structure showing rejection at resistance
⚡ SuperTrend ATR support zone below @ 0.86950
Trade Logic:
Price has confirmed bearish reversal with strong technical confluence. Multiple moving average systems aligned for downside momentum. Layered entries allow for optimal risk-reward with reduced exposure at each level.
⚠️ FULL RISK DISCLOSURE
THIEF OG'S - READ THIS:
❌ This is NOT financial advice
❌ I am NOT recommending you copy my SL/TP levels
✅ YOU must manage your own risk
✅ YOU decide when to enter/exit
✅ YOUR capital = YOUR responsibility
✅ Trade what YOU can afford to lose
Risk Management:
Position size according to your account, never risk more than 1-2% per trade, and always have a plan before entering.
🎓 EDUCATION NOTE
The "Thief Layering Strategy" uses multiple limit orders to average into positions with improved entries. This reduces timing risk and provides flexibility for volatile market conditions.
Benefits:
✅ Better average entry price
✅ Reduced emotional decision-making
✅ Risk distributed across levels
✅ Adapts to volatility
📢 Drop a 🚀 if you're watching THE CHUNNEL with me!
📢 Comment your thoughts below - What's your EUR/GBP bias?
💬 Follow for more setups | 👍 Boost if this helps your analysis

Double Top Formed After 88.6% Retracement on AJHere on the Hourly chart, OANDA:AUDJPY has formed a Bearish Reversal Pattern, the Double Top.
Price attempted to make a Higher High but was cut short by the 88.6% Fibonacci level where we now see price dropped back down to the Confirmation or "Neckline" of the Pattern @ 103.836.
Once the Confirmation is broken, this will generate Short Opportunities to take price down to the next Support Level @ 103.344 - 103.198!
