Bullish potential detected for TLCEntry conditions:
(i) higher share price for ASX:TLC along with swing up of indicators such as DMI/RSI.
Depending on risk tolerance, the stop loss for the trade would be:
(i) below the recent swing low of $2.56 of 21st November and yearly VWAP (currently $2.55).
X-indicator

$CDE BUll caseE after pulling back from its 52 weeks high $23.62 took support at 13.60-13.75 which has been a previous SR flip level. This zone is also Fib 0618. RSI almost hit oversold terority and bounced -back. Price made a double bottom at this support levlel and broke the neckline, moving avg 9,21 nd 50 has been reclaimed and curving upwords. RSI now aproaching 60 and MACD gave a buy signal and histogram turned positive. Volume looks decent. Multiple indicators giving buy signal ie. CE, supertrend etc. Price gapped up back to back creating daily FVG and continew to rise from there. Bulls are coming in full force. There is upside gap to be filled 19.21-20.64. Other than that there is not much resistance at all. Good buy at this price. Sector has been showing strength too.

AAPL Outlook — Dec 1 to Dec 5AAPL Outlook — Dec 1 to Dec 5
(Price Action + Multi-Timeframe Story + GEX for Options Traders)
Weekly timeframe
The weekly chart still holds its long-term uptrend, but you can tell momentum is cooling off. The candles are getting smaller as price pushes toward the upper trendline, which usually means buyers are running into an area where profit-taking becomes more attractive. Nothing bearish yet—just a sign that the push is losing steam.
Daily timeframe
The daily view fits that slowdown perfectly. Price is sitting right inside a supply zone that was created during the last big push. Ever since AAPL entered this zone, the market hasn’t shown a strong follow-through candle. Instead, it’s been chopping inside 276–280.
The first little shift in character already appeared, which tells you sellers are at least testing the waters.
The weekly hints “momentum is fading,” and the daily basically confirms, “yes, we’re stuck under some pressure.”
1-Hour timeframe
Dropping into the 1H makes the battle more obvious. Price keeps rejecting the same ceiling near 279–280 again and again. Even though the trendline from below is still supporting the move, the highs are getting slightly lower each attempt. That’s usually the first sign that buyers are defending, but they’re not dominating anymore.
So now all three timeframes are telling the same story:
Uptrend intact → momentum slowing → pressure at the top.
15-Minute timeframe
The 15m chart is where you can really see how tight things have become.
Price is compressing right underneath that ceiling. Volume is tapering off, candles are getting smaller, and every bounce looks weaker than the last.
This kind of behavior usually means the market is coiling up for a move—either a clean breakout above 280 or a release to the downside if the base around 277.50 gives out.
The smaller the timeframe, the more it reveals what the bigger timeframes were already hinting.
Where GEX Fits Into All of This (the real edge)
Now here’s where everything clicks:
All timeframes point to the same resistance near 279–280.
When you overlay the options data, the biggest call wall also sits right there. That’s the level where dealers hedge the most aggressively, which naturally creates resistance—and it just so happens to line up with the zones that the charts have already shown.
Below that, the negative gamma area starts opening up around 276–274.
This means that if price slips under that base, dealers shift into selling hedges, which increases volatility and makes pullbacks move faster.
So the charts show the structure…
GEX shows the “fuel” behind the structure.
That’s why I like combining them: the price action tells the story, and GEX tells you who’s on the other side of the trade.
Trading Bias for the Week (Options + Price Action)
Upside idea
Only valid if 280 breaks clean. If that happens, the next magnet is around 282.5 where the next batch of calls cluster.
Downside idea
If 277.50 cracks, the move usually releases toward 276, then 274.
That lines up with both the lower timeframe CHoCH and the negative gamma pocket.
Final Thoughts
Each timeframe is showing the same thing, just in different levels of detail: the trend is still healthy, but buyers are clearly struggling at the top. GEX reinforces why price behaves that way and gives option traders the roadmap for the week.
Disclaimer:
This is not financial advice. This is just my personal market observation and for educational use only.

THIS IS TESLA'S CHANCE TO RALLY! WILL IT HAPPEN NOW OR IN 2027?New evidence on Tesla stock shows that this is Tesla's final chance to rally for this market cycle of 2022-2026. We discuss whether or not this rally can happen now in the next few months
or if it will be delayed until 2027-2028.

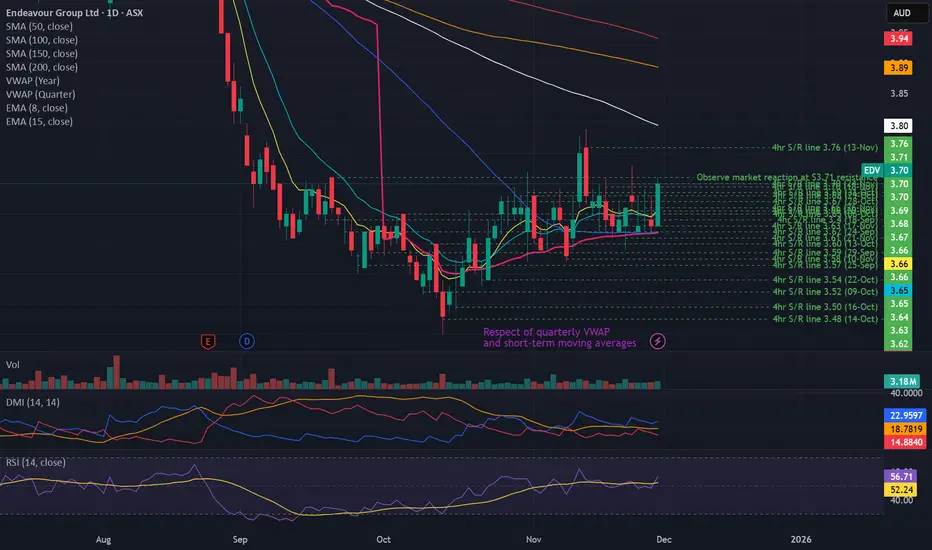
Bullish potential detected for EDVEntry conditions:
(i) higher share price for ASX:EDV along with swing up of indicators such as DMI/RSI, and
(ii) observing market reaction around the $3.71 resistance area.
Depending on risk tolerance, the stop loss for the trade would be:
(i) below the recent swing low of $3.57 of 10th November, or
(ii) below the recent swing low of $3.45 of 14th October.
XAUUSD Next swing trade can be good in buy side if...If the price comes back to retest the demand zone and the trend line is respected recently, then we can plan a swing long trade with good RRR.
Note - Make sure you manage your risk management as every trade has the possibility to fail.

QNT - 2H ( 3⁽¹⁾ WAVE )BINANCE:QNTUSDT
QNT appears to be developing Wave 3 within a larger Wave 1.
With sub-waves i and ii completed, price is now progressing inside sub-wave iii.
The primary projection for sub-wave iii is the 1.618 Fibonacci extension near 117 USDT, with potential extended targets in the 125–130 USDT region.
This wave count will remain the working scenario unless price structure clearly invalidates it..
-Not financial advice.
UPDATE SOON ..

DID THE S&P 500 BOTTOM TODAY? MASSIVE RALLY INCOMING?In this video, we're back in our weekly chart for spy looking at the 21 week SMA to determine with the next move from spy is from here and why we are likely continuing to repeat our 2020 pattern going forward!

SPY RALLIED LAST WEEK AS I EXPECTED! CAN THIS RALLY CONTINUE?S&P 500 just had one of its biggest single week rallies since June 2025 and in this video we need to talk about whether or not this can continue

BBAI BigBear ai Holdings Options Ahead of EarningsIf you haven`t bought BBAI before the massive rally:
Now analyzing the options chain and the chart patterns of BBAI BigBear ai Holdings prior to the earnings report this week,
I would consider purchasing the 3usd strike price Calls with
an expiration date of 2025-12-19,
for a premium of approximately $1.35.
If these options prove to be profitable prior to the earnings release, I would sell at least half of them.

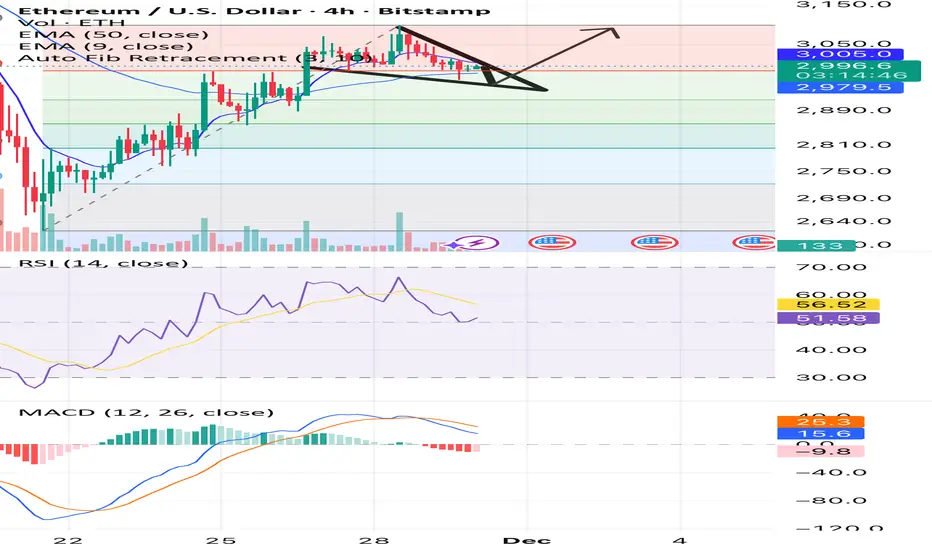
bullish patternetherium in a bullish reversal pattern a down till 2960 with a bullish divergence . entry between 2955/2965 stop loss 2930 tp 3090
QURE uniQure Options Ahead of EarningsAnalyzing the options chain and the chart patterns of QURE uniQure prior to the earnings report this week,
I would consider purchasing the 15usd strike price Calls with
an expiration date of 2026-1-16,
for a premium of approximately $2.32.
If these options prove to be profitable prior to the earnings release, I would sell at least half of them.

bullish momentum solana is in a symtric triangle . entry between 134.8 and 135.3 stop loss 133 tp 144 good luck

U Unity Potential Buyout Soon?!If you missed my previous signal on U (Unity):
Now Unity Technologies (NYSE: U) just caught fire — surging 12.5% in a single day — on a massive uptick in volume that should have every sharp trader watching closely. With $39.1M in volume against a daily average of 9.4M shares, something is clearly brewing beneath the surface.
But this isn’t just about technicals — the options market is lighting up with unusual activity, and there’s fundamental buyout potential that’s getting harder to ignore.
🔍 Options Traders Are Making Bold Bets
Yesterday: Traders loaded up on January 16 $37 strike calls — deep out-of-the-money, high-risk, high-reward plays.
Today: A massive $3.5 million bet was placed on the $30 strike calls, also expiring January 16.
These aren’t casual bets. This is smart money positioning for a potential takeover or major catalyst, and the timeline is clear: January 2025.
📈 Why a Buyout Could Be Back on the Table
Let’s rewind. On August 9, 2022, AppLovin (APP) made an unsolicited offer to acquire Unity in an all-stock deal worth $17.5B, valuing Unity shares at $58.85 — an 18% premium at the time. Unity rejected the deal.
Fast forward to today:
AppLovin's market cap has exploded — now sitting at a jaw-dropping $127B, up 3,800% since late 2022.
Unity, meanwhile, is a shadow of its former self, trading far below its ATH of $201.12 (November 2021), with ongoing struggles in monetization and competition.
But this disparity creates a prime M&A setup:
AppLovin now has the firepower and strategic incentive to revisit the acquisition — with Unity’s depressed valuation, it’s arguably a bargain.
The AI + gaming narrative is red hot. Combining Unity’s engine with AppLovin’s ad and monetization capabilities could be the synergy Wall Street loves.
🎯 The Trade Setup
Unity just broke out with conviction on high volume — this could be the first leg of a larger move.
Options flow suggests bullish sentiment into early 2025.
A renewed takeover offer could easily push the stock back toward the $50–60 zone, if not higher.
🧠 Final Thoughts
Unity is no stranger to volatility, but when volume spikes, options explode, and a cash-rich suitor like AppLovin is thriving, traders should sit up and pay attention.
We may be watching the early stages of a buyout story 2.0 unfold — and Wall Street might be starting to price it in.
📌 Watch Unity (U) closely in the coming weeks. The market may be whispering — or shouting — "Takeover incoming."

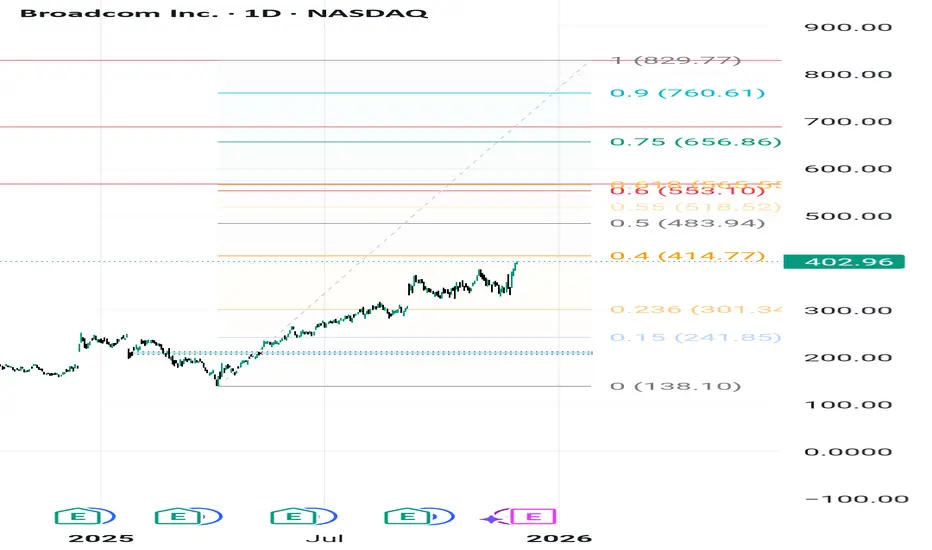
AVGO: Path to $829.77 – Navigating Critical Fibonacci Zones1. Overall Thesis and Price Structure
Broadcom Inc. (AVGO) exhibits a strong underlying bullish trend, fundamentally driven by demand for its AI chips and the successful integration of VMware. The technical objective targets a final high of $829.77. However, the path requires breaking through significant resistance levels defined by the Fibonacci structure. The current price is \mathbf{\$402.96}, maintaining the bullish momentum.
2. Crucial Resistance and Volatility Points
The analysis identifies two critical intermediate targets. The first and most significant hurdle is at $567.10, which aligns closely with the \mathbf{0.618} Fibonacci Golden Ratio. This zone is expected to trigger major volatility, profit-taking, and consolidation. The price action at $567.10 is the key test for trend continuity. Should the price break this level decisively, the next primary resistance target is $688.63, paving the way for the ultimate goal.
3. Key Support and Trend Invalidation
The long-term structural support, or the "Invalidation Point" for the bullish scenario, is the Key Zone at \mathbf{\$206.00}. As long as AVGO trades above this level, the multi-year uptrend remains valid. In the short term, the stock needs to overcome immediate resistance near $414.77 to gather momentum and continue its push towards the intermediate Fibonacci targets.
MRK Merck On the Verge of a Breakout? Unusual Calls !!Merck (MRK) is setting up for what could be a high-probability breakout. The stock has been in a falling wedge pattern for several months — a classic technical formation that often precedes sharp upside moves. Price action has now compressed to the end of the wedge, and we may be on the brink of a bullish resolution.
🔍 Technical Setup
Falling Wedge Pattern nearing completion
Price currently hovering near long-term support ($78.25)
Strong bullish divergence forming on momentum indicators (RSI/MACD)
The falling wedge is typically a reversal pattern, and given how deep MRK has pulled back from its highs ($134+), the risk/reward here looks compelling.
🔥 Options Flow
Today’s options market added fuel to the fire:
48,000 call contracts traded expiring this Friday
This sudden surge in short-dated call buying signals aggressive positioning for an imminent move
This kind of volume is not retail-driven — it points to potential institutional interest
💡 The Bullish Case
With the technical breakout structure in place and strong confirmation from options flow, the case for a bullish reversal is growing. If MRK can close above wedge resistance with volume, it opens the door to a quick move toward $85+, possibly even higher in the coming weeks.
Disclosure: I am part of Trade Nation's Influencer program and receive a monthly fee for using their TradingView charts in my analysis.

Bullish Thesis for INTC Intel Stock in 2025If you haven`t bought INTC before the previous earnings:
Now Intel INTC is positioned for a potential turnaround and upside by the end of 2025, driven by strategic leadership changes, foundry business expansion, AI innovation, and favorable geopolitical dynamics. Here’s why INTC could head higher this year:
1. Leadership Transformation and Strategic Vision
The appointment of Lip-Bu Tan as CEO in March 2025 has injected new optimism into Intel’s prospects. Tan is a respected semiconductor industry veteran, and his arrival was met with a 10% jump in INTC’s share price, reflecting renewed investor confidence in the company’s direction.
2. Foundry Business Expansion and Government Support
Intel’s pivot toward a foundry-centric model is gaining momentum. The company is leveraging its U.S.-based manufacturing footprint to attract domestic and international clients, especially as geopolitical tensions and trade restrictions make U.S. chip production more attractive.
There is speculation about strategic partnerships, such as TSMC potentially acquiring a stake in Intel’s foundry operations, which could accelerate technology transfers and client wins.
The U.S. government is likely to continue supporting domestic semiconductor manufacturing through incentives and tariffs, directly benefiting Intel’s foundry ambitions.
3. AI and Next-Gen Product Launches
Intel is aggressively targeting the AI and data center markets. The upcoming Jaguar Shores and Panther Lake CPUs, built on the advanced 18A process node, are set for release in the second half of 2025. These chips will be available not only for Intel’s own products but also for external clients like Amazon and Microsoft, expanding the addressable market.
Intel’s renewed focus on AI accelerators and competitive cost structures could help it regain share in high-growth segments.
4. Financial Resilience and Market Position
Despite recent setbacks, Intel remains a dominant player in the PC CPU market and continues to generate substantial revenue, outpacing some key competitors in the latest quarter.
Analysts have revised their short-term price targets upward, with some projecting INTC could reach as high as $62—a potential upside of over 170% from current levels.
Forecasts for 2025 suggest an average price target in the $40–$45 range, with bullish scenarios pointing even higher if execution on foundry and AI strategies meets expectations.
5. Technical and Sentiment Factors
While technical analysis currently signals caution, the $18.50–$20 zone has provided strong support, and any positive news on foundry contracts or AI wins could catalyze a breakout from current consolidation patterns.
Market sentiment has shifted more positively following the CEO change and strategic announcements, suggesting the potential for a sustained rebound if Intel delivers on its promises.
In conclusion:
Intel’s combination of visionary leadership, foundry expansion, AI innovation, and favorable geopolitical trends sets the stage for a potential stock price recovery by the end of 2025. With analyst targets and investor sentiment turning more bullish, INTC presents a compelling case for upside as it executes its turnaround strategy
Disclosure: I am part of Trade Nation's Influencer program and receive a monthly fee for using their TradingView charts in my analysis.

AAOI Applied Optoelectronics potential rally by EOYApplied Optoelectronics AAOI is well-positioned for a strong rally toward $24 per share by the end of 2025, supported by multiple operational and strategic catalysts. A key recent development—the warrant agreement with Amazon—adds a powerful endorsement and financial backing that enhances the bullish case.
1. Amazon’s Strategic Warrant Agreement: A Major Vote of Confidence
On March 13, 2025, AAOI issued a warrant to Amazon.com NV Investment Holdings LLC, granting Amazon the right to purchase up to approximately 7.95 million shares at an exercise price of $23.70 per share.
About 1.3 million shares vested immediately, with the remainder vesting based on Amazon’s discretionary purchases, potentially up to $4 billion in total purchases over time.
This agreement signals Amazon’s strong confidence in AAOI’s technology and its critical role as a supplier of high-speed optical transceivers for Amazon Web Services and AI data center infrastructure.
The warrant price near $24 effectively sets a floor and a valuation benchmark, supporting the thesis that AAOI’s stock could reach or exceed this level by year-end.
2. Major Data Center Wins and Hyperscale Customer Re-Engagement
AAOI recently resumed shipments to a major hyperscale customer, with volume shipments of high-speed data center transceivers expected to ramp significantly in the second half of 2025.
This re-engagement with a key customer aligns with the surging demand for AI-driven data center infrastructure, providing a strong revenue growth catalyst.
3. Robust Revenue Growth and Margin Expansion
Q1 2025 revenue doubled year-over-year to nearly $100 million, with gross margins expanding to over 30%, reflecting operational efficiencies and favorable product mix.
The company expects to sustain strong quarterly revenue ($100–$110 million) and ramp production capacity to over 100,000 units of 800G transceivers per month by year-end, with 40% manufactured in the U.S.
4. Manufacturing Expansion and Supply Chain Resilience
AAOI is scaling manufacturing in the U.S. and Taiwan, enhancing supply chain robustness and positioning itself to benefit from potential government incentives for domestic production.
Its automated, largely in-house manufacturing capabilities provide a competitive edge in meeting hyperscale and AI data center demand.
In conclusion:
Amazon’s warrant agreement at a $23.70 strike price not only provides a direct valuation anchor near $24 but also serves as a powerful strategic endorsement of AAOI’s technology and growth prospects. Combined with robust revenue growth, expanding manufacturing capacity, and key customer re-engagement, AAOI has a compelling case to reach or exceed $24 per share by the end of 2025.

AAPL Poised for Continued GrowthIf you haven`t bought AAPL before the rally:
What to consider now:
1. AI-Driven iPhone Upgrade CycleApple’s integration of Apple Intelligence, its proprietary AI platform, is set to catalyze a significant iPhone replacement cycle. Posts on X highlight positive sentiment around AI-driven demand, with estimates suggesting a 40% year-over-year surge in iPhone shipments in China during May 2024, signaling strong consumer interest. New AI features, such as on-device processing for enhanced privacy and functionality, are expected to drive accelerated hardware upgrades. Analysts, including Bernstein, project these features could boost upgrade rates, with even a 1% increase in upgrades driving meaningful revenue growth. With the iPhone 15 and future iterations leveraging AI, Apple is likely to capture pent-up demand, as noted by industry observers who see long-term revenue growth from its 7% year-over-year increase in active installed base.
2. Strong Ecosystem and Services GrowthApple’s ecosystem—spanning iPhones, iPads, Macs, and wearables—continues to drive customer loyalty and recurring revenue. The company reported record services growth in Q2 2025, with revenue reaching $95.4 billion, up 5% year-over-year. Services like Apple Music, iCloud, and Apple TV+ benefit from the growing active device base, which ensures sticky, high-margin revenue streams. This ecosystem strength mitigates concerns about short-term iPhone sales fluctuations, as Apple captures upgrade revenue over time. The seamless integration of hardware and services creates a moat that competitors struggle to replicate, reinforcing AAPL’s long-term growth potential.
3. Technical Bullish MomentumFrom a technical perspective, AAPL exhibits strong bullish patterns across multiple timeframes. TradingView analyses point to a rising bullish channel, with higher highs and higher lows signaling sustained upward momentum. Key bullish patterns, such as an ascending wedge and triangle, are forming around current price levels, suggesting potential breakouts. For instance, if AAPL clears $203.21 with volume, it could target $204.98 or higher, with some analyses eyeing $240 as a near-term resistance. Technical indicators like a rising RSI and MACD convergence further support short-term bullish momentum. Despite recent consolidation, reduced volatility and a strong setup pattern indicate AAPL is primed for a breakout.
4. Analyst Optimism and Market SentimentAnalyst sentiment remains overwhelmingly positive, with a consensus “Buy” rating and a 12-month price target of $228.85, implying a 14.05% upside from the current price of $200.66 as of June 2025. Hedge funds like Third Point see “significant” upside, driven by AI features that could meaningfully boost earnings. Bernstein’s raised price target to $240 reflects confidence in Apple’s ability to monetize AI through hardware and services. Posts on X also highlight investor optimism, with AAPL’s $350 billion market cap increase in a single day underscoring strong market confidence in its AI-driven growth chapter.
5. Global Expansion and Emerging MarketsApple’s growth in emerging markets, particularly India and China, bolsters its bullish case. Improved guidance for December 2023, driven by iPhone 15 adoption and India’s market potential, signals untapped opportunities. Apple’s ability to penetrate these high-growth regions, combined with its premium brand appeal, positions it to capture a larger share of global smartphone and tech markets.
Disclosure: I am part of Trade Nation's Influencer program and receive a monthly fee for using their TradingView charts in my analysis.

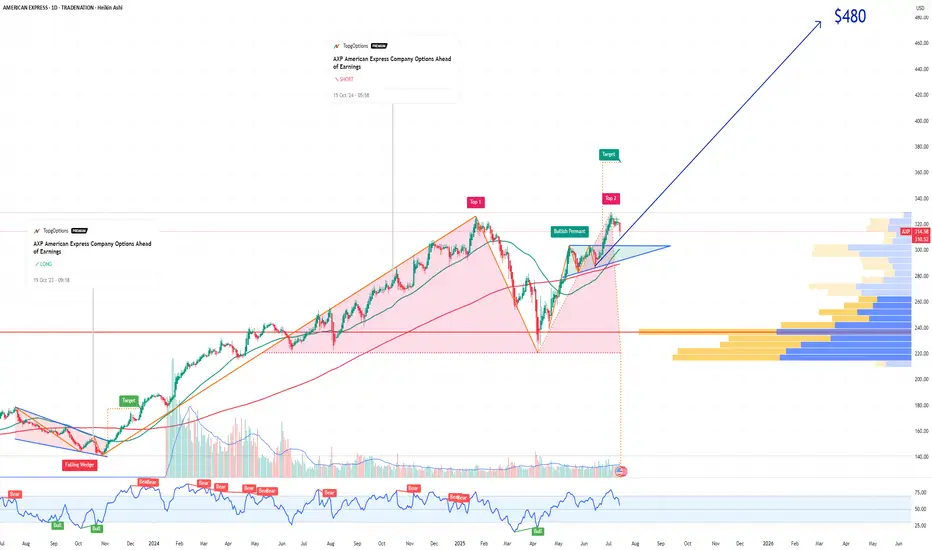
AXP American Express Company Options Ahead of EarningsIf you haven`t bought AXP before the rally:
Now analyzing the options chain and the chart patterns of AXP American Express Company prior to the earnings report this week,
I would consider purchasing the 480usd strike price Calls with
an expiration date of 2027-1-15,
for a premium of approximately $6.25.
If these options prove to be profitable prior to the earnings release, I would sell at least half of them.
Disclosure: I am part of Trade Nation's Influencer program and receive a monthly fee for using their TradingView charts in my analysis.
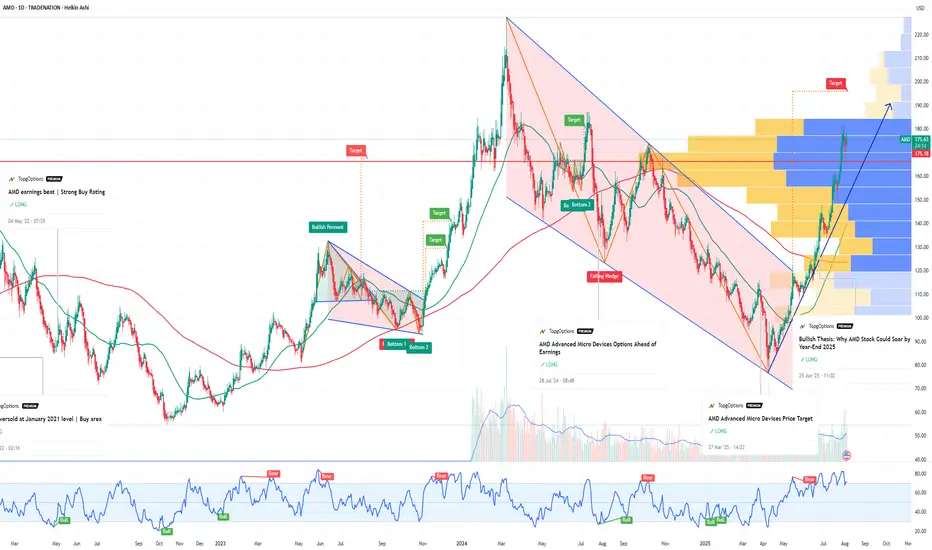
AMD Advanced Micro Devices Options Ahead of EarningsIf you haven`t bought AMD before the previous earnings:
Now analyzing the options chain and the chart patterns of AMD Advanced Micro Devices prior to the earnings report this week,
I would consider purchasing the 220usd strike price Calls with
an expiration date of 2026-9-18,
for a premium of approximately $22.15.
If these options prove to be profitable prior to the earnings release, I would sell at least half of them.
Disclosure: I am part of Trade Nation's Influencer program and receive a monthly fee for using their TradingView charts in my analysis.
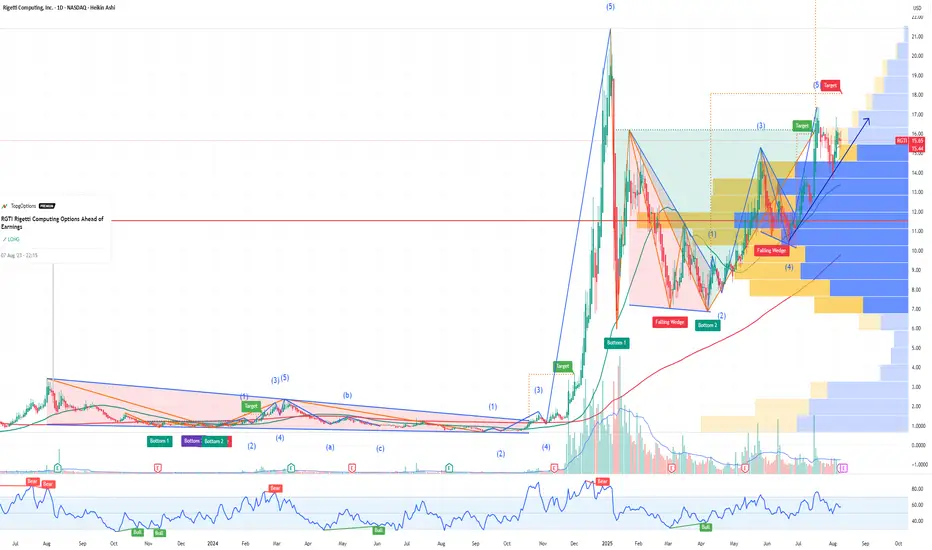
RGTI Rigetti Computing Options Ahead of EarningsIf you haven`t bought RGTI before the rally:
Now analyzing the options chain and the chart patterns of RGTI Rigetti Computing prior to the earnings report this week,
I would consider purchasing the 15usd strike price Calls with
an expiration date of 2027-1-15,
for a premium of approximately $6.20.
If these options prove to be profitable prior to the earnings release, I would sell at least half of them.
Stock Market Forecast | BTC TSLA NVDA AAPL AMZN META MSFTStock Market Forecast | CRYPTOCAP:BTC SP:SPX NASDAQ:NDX NASDAQ:QQQ
Mag 7 | TSLA NVDA AAPL AMZN META MSFT GOOGL
