#XAI/USDT — Descending Triangle: Ready for Takeoff or Breakdow#XAI
The price is moving in a descending channel on the 1-hour timeframe. It has reached the lower boundary and is heading towards breaking above it, with a retest of the upper boundary expected.
We have a downtrend on the RSI indicator, which has reached near the lower boundary, and an upward rebound is expected.
There is a key support zone in green at 0.01485. The price has bounced from this level multiple times and is expected to bounce again.
We have a trend towards consolidation above the 100-period moving average, as we are moving close to it, which supports the upward movement.
Entry price: 0.01550
First target: 0.01578
Second target: 0.01607
Third target: 0.01655
Don't forget a simple principle: money management.
Place your stop-loss below the support zone in green.
For any questions, please leave a comment.
Thank you.
XAI

#XAI/USDT — Descending Triangle: Ready for Takeoff or Breakdow#XAI
The price is moving in a descending channel on the 1-hour timeframe. It has reached the lower boundary and is heading towards a breakout, with a retest of the upper boundary expected.
We are seeing a bearish bias in the Relative Strength Index (RSI), which has reached near the lower boundary, and an upward bounce is expected.
There is a key support zone in green at 0.0162, and the price has bounced from this level several times. Another bounce is expected.
We are seeing a trend towards stabilizing above the 100-period moving average, which we are approaching, supporting the upward trend.
Entry Price: 0.0169
First Target: 0.0174
Second Target: 0.0180
Third Target: 0.0187
Remember a simple principle: Money Management.
Place your stop-loss order below the green support zone.
For any questions, please leave a comment.
Thank you.
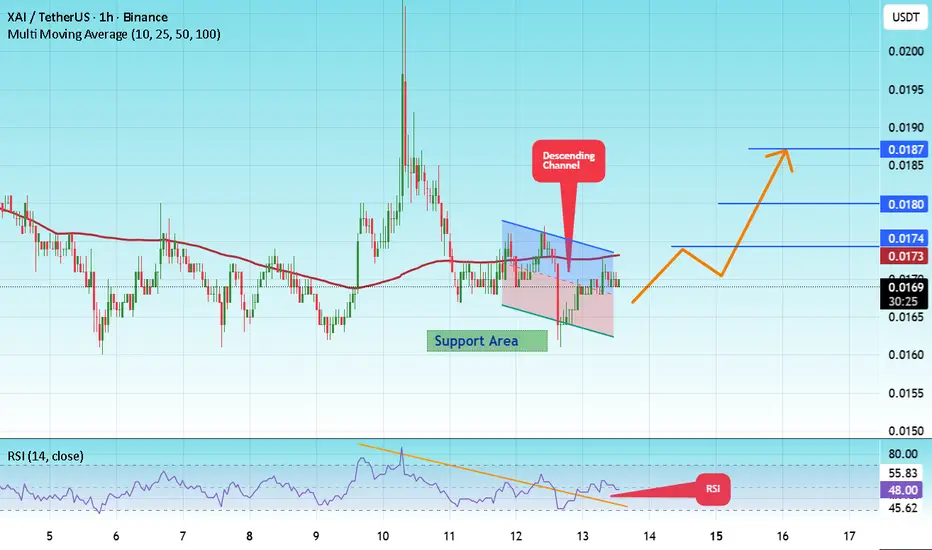
#XAI/USDT — Descending Triangle: Ready for Takeoff or Breakdow#XAI
The price is moving in a descending channel on the 1-hour timeframe. It has reached the lower boundary and is heading towards a breakout, with a retest of the upper boundary expected.
We are seeing a bearish bias in the Relative Strength Index (RSI), which has reached near the lower boundary, and an upward bounce is expected.
There is a key support zone in green at 0.0167. The price has bounced from this level several times and is expected to bounce again.
We are seeing a trend towards stabilizing above the 100-period moving average, which we are approaching, supporting the upward trend.
Entry Price: 0.0172
First Target: 0.0180
Second Target: 0.0185
Third Target: 0.0191
Remember a simple principle: Money Management.
Place your stop-loss order below the green support zone.
For any questions, please leave a comment.
Thank you.

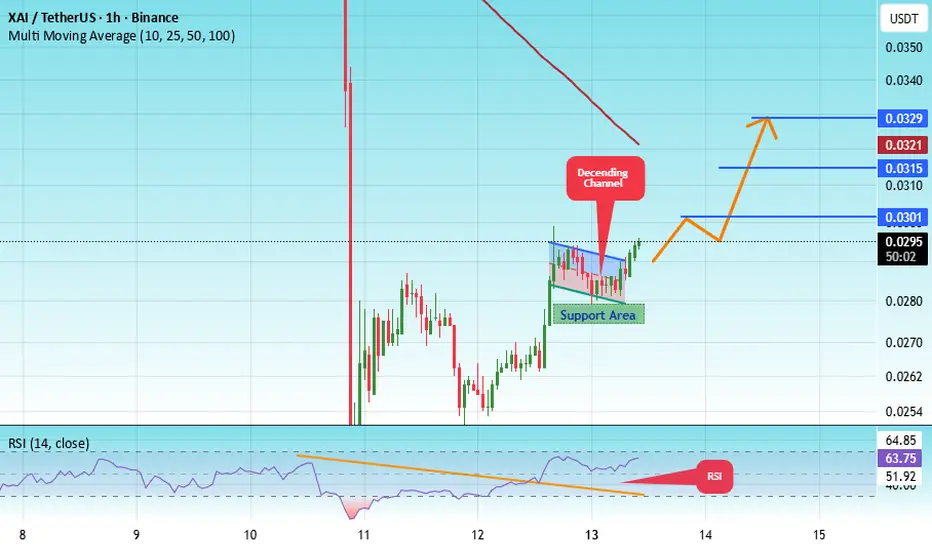
#XAI/USDT — Descending Triangle: Ready for Takeoff or Breakdow#XAI
The price is moving within an ascending channel on the 1-hour timeframe and is adhering to it well. It is poised to break out strongly and retest the channel.
We have a downtrend line on the RSI indicator that is about to break and retest, which supports the upward move.
There is a key support zone in green at the price of 0.0198, representing a strong support point.
We have a trend of consolidation above the 100-period moving average.
Entry price: 0.0206
First target: 0.0209
Second target: 0.0223
Third target: 0.0240
Don't forget a simple money management rule:
Place your stop-loss order below the support zone in green.
Once you reach the first target, save some money and then change your stop-loss order to an entry order.
For any questions, please leave a comment.
Thank you.

#XAI/USDT — Descending Triangle: Ready for Takeoff or Breakdow#XAI
The price is moving in a descending channel on the 1-hour timeframe and is expected to break out and continue upwards.
We have a trend to stabilize above the 100-period moving average again.
We have a downtrend on the RSI indicator, which supports an upward move if it breaks above it.
We have a key support zone in green that pushed the price higher at 0.0186.
Entry price: 0.0196
First target: 0.0202
Second target: 0.0214
Third target: 0.0230
For risk management, don't forget your stop-loss and money management.
The stop-loss is below the support zone in green.
Upon reaching the first target, take some profit and then change your stop-loss order to an entry order.
For any questions, please comment.
Thank you.

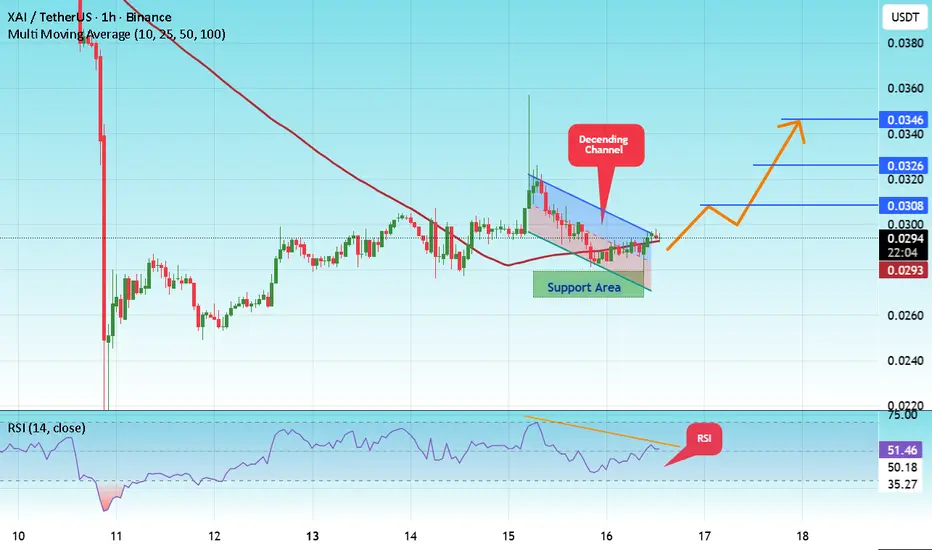
#XAI/USDT — Descending Triangle: Ready for Takeoff or Breakdow#XAI
The price is moving in a descending channel on the 1-hour frame and is expected to break and continue upward.
We have a trend to stabilize above the 100 moving average once again.
We have a downtrend on the RSI indicator that supports the upward move with a breakout.
We have a major support area in green that pushed the price higher at 0.0274.
Entry price: 0.0292.
First target: 0.0308.
Second target: 0.0326.
Third target: 0.0346.
To manage risk, don't forget stop loss and capital management.
When you reach the first target, save some profits and then change the stop order to an entry order.
For inquiries, please comment.
Thank you.
#XAI/USDT — Falling Wedge Formation, Breakout or Breakdown?#XAI
The price is moving within an ascending channel on the 1-hour timeframe and is adhering to it well. It is poised to break out strongly and retest the channel.
We have a downtrend line on the RSI indicator that is about to break and retest, which supports the upward move.
There is a key support zone in green at the price of 0.0243, representing a strong support point.
We have a trend of consolidation above the 100-period moving average.
Entry price: 0.0247
First target: 0.0254
Second target: 0.0261
Third target: 0.0268
Don't forget a simple point: capital management.
Upon reaching the first target, save some money and then change your stop-loss order to an entry order.
For any questions, please leave a comment.
Thank you.

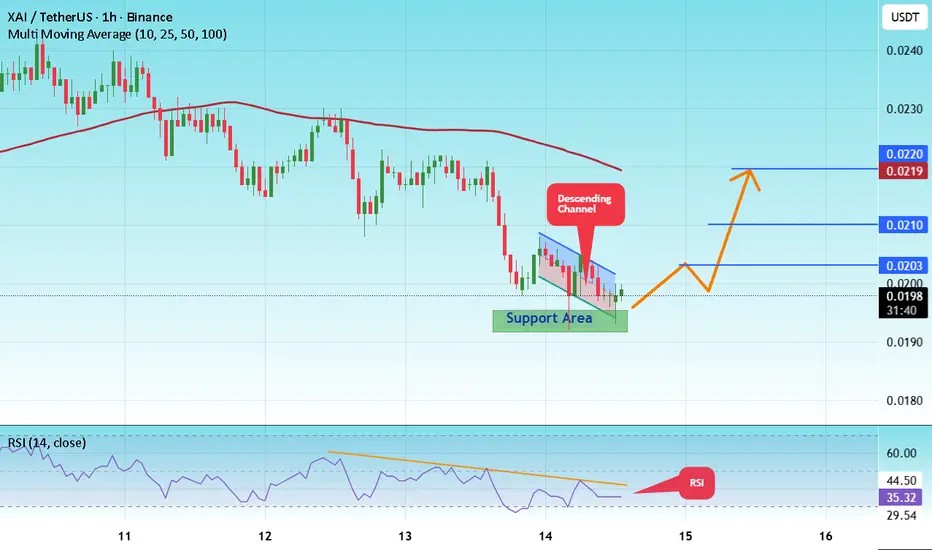
#XAI/USDT — Descending Triangle: Ready for Takeoff or Breakdow#XAI
The price is moving in a descending channel on the 1-hour timeframe and is expected to break out and continue upwards.
We have a trend to stabilize above the 100-period moving average again.
We have a downtrend on the RSI indicator, which supports an upward move if it breaks above it.
We have a key support zone in green that pushed the price higher at 0.0193.
Entry price: 0.0198
First target: 0.0203
Second target: 0.0210
Third target: 0.0220
For risk management, don't forget your stop-loss and capital management.
The stop-loss is below the support zone in green.
Upon reaching the first target, take some profit and then change your stop-loss order to an entry order.
For any questions, please comment.
Thank you.
#XAI/USDT — Falling Wedge Formation, Breakout or Breakdown?#XAI
The price is moving within a descending channel on the 1-hour frame, adhering well to it, and is heading for a strong breakout and retest.
We have a bearish trend on the RSI indicator that is about to be broken and retested, which supports the upward breakout.
There is a major support area in green at 0.0277, representing a strong support point.
We are heading for consolidation above the 100 moving average.
Entry price: 0.0294
First target: 0.0301
Second target: 0.0315
Third target: 0.0329
Don't forget a simple matter: capital management.
When you reach the first target, save some money and then change your stop-loss order to an entry order.
For inquiries, please leave a comment.
Thank you.
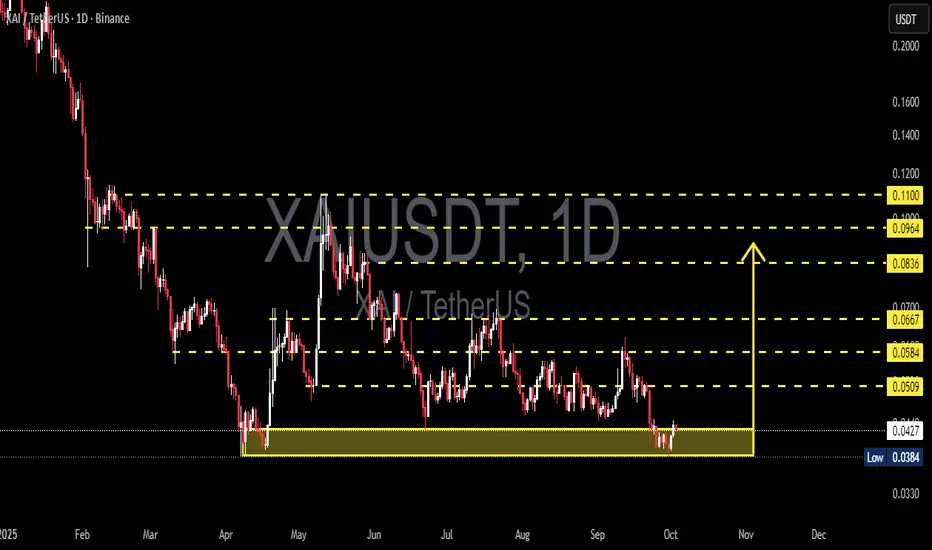
XAI/USDT (1D) — Critical Decision Zone at 0.038–0.043🔎 Overview
The daily chart of XAI/USDT shows a prolonged downtrend structure that has now reached a critical accumulation zone (0.0384–0.0428). This zone has acted as a strong support multiple times, creating a make-or-break situation:
1. If the zone holds → potential for a significant rebound toward higher resistance levels.
2. If the zone breaks down → bearish continuation with deeper downside targets.
---
📌 Key Technical Levels
Main Support (Accumulation Zone): 0.0384 – 0.0428
Resistance levels:
R1: 0.0509
R2: 0.0584
R3: 0.0667
R4: 0.0836
R5: 0.0964
R6: 0.1100
Current Price: ~0.0428
---
📈 Price Structure & Pattern
Long-term downtrend: Lower highs and lower lows clearly dominate since the beginning of the year.
Range support: The yellow highlighted zone has repeatedly acted as a strong defense area for buyers.
Potential Double Bottom: A bullish reversal pattern may form if price rejects this zone and breaks above key resistances.
Bearish risk: A breakdown below 0.0384 would invalidate the bullish setup and resume the primary downtrend.
---
🚀 Bullish Scenario
Confirmation: Daily close above 0.0509 with momentum.
Short-term target: 0.0584
Medium-term targets: 0.0667 – 0.0836
Extended targets (if momentum is strong): 0.0964 – 0.1100
✨ Bullish Narrative:
If buyers successfully defend this accumulation zone, XAI could be at the early stage of a major reversal. The first key breakout at 0.0509 will be crucial to validate a new upward trend.
---
⚠️ Bearish Scenario
Confirmation: Daily close below 0.0384
Initial target: 0.026 (measured move projection)
Extended target: 0.020 (psychological level)
🔥 Bearish Narrative:
A breakdown below the support zone signals buyer exhaustion, opening the door for sellers to extend the long-term downtrend and push price toward lower psychological levels.
---
📊 Strategy & Risk Management
Swing traders (conservative): Wait for confirmation above 0.0509 or below 0.0384 before committing to a larger position.
Aggressive entry: Consider buying within 0.0420–0.0400 with a tight stop below 0.038.
Conservative entry: Enter only after a confirmed breakout above 0.0509, ideally on a retest.
Golden rule: Risk management is essential. The potential reward is attractive, but so is the risk at this decision point.
---
📌 Conclusion
XAI/USDT is standing at a major crossroads:
Bullish case: If 0.038–0.043 holds → potential rebound toward 0.0509, 0.0584, and 0.0667+.
Bearish case: If 0.0384 breaks → downside extension with 0.026 as the next realistic target.
At the moment, the 0.038–0.043 range is the key decision zone. Traders should wait for clear confirmation while staying disciplined with risk management.
---
#XAI #XAIUSDT #CryptoAnalysis #SupportResistance #BullishScenario #BearishScenario #CryptoTrading #AltcoinAnalysis #TechnicalAnalysis
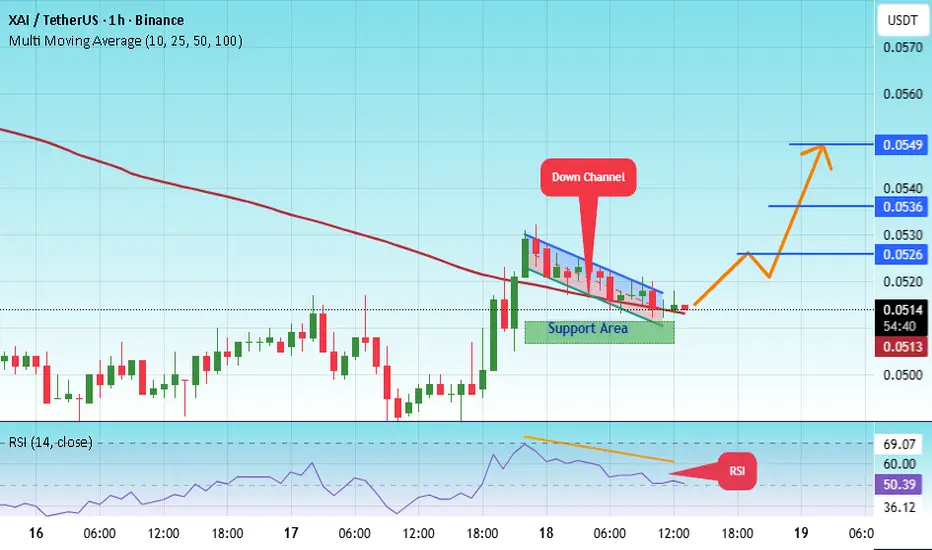
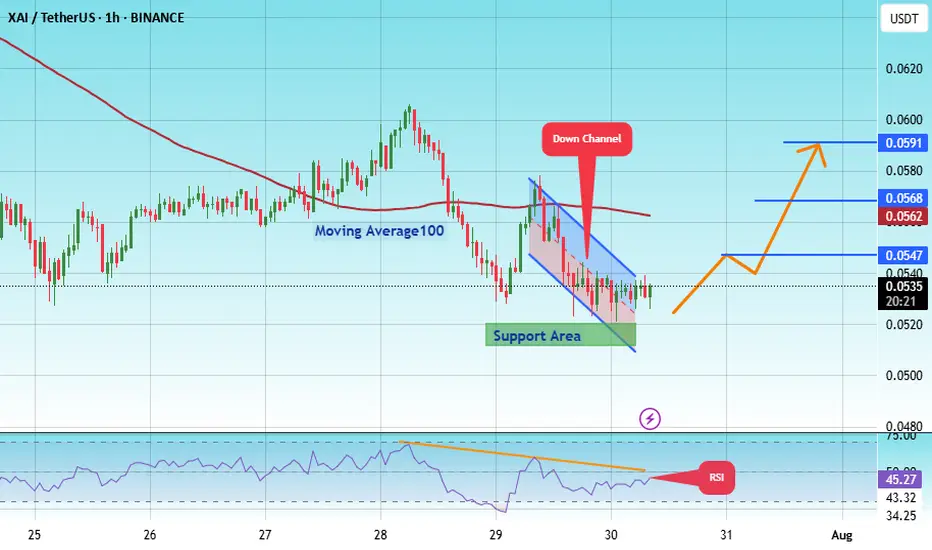
#XAI/USDT — Accumulation at Key Zone & Potential Reversal?#XAI
The price is moving within a descending channel on the 1-hour frame, adhering well to it, and is heading for a strong breakout and retest.
We have a bearish trend on the RSI indicator that is about to be broken and retested, which supports the upward breakout.
There is a major support area in green at 0.0500, representing a strong support point.
We are heading for consolidation above the 100 moving average.
Entry price: 0.0516
First target: 0.0526
Second target: 0.0536
Third target: 0.0550
Don't forget a simple matter: capital management.
When you reach the first target, save some money and then change your stop-loss order to an entry order.
For inquiries, please leave a comment.
Thank you.
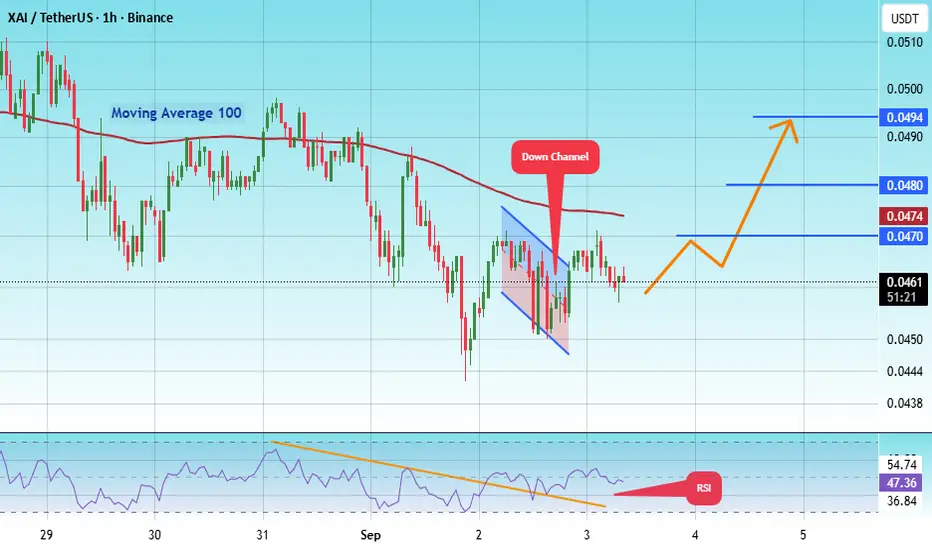
#XAI/USDT — Accumulation at Key Zone & Potential Reversal?#XAI
The price is moving within a descending channel on the 1-hour frame, adhering well to it, and is heading for a strong breakout and retest.
We have a bearish trend on the RSI indicator that is about to be broken and retested, which supports the upward breakout.
There is a major support area in green at 0.0451, which represents a strong support point.
For inquiries, please leave a comment.
We are in a consolidation trend above the 100 moving average.
Entry price: 0.0462
First target: 0.0470
Second target: 0.0480
Third target: 0.0494
Don't forget a simple matter: capital management.
When you reach the first target, save some money and then change your stop-loss order to an entry order.
For inquiries, please leave a comment.
Thank you.
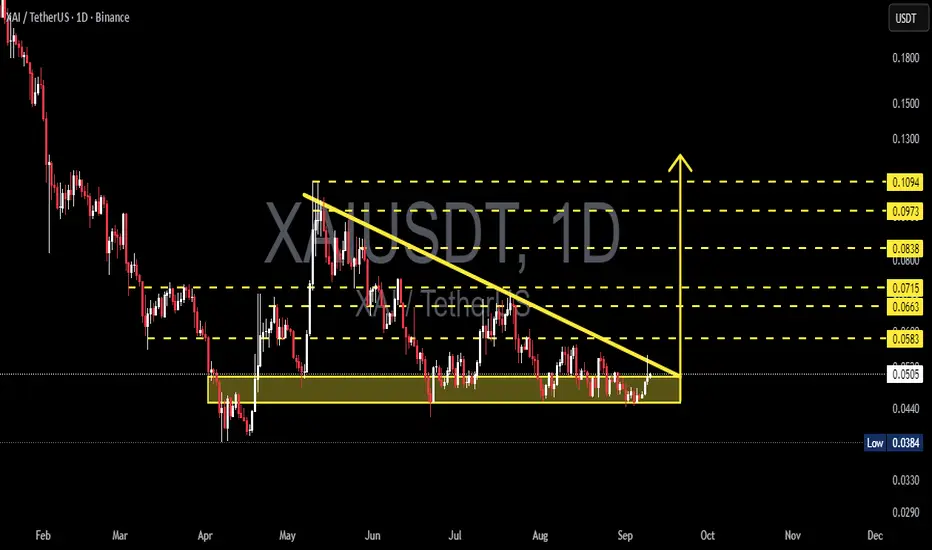
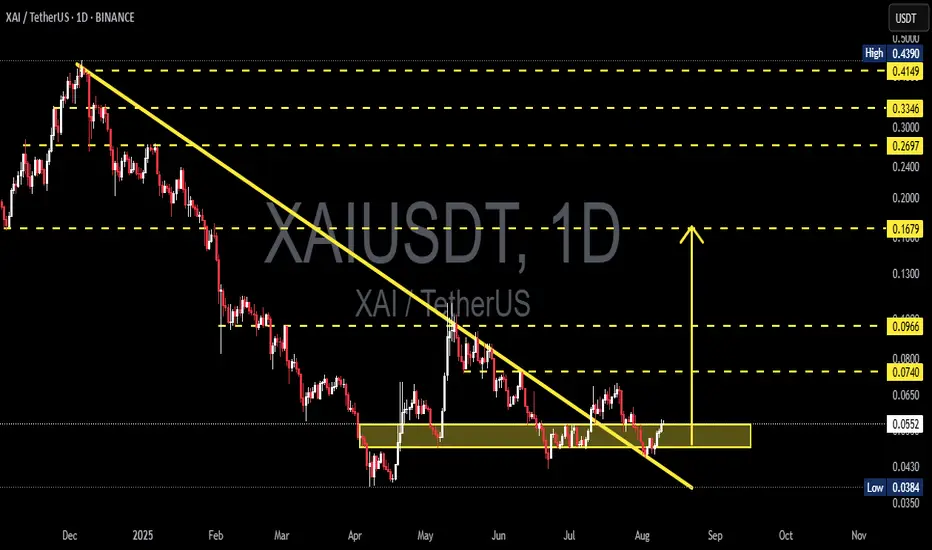
XAI/USDT — Descending Triangle: Ready for Takeoff or Breakdown?✨ Quick Summary:
The XAI/USDT chart is now at a critical decision point. For months, price has been consolidating inside the accumulation zone (0.0384 – 0.050), while being consistently pressured by a descending trendline from above. This structure forms a descending triangle, a pattern that often signals bearish continuation, but can also act as a powerful reversal base if a breakout occurs with strong volume.
Currently, price trades around 0.0504, right at the crossroads of major support and the seller’s pressure line. This means an explosive move — either a breakout or breakdown — is likely coming soon.
---
🔎 Chart Pattern & Price Structure
Support Zone (yellow box): 0.0384 – 0.050 → tested multiple times since April 2025, showing strong buyer defense.
Descending Trendline Resistance (yellow line): connecting lower highs since May, pressing price downward.
Pattern: Classic Descending Triangle → market is coiling tighter, awaiting a catalyst.
Market Psychology:
Buyers keep defending the same support.
Sellers consistently lower their asking prices.
This tug-of-war is reaching its breaking point.
---
🚀 Bullish Scenario (Breakout)
Key confirmation:
Daily close above the descending trendline.
Breakout and daily close above 0.0583 with significant volume.
Potential upside targets (layered resistances):
🎯 Target 1: 0.0583 (+15%)
🎯 Target 2: 0.0663 (+31%)
🎯 Target 3: 0.0715 (+42%)
🎯 Target 4: 0.0838 (+66%)
🎯 Target 5: 0.0973 (+93%)
🎯 Ambitious Target: 0.1094 (+117%)
Trading notes:
Strong breakouts often come with at least 2x average daily volume. The ideal setup is breakout → retest (turning resistance into support) → continuation. Conservative entries can wait for the retest confirmation above 0.0583.
---
⚠️ Bearish Scenario (Breakdown)
Key confirmation: daily close below 0.0384 with a full-bodied candle and high volume.
Downside risk:
Retest of the psychological support zone 0.033 – 0.030.
Breakdown here would likely extend the broader bearish trend, potentially setting new lows.
Trading notes:
A breakdown with volume often triggers panic selling. In this case, stop-losses for longs become crucial. Aggressive traders may consider shorts after a failed retest of broken support.
---
🔑 Extra Confirmation Factors
1. Volume: No volume = no trust in breakout/breakdown.
2. RSI / Momentum: Bullish divergence supports a breakout, bearish divergence confirms breakdown.
3. Market Sentiment: If BTC/ETH trend bullish, XAI’s breakout chances improve. A weak crypto market favors breakdown.
4. Fundamental Catalysts: Partnerships, project updates, or listings can flip the technical outlook.
---
📌 Conclusion
XAI/USDT is facing a make-or-break moment:
Bullish breakout could open a +40% to +100% rally.
Bearish breakdown could drag price back to the 0.030–0.033 zone.
For traders: this is the time to wait for confirmation. Entering too early in such a setup carries high risk. The best positions often come after the market chooses its direction.
---
#XAI #XAIUSDT #CryptoAnalysis #TechnicalAnalysis #DescendingTriangle #Altcoin #Breakout #SupportResistance #CryptoTrading
XAIUSDT Forming Bullish PennantXAIUSDT is showing strong bullish potential as it forms a classic bullish pennant pattern on the charts. This pattern usually emerges after a significant upward move, followed by a period of consolidation within converging trendlines. With a solid breakout expected, the technical setup suggests the possibility of a sharp continuation rally, aligning with an anticipated gain of 70% to 80%.
The good trading volume accompanying this formation strengthens the bullish outlook, as higher volume during consolidation often signals accumulation by smart money. A pennant breakout backed by strong volume typically leads to sustained momentum, allowing the pair to push toward higher resistance levels with confidence.
Investor interest in XAIUSDT has been increasing, reflecting growing demand and market participation in this project. The alignment of technical indicators and market sentiment makes this setup particularly appealing for traders and investors looking to capture high-percentage gains in the near term.
With bullish momentum building and a solid technical base, XAIUSDT appears ready to extend its rally once the breakout is confirmed. If the current trend continues, the projected 70% to 80% upside move could materialize, offering substantial opportunities for market participants.
✅ Show your support by hitting the like button and
✅ Leaving a comment below! (What is You opinion about this Coin)
Your feedback and engagement keep me inspired to share more insightful market analysis with you!

XAI/USDT — Accumulation at Key Zone & Potential Reversal?Summary
The daily chart shows XAI in a consolidation/accumulation phase within a key support zone (yellow box) after a prolonged downtrend. The long-term descending trendline (yellow) has recently been broken, signaling early signs that the downtrend may be losing momentum. However, confirmation is still needed (daily close and volume validation).
Key Levels (from the chart)
Major resistances: 0.0740, then 0.0966, 0.1679, 0.2697, (historical high ~0.4149–0.4390).
Current price: ~0.0551
Strong support/accumulation zone: around 0.043 – 0.056 (yellow box)
Breakdown low: ~0.0384
Potential moves from ~0.0551:
To 0.0740 ≈ +34.3%
To 0.0966 ≈ +75.3%
To 0.1679 ≈ +204.7%
Downside to 0.0384 ≈ -30.3%
Pattern Analysis (detailed & relevant)
Medium-term downtrend: price has been trending lower since the late 2024 peak, following a descending trendline. Recently, there was a breakout above this trendline, an early sign of trend weakening.
Accumulation zone (yellow box): price has tested and bounced from this area multiple times (April — Aug), indicating strong demand.
Possible double bottom/base formation: lows in early April and July/August at similar levels hint at a potential base-building phase. Needs confirmation with a breakout.
Key watch: A daily close above 0.0740 with strong volume would confirm bullish momentum. A breakdown below 0.0384 would confirm bearish continuation.
Bullish Scenario
1. Breakout confirmation — daily close above 0.0740 with strong volume → first target 0.0966, followed by 0.1679 and 0.2697.
2. Support retest & continuation — price may retest the accumulation box before bouncing, confirming the zone as a base for further gains.
3. Bullish signs: strong-bodied candles, successful retests, and increasing volume on breakout days.
Bearish Scenario
1. False breakout — price breaks the trendline but fails to surpass 0.0740, falling back into the range.
2. Accumulation breakdown — daily close below the yellow box (especially under 0.0384) → opens downside continuation risk.
3. Lower highs persist — continued inability to make higher highs keeps sellers in control.
Risk Management Checklist (Not financial advice)
Wait for daily close confirmation, not just intraday spikes.
Watch volume for breakout validation.
Conservative stop-loss: below the support box or 0.0384.
Take partial profits at key resistances (0.0740–0.0966), let the rest run if momentum continues.
Adjust position size according to risk per trade (e.g., 1–2% of capital).
#XAI #XAIUSDT #Crypto #TechnicalAnalysis #Breakout #SupportResistance #Accumulation #CryptoTrading
#XAI/USDT breakout Buy breakout,#XAI
The price is moving within an ascending channel on the 1-hour frame, adhering well to it, and is on its way to breaking strongly upwards and retesting it.
We have support from the lower boundary of the ascending channel, at 0.0511.
We have a downtrend on the RSI indicator that is about to break and retest, supporting the upside.
There is a major support area in green at 0.0513, which represents a strong basis for the upside.
Don't forget a simple thing: ease and capital.
When you reach the first target, save some money and then change your stop-loss order to an entry order.
For inquiries, please leave a comment.
We have a trend to hold above the 100 Moving Average.
Entry price: 0.0591.
First target: 0.0547.
Second target: 0.0568.
Third target: 0.0591.
Don't forget a simple thing: ease and capital.
When you reach your first target, save some money and then change your stop-loss order to an entry order.
For inquiries, please leave a comment.
Thank you.
XAI/USDT Breakout from Long-Term Downtrend — Is a Major Trend?🔍 Complete Technical Analysis & Market Insight
After months of downward pressure, XAI/USDT is finally showing significant signs of life. The pair has successfully broken out of a long-standing descending trendline that has capped price action since November 2024 — potentially marking the beginning of a new bullish phase.
📐 1. Pattern & Technical Structure:
🔸 Descending Trendline Breakout:
Price has broken above the descending trendline, ending a multi-month bearish phase.
The breakout is supported by bullish candles and an uptick in volume, suggesting momentum shift in favor of the bulls.
🔸 Strong Accumulation Zone (Demand Area):
The area between $0.0550 – $0.0740 has acted as a solid accumulation/support zone.
Multiple rejections and consolidations around this zone suggest aggressive buyer interest.
🔸 Higher Low Formation & Potential Reversal Structure:
A series of higher lows is forming, indicating a potential bullish trend reversal.
The price structure hints at the possible development of a larger bullish pattern, such as an inverse head and shoulders or base formation.
📈 Bullish Scenario:
If the breakout holds and the price sustains above the key support:
Short-term target:
$0.0966 – initial resistance and psychological level.
Mid-term targets:
$0.1679 – strong historical resistance.
$0.2697 – a major reaction zone from previous breakdowns.
Long-term target if momentum continues:
$0.3418 – $0.4390
⚠️ Confirmation with volume and follow-through candles is crucial to validate a sustained bullish move.
📉 Bearish Scenario:
If the price fails to maintain above the breakout zone:
It may retest the accumulation zone between $0.0740 – $0.0624.
A breakdown below $0.0550 would invalidate the bullish thesis and could lead back to the previous low at $0.0384.
Breaching below $0.0384 could trigger a renewed bearish continuation.
📊 Market Sentiment & Context:
XAI is at a technically significant point. With selling pressure weakening and early bullish structures emerging, XAI could be positioning for a strong upside move — especially if broader market conditions improve.
However, given the speculative nature of the current breakout, risk management remains essential. False breakouts are not uncommon, especially in altcoins.
🧭 Strategic Summary:
Potential Buy Zone (on retest): $0.0624 – $0.0740
Stop Loss (conservative): Below $0.0550
Take Profit targets:
Short-Term: $0.0966
Mid-Term: $0.1679 – $0.2697
Long-Term: $0.3418 – $0.4390
Big breakouts often begin with subtle but critical structural shifts. XAI is showing early signs of such a shift — it could be the calm before a bullish storm, or just a trap. Either way, it deserves your close attention.
#XAIUSDT #XAI #AltcoinBreakout #CryptoBreakout #TrendReversal #CryptoAnalysis
#TechnicalAnalysis #SupportResistance #BullishBreakout

#XAI/USDT#XAI
The price is moving within a descending channel on the 1-hour frame, adhering well to it, and is on its way to breaking it strongly upwards and retesting it.
We have a bounce from the lower boundary of the descending channel. This support is at 0.0476.
We have a downtrend on the RSI indicator that is about to break and retest, supporting the upside.
There is a major support area in green at 0.0472, which represents a strong basis for the upside.
Don't forget a simple thing: ease and capital.
When you reach the first target, save some money and then change your stop-loss order to an entry order.
For inquiries, please leave a comment.
We have a trend to hold above the 100 Moving Average.
Entry price: 0.0483
First target: 0.0502
Second target: 0.0517
Third target: 0.0532
Don't forget a simple thing: ease and capital.
When you reach the first target, save some money and then change your stop-loss order to an entry order.
For inquiries, please leave a comment.
Thank you.

XAI breakout Buy breakout, #XAI
The price is moving within a descending channel on the 1-hour frame and is expected to break and continue upward.
We have a trend to stabilize above the 100 moving average once again.
We have a downtrend on the RSI indicator that supports the upward break.
We have a support area at the lower boundary of the channel at 4.78, acting as strong support from which the price can rebound.
We have a major support area in green that pushed the price higher at 4.60.
Entry price: 4.88
First target: 5.047
Second target: 5.19
Third target: 5.35
To manage risk, don't forget stop loss and capital management.
When you reach the first target, save some profits and then change your stop order to an entry order.
For inquiries, please comment.
Thank you.

#XAI/USDT#XAI
The price is moving within a descending channel on the 1-hour frame, adhering well to it, and is heading for a strong breakout and retest.
We have a bounce from the lower boundary of the descending channel, which is support at 0.0448.
We have a downtrend on the RSI indicator that is about to be broken and retested, supporting the upward trend.
We have a trend of consolidation above the 100 moving average.
Entry price: 0.0466
First target: 0.0477
Second target: 0.0493
Third target: 0.0514

#XAI/USDT#XAI
The price is moving within a descending channel on the 1-hour frame, adhering well to it, and is heading toward a strong breakout and retest.
We are experiencing a rebound from the lower boundary of the descending channel. This support is at 0.0570.
We are experiencing a downtrend on the RSI indicator, which is about to break and retest, supporting the upward trend.
We are heading toward stability above the 100 moving average.
Entry price: 0.0686
First target: 0.0620
Second target: 0.0650
Third target: 0.0686

#XAI/USDT#XAI
The price is moving within a descending channel on the 1-hour frame and is expected to break and continue upward.
We have a trend to stabilize above the 100 moving average once again.
We have a downtrend on the RSI indicator, which supports the upward move by breaking it upward.
We have a support area at the lower limit of the channel at 0.0600, acting as strong support from which the price can rebound.
Entry price: 0.0610
First target: 0.0660
Second target: 0.0686
Third target: 0.0722

#XAI/USDT#XAI
The price is moving within a descending channel on the 1-hour frame and is expected to break and continue upward.
We have a trend to stabilize above the 100 moving average once again.
We have a downtrend on the RSI indicator, which supports the upward move by breaking it upward.
We have a support area at the lower limit of the channel at 0.0812, acting as strong support from which the price can rebound.
Entry price: 0.0850
First target: 0.0890
Second target: 0.0931
Third target: 0.0978
