Trend Doesn’t Cancel Corrections (And the Herd Always Pays)Yesterday, I made a call that sounded “wrong” to most retail traders.
✅ Silver will fill the gap.
✅ Gold will drop into the 4750 zone.
Both happened.
Not because I’m a prophet.
But because markets don’t work like retail emotions want them to work.
Even in a strong bullish trend, corrections are
About Gold Spot / U.S. Dollar
Gold price is widely followed in financial markets around the world. Gold was the basis of economic capitalism for hundreds of years until the repeal of the Gold standard, which led to the expansion of a flat currency system in which paper money doesn't have an implied backing with any physical form of monetization. AU is the code for Gold on the Periodic table of elements, and the price above is Gold quoted in US Dollars, which is the common yardstick for measuring the value of Gold across the world.

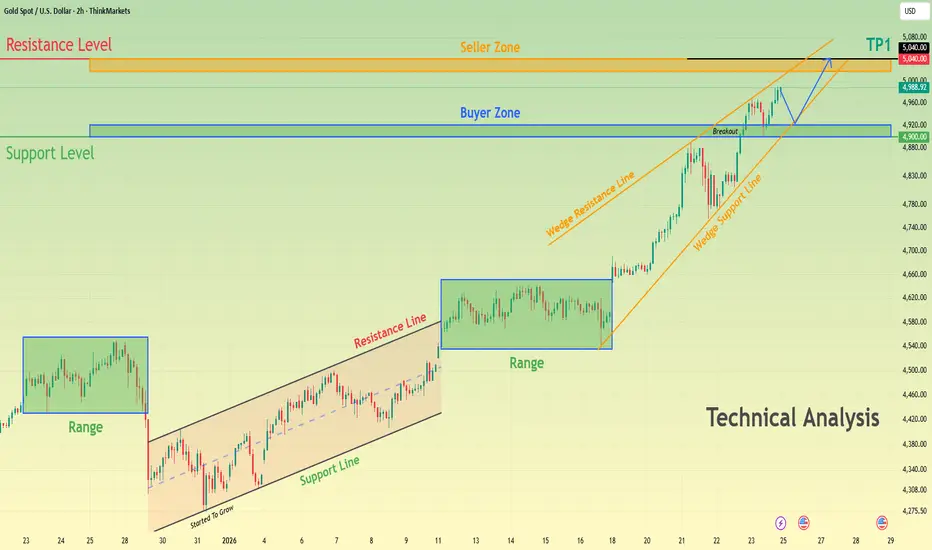
XAUUSD Bullish Structure Intact - $5,040 AheadHello traders! Here’s my technical outlook on XAUUSD (2H) based on the current chart structure. Gold continues to trade within a broader bullish context, maintaining a sequence of higher highs and higher lows. Earlier in the move, price spent a significant amount of time consolidating inside multipl
Gold at 5K: The Trend Is Up… But a 3K–5K Drop Feels InevitableLately, Gold is on everyone’s lips, and for good reason: price is printing new all-time highs almost daily, and we are now trading around the 5,000 zone.
And even though I’m not blind — I’m absolutely not calling for an overall trend reversal — in my view, a correction of 3,000 to 5,000 pips is n

Gold (XAUUSD) – Technical Analysis | Market StructureFrom a technical standpoint, gold continues to trade within a structurally sound bullish environment. Price action maintains a clear sequence of higher highs and higher lows, indicating that the broader upward structure remains intact.
Recent pullbacks have been controlled and shallow, suggesting c

XAUUSD: Continues Uptrend After Breakout, $5,170 in FocusHello everyone, here is my breakdown of the current XAUUSD setup.
Market Analysis
XAUUSD is trading within a strong and well-established bullish trend, supported by a clearly defined upward channel that has guided price higher over an extended period. Throughout this move, Gold has consistently r

Gold Price Intraday Analysis – Key Resistance and Support LevelsThis chart provides an intraday analysis of gold prices, highlighting critical levels for potential price action. Key zones include Trendline Resistance at 5,108.974, a Minor Resistance at 5,077.929, and a Support Zone at 5,040.216, where price could potentially bounce. The Key Support Level at 4,98

Gold 30Min Engaged ( Bullish Reversal Entry Detected )⚡Base : Hanzo Trading Alpha Algorithm
The algorithm calculates volatility displacement vs liquidity recovery, identifying where probability meets imbalance.
It trades only where precision, volume, and manipulation intersect —only logic.
Technical Reasons
/ Direction — LONG / Reversal 4819 Area
☄️B

Hellena | GOLD (4H): LONG to 50% Fibo 4933.Colleagues, the price continues its upward movement in wave “5” of the higher order (red wave), and a major correction is already quite close, but we need to understand where the upward momentum will end.
I believe that the price will renew its maximum and rise to the 50% Fibonacci extension level t

GOLD - Pullback before growth after Asian momentum FX:XAUUSD is correcting after hitting a historic high ($4,900), due to the de-escalation of tensions between the US and the EU. Profit-taking is observed, but the trend remains bullish...
Fundamental background:
- Trump has cooled down: tariffs are temporarily suspended, as is the forceful s

Only God or Nuclear War Can Break This Weekly Gold ResistanceA Resistance That Has Stopped Gold for 20 Years
On the weekly chart, gold has respected the same rising resistance line through every major global crisis:
May 2006 – ~$723
September 2011 – ~$1,900
Now / early 2026 projection – ~$5,000–$5,200
Each time price reached this zone, the world was u

See all ideas
Summarizing what the indicators are suggesting.
Oscillators
Neutral
SellBuy
Strong sellStrong buy
Strong sellSellNeutralBuyStrong buy
Oscillators
Neutral
SellBuy
Strong sellStrong buy
Strong sellSellNeutralBuyStrong buy
Summary
Neutral
SellBuy
Strong sellStrong buy
Strong sellSellNeutralBuyStrong buy
Summary
Neutral
SellBuy
Strong sellStrong buy
Strong sellSellNeutralBuyStrong buy
Summary
Neutral
SellBuy
Strong sellStrong buy
Strong sellSellNeutralBuyStrong buy
Moving Averages
Neutral
SellBuy
Strong sellStrong buy
Strong sellSellNeutralBuyStrong buy
Moving Averages
Neutral
SellBuy
Strong sellStrong buy
Strong sellSellNeutralBuyStrong buy
Displays a symbol's price movements over previous years to identify recurring trends.