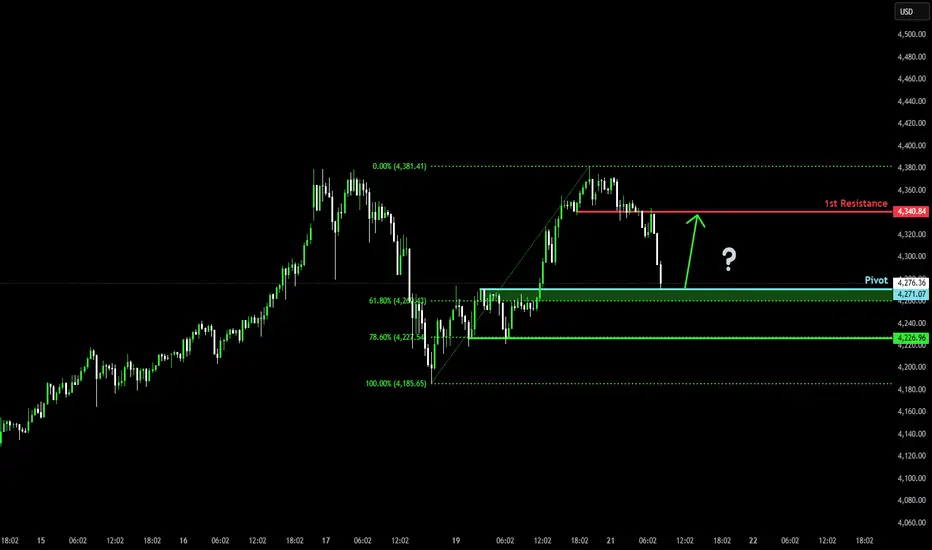
Could we see a bounce on Gold?The price is reacting off the pivot which is a pullback support and could bounce to the 1st resistance which acts as a pullback resistance.
Pivot: 4,271.07
1st Support: 4,226.96
1st Resistance: 4,340.84
Disclaimer:
The above opinions given constitute general market commentary, and do not constitute the opinion or advice of IC Markets or any form of personal or investment advice.
Any opinions, news, research, analyses, prices, other information, or links to third-party sites contained on this website are provided on an "as-is" basis, are intended only to be informative, is not an advice nor a recommendation, nor research, or a record of our trading prices, or an offer of, or solicitation for a transaction in any financial instrument and thus should not be treated as such. The information provided does not involve any specific investment objectives, financial situation and needs of any specific person who may receive it. Please be aware, that past performance is not a reliable indicator of future performance and/or results. Past Performance or Forward-looking scenarios based upon the reasonable beliefs of the third-party provider are not a guarantee of future performance. Actual results may differ materially from those anticipated in forward-looking or past performance statements. IC Markets makes no representation or warranty and assumes no liability as to the accuracy or completeness of the information provided, nor any loss arising from any investment based on a recommendation, forecast or any information supplied by any third-party.
Xau-usd
Gold's Historic Rally: Where We're HeadingGold broke out of a multi-year consolidation (2020–2024) when it cleared the previous all-time high of $2,080. Once that level broke, we entered price discovery mode .
This is important: There's no overhead resistance from traders who bought at higher levels because there are no higher levels. That's bullish. But it also means we're in uncharted territory.
The weekly chart shows a clean uptrend with no signs of reversal yet. But rallies this big and fast typically need consolidation phases.
Here's where it gets specific. Gold showed a classic consolidation pattern:
- Consolidation range: $2,565–$2,750
- Breakout point: Early 2025
- Measured move target: ~$3400
Using the Fibonacci extension, if the uptrend continues, it suggests the next major resistance is around $4,500 and $4,750.
If you plot these on a chart, you see:
- Gold broke out cleanly from consolidation
- Every pullback has been bought
We're in a controlled uptrend, not parabolic. This is the structure of a trend that could continue.
But it's also the structure that could reverse if critical support breaks.

Gold Hits New Record as U.S.–China Tensions and Rate-Cut Bets FuGOLD – PREMIUM UPDATE | Gold Hits New Record as U.S.–China Tensions and Rate-Cut Bets Fuel Rally
Gold hit a fresh record high at $4,218, driven by escalating U.S.–China trade tensions, renewed rate-cut expectations, and rising geopolitical uncertainty.
Investors continue to increase exposure to bullion as a hedge against risk, while Fed Chair Powell’s dovish comments in Philadelphia strengthened rate-cut bets, putting additional pressure on the U.S. dollar and reinforcing gold’s bullish tone.
Key Levels
Pivot: 4,202
Resistance: 4,224 · 4,250 · 4,267
Support: 4,174 · 4,162 · 4,140
Trading Plan
Buy Setup: Long positions remain valid above 4,162, targeting 4,224 / 4,250 / 4,267.
Sell Setup: Shorts correction valid below 4211, targeting 4,175 / 4,162.
Premium Takeaway
Gold maintains strong bullish control above $4,162, with momentum favoring another leg higher toward 4,250–4,267.
Only a decisive break below 4,162 would trigger a short-term correction, while sustained strength above 4,211 keeps the uptrend intact and opens the path toward a new ATH above $4,300.

Bullish continuation?Gold (XAU/USD) could fall to the pivot, which is a pullback support, and could bounce to the 1st resistance.
Pivot: 4,168.43
1st Support: 4,108.32
1st Resistance: 4,242.14
Disclaimer:
The above opinions given constitute general market commentary, and do not constitute the opinion or advice of IC Markets or any form of personal or investment advice.
Any opinions, news, research, analyses, prices, other information, or links to third-party sites contained on this website are provided on an "as-is" basis, are intended only to be informative, is not an advice nor a recommendation, nor research, or a record of our trading prices, or an offer of, or solicitation for a transaction in any financial instrument and thus should not be treated as such. The information provided does not involve any specific investment objectives, financial situation and needs of any specific person who may receive it. Please be aware, that past performance is not a reliable indicator of future performance and/or results. Past Performance or Forward-looking scenarios based upon the reasonable beliefs of the third-party provider are not a guarantee of future performance. Actual results may differ materially from those anticipated in forward-looking or past performance statements. IC Markets makes no representation or warranty and assumes no liability as to the accuracy or completeness of the information provided, nor any loss arising from any investment based on a recommendation, forecast or any information supplied by any third-party.

XAUUSD M30 | Bullish riseGold (XAU/USD) is reacting off the buy entry at 4,000.37, which is a pullback support and could potentially rise from this level to the upside.
Stop loss is at 3,950.65, which is a multi-swing low support.
Take profit is at 4,056.76, which is a multi swing high resistance.
High Risk Investment Warning
Trading Forex/CFDs on margin carries a high level of risk and may not be suitable for all investors. Leverage can work against you.
Stratos Markets Limited (tradu.com ):
CFDs are complex instruments and come with a high risk of losing money rapidly due to leverage. 65% of retail investor accounts lose money when trading CFDs with this provider. You should consider whether you understand how CFDs work and whether you can afford to take the high risk of losing your money.
Stratos Europe Ltd (tradu.com ):
CFDs are complex instruments and come with a high risk of losing money rapidly due to leverage. 66% of retail investor accounts lose money when trading CFDs with this provider. You should consider whether you understand how CFDs work and whether you can afford to take the high risk of losing your money.
Stratos Global LLC (tradu.com ):
Losses can exceed deposits.
Please be advised that the information presented on TradingView is provided to Tradu (‘Company’, ‘we’) by a third-party provider (‘TFA Global Pte Ltd’). Please be reminded that you are solely responsible for the trading decisions on your account. There is a very high degree of risk involved in trading. Any information and/or content is intended entirely for research, educational and informational purposes only and does not constitute investment or consultation advice or investment strategy. The information is not tailored to the investment needs of any specific person and therefore does not involve a consideration of any of the investment objectives, financial situation or needs of any viewer that may receive it. Kindly also note that past performance is not a reliable indicator of future results. Actual results may differ materially from those anticipated in forward-looking or past performance statements. We assume no liability as to the accuracy or completeness of any of the information and/or content provided herein and the Company cannot be held responsible for any omission, mistake nor for any loss or damage including without limitation to any loss of profit which may arise from reliance on any information supplied by TFA Global Pte Ltd.
The speaker(s) is neither an employee, agent nor representative of Tradu and is therefore acting independently. The opinions given are their own, constitute general market commentary, and do not constitute the opinion or advice of Tradu or any form of personal or investment advice. Tradu neither endorses nor guarantees offerings of third-party speakers, nor is Tradu responsible for the content, veracity or opinions of third-party speakers, presenters or participants.

GOLD – Pullback After Gaza Deal, Fed Speech to Steer Next MoveGOLD – Overview | Pullback After Gaza Deal, But Bullish Structure Intact
Gold eased slightly after the announcement of a Gaza ceasefire deal between Israel and Hamas, as geopolitical tensions cooled.
However, prices remain near record highs, supported by expectations of further Fed rate cuts, strong ETF inflows, and persistent concerns surrounding the U.S. economy and the government shutdown.
Investors now await today’s Fed speech, which could set the tone for near-term volatility in the metal.
Technical Outlook
The price stabilized below the pivot line at 4,041, signaling mild bearish pressure in the short term.
As long as gold trades below this zone, momentum may continue toward 4,026 → 4,010, and a confirmed 15M close below 4,010 could extend the move toward 3,987.
On the other hand, a 15M close above 4,041 would shift momentum back to the upside, opening the way toward 4,058 → 4,072 → 4,092, with the 4,100 area marking the next key bullish target.
Pivot Line: 4,041
Resistance: 4,058 · 4,072 · 4,092
Support: 4,026 · 4,010 · 3,987
Summary:
Gold remains fundamentally supported by global uncertainty and Fed rate-cut bets, even as short-term corrections play out.
Watch for volatility around the Fed speech—a dovish tone may reignite bullish momentum above 4,041, while a hawkish tone could trigger deeper correction below 4,010.

Gold - 4H Forecast ☀️ GOLD – 4H Forecast ☀️
Alright gold gang, let’s talk business — XAU/USD is setting up for something clean 👇
🧠 Bias :
Still bullish overall, but we’re chilling in premium territory, and this structure screams “pullback incoming.” Expect a retrace before the next rocket launch 🚀.
🧩 Technical Breakdown:
Price just printed a Buy-Side Liquidity (BSL) grab up top — textbook liquidity sweep before a potential correction.
We’ve got a strong impulsive leg pushing off a 4H + Daily demand confluence around $3,850–$3,880.
The 71% fib retracement zone aligns beautifully with that 4H demand, creating a prime reload area if price dips.
The volume profile gap (POI) also hints at untested liquidity sitting below current highs.
🎯 Trade Idea:
Entry Zone: $3,880–$3,860 (4H & Daily demand overlap)
Target 1: $3,970 (current high retest)
Target 2: $4,010+ (continuation into new impulse)
Invalidation: Below $3,830 (break of structure + demand failure)
⚙️ Risk Management:
Keep risk tight — 1%–1.5% max. If we get a reaction at the 71% level, partials at $3,950 are smart to secure profits before the next leg.
💬 Summary :
Gold just ran buy-side liquidity and looks ready to dip into discount before ripping higher again. If we get a clean 4H or 1H confirmation in the demand, expect another bullish leg to unfold.

GOLD H1 | Bullish ContinuationBased on the H1 chart analysis, we could see the price fall to the buy entry at 3,894.11, which is a pullback support that aligns with the 38.2% Fibonacci retracement and could bounce from this level to the upside.
Stop loss is at 3,853.38, which is a pullback support that is slightly above the 78.6% Fibonacci retracement.
Take profit is at 3,946.56, which is a pullback resistance.
High Risk Investment Warning
Trading Forex/CFDs on margin carries a high level of risk and may not be suitable for all investors. Leverage can work against you.
Stratos Markets Limited (tradu.com ):
CFDs are complex instruments and come with a high risk of losing money rapidly due to leverage. 65% of retail investor accounts lose money when trading CFDs with this provider. You should consider whether you understand how CFDs work and whether you can afford to take the high risk of losing your money.
Stratos Europe Ltd (tradu.com ):
CFDs are complex instruments and come with a high risk of losing money rapidly due to leverage. 66% of retail investor accounts lose money when trading CFDs with this provider. You should consider whether you understand how CFDs work and whether you can afford to take the high risk of losing your money.
Stratos Global LLC (tradu.com ):
Losses can exceed deposits.
Please be advised that the information presented on TradingView is provided to Tradu (‘Company’, ‘we’) by a third-party provider (‘TFA Global Pte Ltd’). Please be reminded that you are solely responsible for the trading decisions on your account. There is a very high degree of risk involved in trading. Any information and/or content is intended entirely for research, educational and informational purposes only and does not constitute investment or consultation advice or investment strategy. The information is not tailored to the investment needs of any specific person and therefore does not involve a consideration of any of the investment objectives, financial situation or needs of any viewer that may receive it. Kindly also note that past performance is not a reliable indicator of future results. Actual results may differ materially from those anticipated in forward-looking or past performance statements. We assume no liability as to the accuracy or completeness of any of the information and/or content provided herein and the Company cannot be held responsible for any omission, mistake nor for any loss or damage including without limitation to any loss of profit which may arise from reliance on any information supplied by TFA Global Pte Ltd.
The speaker(s) is neither an employee, agent nor representative of Tradu and is therefore acting independently. The opinions given are their own, constitute general market commentary, and do not constitute the opinion or advice of Tradu or any form of personal or investment advice. Tradu neither endorses nor guarantees offerings of third-party speakers, nor is Tradu responsible for the content, veracity or opinions of third-party speakers, presenters or participants.

GOLD H1 | Potential Bearish ReversalBased on the H1 chart analysis, we could see the price rise to the sell entry at 3,870.59, which is a pullback resistance that aligns with the 61.8% Fibonacci retracement and could reverse from this level to the downside.
Stop loss is at 3,896.35, which is a multi-swing high resistance.
Take profit is at 3,827.54, which is a pullback support.
High Risk Investment Warning
Trading Forex/CFDs on margin carries a high level of risk and may not be suitable for all investors. Leverage can work against you.
Stratos Markets Limited (tradu.com ):
CFDs are complex instruments and come with a high risk of losing money rapidly due to leverage. 65% of retail investor accounts lose money when trading CFDs with this provider. You should consider whether you understand how CFDs work and whether you can afford to take the high risk of losing your money.
Stratos Europe Ltd (tradu.com ):
CFDs are complex instruments and come with a high risk of losing money rapidly due to leverage. 66% of retail investor accounts lose money when trading CFDs with this provider. You should consider whether you understand how CFDs work and whether you can afford to take the high risk of losing your money.
Stratos Global LLC (tradu.com ):
Losses can exceed deposits.
Please be advised that the information presented on TradingView is provided to Tradu (‘Company’, ‘we’) by a third-party provider (‘TFA Global Pte Ltd’). Please be reminded that you are solely responsible for the trading decisions on your account. There is a very high degree of risk involved in trading. Any information and/or content is intended entirely for research, educational and informational purposes only and does not constitute investment or consultation advice or investment strategy. The information is not tailored to the investment needs of any specific person and therefore does not involve a consideration of any of the investment objectives, financial situation or needs of any viewer that may receive it. Kindly also note that past performance is not a reliable indicator of future results. Actual results may differ materially from those anticipated in forward-looking or past performance statements. We assume no liability as to the accuracy or completeness of any of the information and/or content provided herein and the Company cannot be held responsible for any omission, mistake nor for any loss or damage including without limitation to any loss of profit which may arise from reliance on any information supplied by TFA Global Pte Ltd.
The speaker(s) is neither an employee, agent nor representative of Tradu and is therefore acting independently. The opinions given are their own, constitute general market commentary, and do not constitute the opinion or advice of Tradu or any form of personal or investment advice. Tradu neither endorses nor guarantees offerings of third-party speakers, nor is Tradu responsible for the content, veracity or opinions of third-party speakers, presenters or participants.

XAUUSD H1 Bullish Momentum Likely to ExtendGold (XAU/USD) has bounced off the buy entry at 3,854.03, which is a pullback support that lines up with the 38.2% Fibonacci retracement and could bounce from this level to the take profit.
Stop loss is at 3,831.23, which is a pullback support that aligns with the 61.8% Fibonacci retracement.
Take profit is at 3,893.04, which is a swing high resistance.
High Risk Investment Warning
Trading Forex/CFDs on margin carries a high level of risk and may not be suitable for all investors. Leverage can work against you.
Stratos Markets Limited (tradu.com ):
CFDs are complex instruments and come with a high risk of losing money rapidly due to leverage. 65% of retail investor accounts lose money when trading CFDs with this provider. You should consider whether you understand how CFDs work and whether you can afford to take the high risk of losing your money.
Stratos Europe Ltd (tradu.com ):
CFDs are complex instruments and come with a high risk of losing money rapidly due to leverage. 66% of retail investor accounts lose money when trading CFDs with this provider. You should consider whether you understand how CFDs work and whether you can afford to take the high risk of losing your money.
Stratos Global LLC (tradu.com ):
Losses can exceed deposits.
Please be advised that the information presented on TradingView is provided to Tradu (‘Company’, ‘we’) by a third-party provider (‘TFA Global Pte Ltd’). Please be reminded that you are solely responsible for the trading decisions on your account. There is a very high degree of risk involved in trading. Any information and/or content is intended entirely for research, educational and informational purposes only and does not constitute investment or consultation advice or investment strategy. The information is not tailored to the investment needs of any specific person and therefore does not involve a consideration of any of the investment objectives, financial situation or needs of any viewer that may receive it. Kindly also note that past performance is not a reliable indicator of future results. Actual results may differ materially from those anticipated in forward-looking or past performance statements. We assume no liability as to the accuracy or completeness of any of the information and/or content provided herein and the Company cannot be held responsible for any omission, mistake nor for any loss or damage including without limitation to any loss of profit which may arise from reliance on any information supplied by TFA Global Pte Ltd.
The speaker(s) is neither an employee, agent nor representative of Tradu and is therefore acting independently. The opinions given are their own, constitute general market commentary, and do not constitute the opinion or advice of Tradu or any form of personal or investment advice. Tradu neither endorses nor guarantees offerings of third-party speakers, nor is Tradu responsible for the content, veracity or opinions of third-party speakers, presenters or participants.

Bullish bounce for the Gold?The price is falling towards the pivot and could bounce to the 1st resistance which acts as a swing high resistance.
Pivot: 3,699.30
1st Support: 3,654.40
1st Resistance: 3,784.06
Disclaimer:
The above opinions given constitute general market commentary, and do not constitute the opinion or advice of IC Markets or any form of personal or investment advice.
Any opinions, news, research, analyses, prices, other information, or links to third-party sites contained on this website are provided on an "as-is" basis, are intended only to be informative, is not an advice nor a recommendation, nor research, or a record of our trading prices, or an offer of, or solicitation for a transaction in any financial instrument and thus should not be treated as such. The information provided does not involve any specific investment objectives, financial situation and needs of any specific person who may receive it. Please be aware, that past performance is not a reliable indicator of future performance and/or results. Past Performance or Forward-looking scenarios based upon the reasonable beliefs of the third-party provider are not a guarantee of future performance. Actual results may differ materially from those anticipated in forward-looking or past performance statements. IC Markets makes no representation or warranty and assumes no liability as to the accuracy or completeness of the information provided, nor any loss arising from any investment based on a recommendation, forecast or any information supplied by any third-party.

Bullish continuation?The Gold (XAU/USD) is falling towards the pivot which aligns with the 38.2% Fibonacci retracement and could bounce to the 1st resistance.
Pivot: 3,563.40
1st Support: 3,501.76
1st Resistance: 3,706.97
Disclaimer:
The above opinions given constitute general market commentary, and do not constitute the opinion or advice of IC Markets or any form of personal or investment advice.
Any opinions, news, research, analyses, prices, other information, or links to third-party sites contained on this website are provided on an "as-is" basis, are intended only to be informative, is not an advice nor a recommendation, nor research, or a record of our trading prices, or an offer of, or solicitation for a transaction in any financial instrument and thus should not be treated as such. The information provided does not involve any specific investment objectives, financial situation and needs of any specific person who may receive it. Please be aware, that past performance is not a reliable indicator of future performance and/or results. Past Performance or Forward-looking scenarios based upon the reasonable beliefs of the third-party provider are not a guarantee of future performance. Actual results may differ materially from those anticipated in forward-looking or past performance statements. IC Markets makes no representation or warranty and assumes no liability as to the accuracy or completeness of the information provided, nor any loss arising from any investment based on a recommendation, forecast or any information supplied by any third-party.

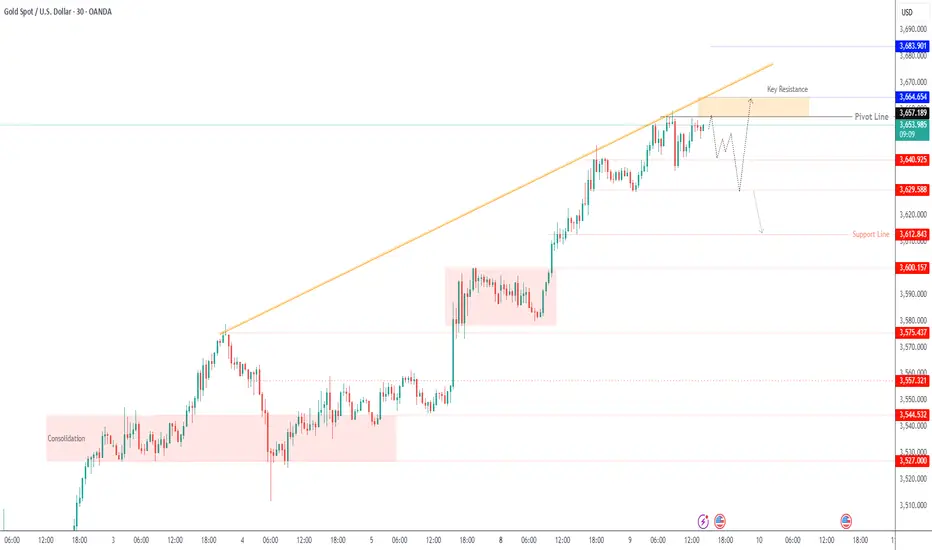
GOLD – Rebound Holds Above Key 3,655 PivotGOLD – OVERVIEW
Gold rebounded in early trade after Thursday’s decline, supported by buyers despite a stronger U.S. dollar and a cautious Fed outlook. The Federal Reserve’s September meeting signaled fewer rate cuts than markets had expected, keeping sentiment mixed but overall supportive for gold.
Technical Analysis
GOLD is trying to touch the support level before the next bullish movement, which is 3639.
🔹A confirmed 15-min or 1-hour close above 3666 will strengthen the bullish continuation toward 3676 and 3686.
🔹However, a 15-min or 1-hour close below 3655 would trigger a bearish correction toward 3639.
🔹A sustained break below 3639 opens the way for deeper downside to 3628 and 3612.
Key Levels
Pivot: 3655
Resistance: 3666, 3676, 3686
Support: 3639, 3628, 3612

XAUUSD H1 | Bearish drop offBased on the H1 chart analysis, we can see that the price has rejected off the sell entry at 3,655.23, which is a pullback resistance and could drop from this levle to the take profit.
Stop loss is at 3,672.97, whichis a pullback resistance.
Take profit is at 3,616.99, which is a pullback support that lines up with the 127.2% Fibonacci extension.
High Risk Investment Warning
Trading Forex/CFDs on margin carries a high level of risk and may not be suitable for all investors. Leverage can work against you.
Stratos Markets Limited (tradu.com ):
CFDs are complex instruments and come with a high risk of losing money rapidly due to leverage. 65% of retail investor accounts lose money when trading CFDs with this provider. You should consider whether you understand how CFDs work and whether you can afford to take the high risk of losing your money.
Stratos Europe Ltd (tradu.com ):
CFDs are complex instruments and come with a high risk of losing money rapidly due to leverage. 66% of retail investor accounts lose money when trading CFDs with this provider. You should consider whether you understand how CFDs work and whether you can afford to take the high risk of losing your money.
Stratos Global LLC (tradu.com ):
Losses can exceed deposits.
Please be advised that the information presented on TradingView is provided to Tradu (‘Company’, ‘we’) by a third-party provider (‘TFA Global Pte Ltd’). Please be reminded that you are solely responsible for the trading decisions on your account. There is a very high degree of risk involved in trading. Any information and/or content is intended entirely for research, educational and informational purposes only and does not constitute investment or consultation advice or investment strategy. The information is not tailored to the investment needs of any specific person and therefore does not involve a consideration of any of the investment objectives, financial situation or needs of any viewer that may receive it. Kindly also note that past performance is not a reliable indicator of future results. Actual results may differ materially from those anticipated in forward-looking or past performance statements. We assume no liability as to the accuracy or completeness of any of the information and/or content provided herein and the Company cannot be held responsible for any omission, mistake nor for any loss or damage including without limitation to any loss of profit which may arise from reliance on any information supplied by TFA Global Pte Ltd.
The speaker(s) is neither an employee, agent nor representative of Tradu and is therefore acting independently. The opinions given are their own, constitute general market commentary, and do not constitute the opinion or advice of Tradu or any form of personal or investment advice. Tradu neither endorses nor guarantees offerings of third-party speakers, nor is Tradu responsible for the content, veracity or opinions of third-party speakers, presenters or participants.

Gold Outlook: Bearish Below 3,676, Bulls Need 3,684 BreakGOLD – Overview
Gold remains sensitive ahead of the Federal Reserve rate decision, with volatility also influenced by the potential U.S.–U.K. trade deal.
A Fed rate cut typically supports gold, but
A successful U.S.–U.K. trade deal would reduce safe-haven demand, adding bearish pressure.
Technical Outlook
📉 Bearish scenario
Price may first test 3,676, then drop toward 3,666 → 3,657.
A sustained break below 3,657 would open deeper downside toward 3,640.
📈 Bullish scenario
A confirmed 1H close above 3,684 would signal bullish continuation.
Upside targets: 3,693 → 3,700 → 3,711.
Key Levels
Pivot: 3,676
Resistance: 3,684 – 3,699 – 3,711
Support: 3,666 – 3,657 – 3,640
📌 Market Context:
Fed Decision: A dovish Fed or larger cut could lift gold toward 3,693+.
U.S.–U.K. Trade Deal: Positive headlines would likely weigh on gold by reducing safe-haven flows.

Potential bearish drop off?The Gold (XAU/USD) has reacted off the pivot and could drop to the 1st support which acts as a pullback support.
Pivot: 3,674.77
1st Support: 3,624.94
1st Resistance: 3,697.75
Disclaimer:
The above opinions given constitute general market commentary, and do not constitute the opinion or advice of IC Markets or any form of personal or investment advice.
Any opinions, news, research, analyses, prices, other information, or links to third-party sites contained on this website are provided on an "as-is" basis, are intended only to be informative, is not an advice nor a recommendation, nor research, or a record of our trading prices, or an offer of, or solicitation for a transaction in any financial instrument and thus should not be treated as such. The information provided does not involve any specific investment objectives, financial situation and needs of any specific person who may receive it. Please be aware, that past performance is not a reliable indicator of future performance and/or results. Past Performance or Forward-looking scenarios based upon the reasonable beliefs of the third-party provider are not a guarantee of future performance. Actual results may differ materially from those anticipated in forward-looking or past performance statements. IC Markets makes no representation or warranty and assumes no liability as to the accuracy or completeness of the information provided, nor any loss arising from any investment based on a recommendation, forecast or any information supplied by any third-party.

GOLD H1 | Bearish dropBased on the H1 chart analysis, we can see that the price has rejected off the sell entry at 3,686.33, which is a pullback resistance and could potentially drop from this level to he take profit.
Stop loss is at 3,703.51, which is a pullback resistance.
Take profit is at 3,657.45, which is a pullback support that aligns with the 61.8% Fibonacci retracement.
High Risk Investment Warning
Trading Forex/CFDs on margin carries a high level of risk and may not be suitable for all investors. Leverage can work against you.
Stratos Markets Limited (tradu.com ):
CFDs are complex instruments and come with a high risk of losing money rapidly due to leverage. 65% of retail investor accounts lose money when trading CFDs with this provider. You should consider whether you understand how CFDs work and whether you can afford to take the high risk of losing your money.
Stratos Europe Ltd (tradu.com ):
CFDs are complex instruments and come with a high risk of losing money rapidly due to leverage. 66% of retail investor accounts lose money when trading CFDs with this provider. You should consider whether you understand how CFDs work and whether you can afford to take the high risk of losing your money.
Stratos Global LLC (tradu.com ):
Losses can exceed deposits.
Please be advised that the information presented on TradingView is provided to Tradu (‘Company’, ‘we’) by a third-party provider (‘TFA Global Pte Ltd’). Please be reminded that you are solely responsible for the trading decisions on your account. There is a very high degree of risk involved in trading. Any information and/or content is intended entirely for research, educational and informational purposes only and does not constitute investment or consultation advice or investment strategy. The information is not tailored to the investment needs of any specific person and therefore does not involve a consideration of any of the investment objectives, financial situation or needs of any viewer that may receive it. Kindly also note that past performance is not a reliable indicator of future results. Actual results may differ materially from those anticipated in forward-looking or past performance statements. We assume no liability as to the accuracy or completeness of any of the information and/or content provided herein and the Company cannot be held responsible for any omission, mistake nor for any loss or damage including without limitation to any loss of profit which may arise from reliance on any information supplied by TFA Global Pte Ltd.
The speaker(s) is neither an employee, agent nor representative of Tradu and is therefore acting independently. The opinions given are their own, constitute general market commentary, and do not constitute the opinion or advice of Tradu or any form of personal or investment advice. Tradu neither endorses nor guarantees offerings of third-party speakers, nor is Tradu responsible for the content, veracity or opinions of third-party speakers, presenters or participants.

GOLD H1 | Bullish continuationBased on the H1 chart analysis, we could see the price fall to the buy entry at 3,655.51, which is a pullback support that lines up with the 50% Fibonacci retracement and could bounce from this level to our take profit.
Stop loss is at 3,631.24, which is a pullback support.
Take profit is at 3,684.97, which is a pullback resistance.
High Risk Investment Warning
Trading Forex/CFDs on margin carries a high level of risk and may not be suitable for all investors. Leverage can work against you.
Stratos Markets Limited (tradu.com ):
CFDs are complex instruments and come with a high risk of losing money rapidly due to leverage. 65% of retail investor accounts lose money when trading CFDs with this provider. You should consider whether you understand how CFDs work and whether you can afford to take the high risk of losing your money.
Stratos Europe Ltd (tradu.com ):
CFDs are complex instruments and come with a high risk of losing money rapidly due to leverage. 66% of retail investor accounts lose money when trading CFDs with this provider. You should consider whether you understand how CFDs work and whether you can afford to take the high risk of losing your money.
Stratos Global LLC (tradu.com ):
Losses can exceed deposits.
Please be advised that the information presented on TradingView is provided to Tradu (‘Company’, ‘we’) by a third-party provider (‘TFA Global Pte Ltd’). Please be reminded that you are solely responsible for the trading decisions on your account. There is a very high degree of risk involved in trading. Any information and/or content is intended entirely for research, educational and informational purposes only and does not constitute investment or consultation advice or investment strategy. The information is not tailored to the investment needs of any specific person and therefore does not involve a consideration of any of the investment objectives, financial situation or needs of any viewer that may receive it. Kindly also note that past performance is not a reliable indicator of future results. Actual results may differ materially from those anticipated in forward-looking or past performance statements. We assume no liability as to the accuracy or completeness of any of the information and/or content provided herein and the Company cannot be held responsible for any omission, mistake nor for any loss or damage including without limitation to any loss of profit which may arise from reliance on any information supplied by TFA Global Pte Ltd.
The speaker(s) is neither an employee, agent nor representative of Tradu and is therefore acting independently. The opinions given are their own, constitute general market commentary, and do not constitute the opinion or advice of Tradu or any form of personal or investment advice. Tradu neither endorses nor guarantees offerings of third-party speakers, nor is Tradu responsible for the content, veracity or opinions of third-party speakers, presenters or participants.

Gold Holds Near Record Highs Ahead of Fed Rate DecisionGOLD – Overview
Gold edged lower in early trade on profit-taking and a firmer dollar but continues to hover near record highs ahead of the Federal Reserve’s rate decision later this week.
Markets widely expect a rate cut, with Powell’s commentary likely to provide key guidance on inflation, labor market weakness, and potential tariff impacts.
Prices also remain supported by safe-haven demand, robust central-bank buying, and continued inflows into gold-backed ETFs.
Technical Outlook
📈 Bullish scenario: Price shows a sensitive upward bias and may retest the resistance zone around 3,657. A 15-minute close above 3,664 would confirm continuation toward 3,665 → 3,683.
📉 Bearish scenario: A reversal and 1H close below 3,628 would signal downside pressure, targeting 3,612 → 3,600.
⚖️ Range watch: Consolidation is expected between 3,628 – 3,640 until a breakout occurs.
Key Levels
Pivot: 3,640
Resistance: 3,657 – 3,665 – 3,683
Support: 3,628 – 3,612 – 3,600
Bias: Neutral inside the 3,628–3,640 range; breakout direction confirmed on a close above 3,664 or below 3,628.

XAU/USD (Gold) - Trendline Breakout (US - CPI Data) (11.09.2025)The XAU/USD Pair on the M30 timeframe presents a Potential Selling Opportunity due to a recent Formation of a Trendline Breakout Pattern.
This suggests a shift in momentum towards the downside in the coming hours.
Possible Short Trade:
Entry: Consider Entering A Short Position around Trendline Of The Pattern.
Target Levels:
1st Support – 3583
2nd Support – 3546
🎁 Please hit the like button and
🎁 Leave a comment to support for My Post !
Your likes and comments are incredibly motivating and will encourage me to share more analysis with you.

Gold : Neutral Between 3,640–3,657, Breakout to DecideGold – Overview
Gold hit a fresh record high at $3,659 on Tuesday, supported by weak U.S. jobs data and growing bets on Fed rate cuts. Traders now await key U.S. inflation releases – PPI on Wednesday and CPI on Thursday – which could drive the next major move.
📊 If inflation comes in hotter than expected, gold risks a sharp correction.
📊 If inflation is weaker, expectations for a 50 bps Fed rate cut could lift gold further.
Technical Outlook:
🔻 While below 3,657, price may correct toward 3,640. A 15M close below 3,640 would extend the decline to 3,629.
🔺 Stability above 3,657 on a 15M close would support further upside toward 3,665 → 3,683.
Key Levels:
Pivot: 3,657
Support: 3,640 – 3,629 – 3,612
Resistance: 3,665 – 3,683
previous idea:
Gold Hits Record $3,625 – Bulls Eye 3,636/3,650Gold – Overview
Gold surged to a record high at $3,625, following weaker U.S. hiring data that fueled demand for the safe-haven asset. Momentum remains strong, with traders watching if there’s more room to the upside.
Technical Outlook:
📈 Bullish scenario: As long as price trades above 3,612, momentum favors a move toward 3,636. A confirmed stabilization above 3,637 would extend the rally toward 3,650.
📉 Bearish scenario: A confirmed 1H close below 3,612 would trigger a correction, targeting 3,600 → 3,580.
Key Levels:
Pivot: 3,618
Resistance: 3,636 – 3,650
Support: 3,612 – 3,600 – 3,580
Bias: Bullish above 3,612; bearish correction only if price closes below this leve
previous idea:

XAUUSD - Daily | The breakout is REALSimple trading - Triangle pattern
Gold is back to making All-Time highs. Reaching as high as 3600. You can see the breakout was fast and instant. In less than 2 weeks, gold managed to move the price over 1500 pips.
The target of the triangle breakout is nearly reached. Roughly 3675.
Gold has already tested support that was previously a bullish daily FVG. With clean rejection, we see the price remaining bullish.
