Gold (XAU/USD): High-Level Consolidation and Momentum Divergence
🔬 Market Outlook: Structural Breakout vs. Momentum Divergence
This analysis evaluates the current technical posture of the market through a multi-factor lens, combining Volume Profile distribution, institutional money flow, and structural breakout targets. While the macro structure remains bullish following a significant impulsive expansion, near-term data suggests a developing conflict between price action and underlying momentum. The following report breaks down the key technical confluences, highlighting the tension between the recent structural breakout and emerging signs of distribution at local highs.
📜 Chart Analysis: Structural assessment assisted by the [ Smart Fixed Volume Profile ] logic.
● Market Context & Structure
Trend Status: Macro Bullish with signs of immediate momentum exhaustion. Key Levels: Resistance near 4640 (Value Area High proximity) | Support near 4604 (Point of Control) and 4475 (Runaway Gap structure and Unusual Volume).
Current Phase: High-level consolidation following a significant impulsive expansion.
● Technical Confluence Analysis The market structure exhibits a mature bullish trend, initially driven by high-momentum gaps identified as "Breakaway" and "Runaway" structures, confirming aggressive institutional accumulation from the 4274 lows. However, the recent price action displays a "BE" (Buyer Exhaustion) liquidity strain signal at the local peak near 4640. This signal correlates with a rejection near the upper bounds of the profile's Value Area, suggesting that buying liquidity is becoming strained and supply is entering the market. The price is currently testing the Point of Control (POC) at 4604.35. A sustained rotation around this high-volume node indicates market acceptance of these higher prices, yet the failure to push immediately through the "BE" signal implies a transition from an impulsive phase to a balanced inventory correction. The profile distribution is becoming bell-shaped, characteristic of a market seeking equilibrium after a trend.
● Analytical Conclusion
Directional Bias: Neutral-Bullish (Caution warranted due to Buyer Exhaustion signal). Invalidation Point: A sustained close below 4427 (Value Area Low), which would invalidate the current value acceptance and suggest a deeper mean reversion.
📜 Market Insight: Tracking institutional momentum shifts via [ Smart Money Flow Oscillator ]
● Market Context & Structure
Trend Status: Macro Bullish structure currently undergoing a Momentum Deceleration phase. Key Levels: Resistance near 4,640 (Recent Swing High) | Support near 4,570 (Previous Consolidation Zone).
Current Phase: Distribution / Corrective Pullback. The market is consolidating recent gains, but underlying flow data suggests a weakening of the impulsive bid.
● Technical Confluence Analysis The Smart Money Flow Oscillator is currently operating in "In/Out" mode (indicated by the 0-100 scale and the 50.0 equilibrium line) and presents a notable bearish divergence against the price action. While the spot price of Gold established a higher high near 4,640, the oscillator failed to confirm this strength, printing a lower high and subsequently crossing below the 50.0 neutral threshold to a current reading of 47.99. This crossover into sub-50 territory indicates that net money flow has shifted from accumulation to distribution. Furthermore, the visual "cloud" spread is red, signaling that the immediate flow velocity is tracking below its signal line/moving average. The efficiency metric on the dashboard (1.66x) suggests that price movement is relatively efficient per unit of volume, implying that the current downward drift is not merely noise but carries valid transactional weight. The disconnect between elevated prices and declining flow metrics is a classic signature of institutional distribution into retail strength.
● Analytical Conclusion
Directional Bias: Bearish / Corrective. The failure to maintain flow above the 50.0 midline despite price proximity to highs suggests a deeper retracement is probable. Invalidation Point: A 4-hour candle close above 4,645 would negate the divergence and signal a resumption of the primary impulsive trend.
📜 Technical Setup: Identifying key structural breaks and projected levels using [ Trend Break Targets ]
● Market Context & Structure
Trend Status: Strongly Bullish (Impulsive Breakout Phase). Key Levels: Resistance near 4,640 (Local Highs) and 4,675 (Target 2) | Support near 4,565 (Target 1 Confluence) and 4,400 (Breakout Origin).
Current Phase: Bullish Continuation / High-Level Consolidation following a structural trendline break.
● Technical Confluence Analysis The chart exhibits a definitive structural reversal characterized by a high-momentum breakout above the descending trendline anchored between points and . The indicator has triggered a synchronous "BC" (Breakout Candle) signal and a bullish "CHOCH" (Change of Character), validating the shift from bearish correction to bullish impulse. Price action has successfully cleared the primary objective (Target 1) and established a preliminary support floor above this level. The current consolidation between T1 and the local highs suggests a liquidity absorption phase rather than exhaustion. The vertical projection lines (T1, T2, T3) indicate an extended volatility expansion is expected, with the price currently stabilizing before a potential attempt at Target 2. The absence of immediate bearish rejection candles at the T1 flip zone reinforces the strength of the breakout.
● Analytical Conclusion
Directional Bias: Bullish Continuation. Invalidation Point: A sustained close below 4,475 would compromise the breakout structure and reintroduce the price into the previous bearish channel.
📜 Executive Conclusion
The market currently presents a technical dichotomy: a valid macro structural breakout conflicting with immediate momentum deterioration.
While the Trend Break analysis confirms a bullish impulse with objectives cleared above 4,400, data from the Volume Profile and Money Flow Oscillator suggests the rally is stalling. The "Buyer Exhaustion" signal at 4,640, combined with bearish flow divergence (sub-50 reading), indicates institutional distribution is actively capping upside potential.
• Final Verdict: Macro Bullish / Near-Term Cautious.
The market has likely transitioned from an impulsive phase to a period of inventory correction. Traders should anticipate consolidation or a mean reversion toward the 4,604 (POC) to 4,570 support zones. The macro bullish thesis remains intact unless price sustains a breakdown below 4,427, while a close above 4,645 is required to reignite the impulsive trend.
⚠️ Disclaimer
All provided scripts and indicators are strictly for educational exploration and must not be interpreted as financial advice or a recommendation to execute trades. I expressly disclaim all liability for any financial losses or damages that may result, directly or indirectly, from the reliance on or application of these tools. Market participation carries inherent risk where past performance never guarantees future returns, leaving all investment decisions and due diligence solely at your own discretion.
Xauanalysis

Analysis Gold (XAUUSD) 4-hour timeframe● Analysis The chart displays Gold (XAUUSD) on a 4-hour timeframe, exhibiting a clearly defined bullish market structure based on the " Hybrid Smart Money Concepts " indicator logic.
The primary trend shift is confirmed by the green "CHoCH" (Change of Character) dashed line and label , which triggered when price closed above the previous significant swing high. This structural break validated the transition to an uptrend.
• Gap Analysis Following the CHoCH, the indicator identified a blue "BREAKAWAY" gap. This classification occurs specifically because the gap coincided with the structural breakout (the CHoCH event). As the trend progressed, multiple orange "RUNAWAY" gaps formed. These signals indicate strong continuation momentum, characterized by high volume but lacking the trend maturity required to be classified as exhaustion gaps at that specific moment. The persistence of these boxes indicates they have not yet been "mitigated" (price has not retraced to the gap's midpoint), serving as potential support zones.
• Order Blocks and Exhaustion Large green Order Blocks (OB) are visible below the current price action. These boxes represent the specific candles responsible for initiating the impulsive moves that broke structure, acting as valid demand zones for future retracements. Conversely, the upper wicks feature red "BE" (Buyer Exhaustion) labels. These signals are generated by the script's "Stress Model," indicating that price has statistically overextended (greater than 2 sigma deviation) relative to volatility-adjusted impact and is trading above the trend baseline. While these suggest short-term overextension, the underlying market structure remains bullish.
● Analysis The chart presents a technical reading of Gold (XAUUSD) using the " Smart Money Flow Oscillator " in "In/Out" mode.
The analysis reveals a strong bullish continuation trend that is currently testing overbought conditions.
• Market Sentiment (In/Out Ratio) The primary oscillator is tracking the "In/Out Ratio," calculated as the percentage of total volume classified as buying inflow over the lookback period. The current value is 72.55, which is significantly above the 50.0 neutral baseline and has breached the 70.0 "Overbought" threshold (indicated by the upper dashed line). This signifies that buying pressure is dominating the order flow, driving the impulsive price rally seen on the chart. The green "Cloud" fill indicates the ratio is trading above its signal line (SMA), confirming sustained positive momentum.
• Structural Signal: Hidden Bullish Divergence The most critical technical signal present is the Hidden Bullish Divergence, marked by the green "H" label and dashed line below the oscillator. Detection Logic: The script detected that Price made a Higher Low (indicating uptrend structure) while the Oscillator made a Lower Low (indicating a deep retracement in momentum). Implication: This pattern typically signals that the pullback was technical rather than structural. The oscillator successfully "reset" to the oversold zone (near the 30 level) while price maintained its bullish structure, providing the fuel for the subsequent breakout.
• Dashboard & Efficiency Metrics The dashboard highlights a divergence between immediate price action and the broader trend: Efficiency (1.95x): The efficiency multiplier is nearly double the average (capped at 2.0). This suggests that recent price movement has been highly "efficient," achieving significant range with relatively less volume resistance, a hallmark of institutional liquidity voids. Net Flow (-409.698M): Despite the bullish ratio, the immediate "Net Flow" is negative (Red). This is triggered because the current candle's close change exceeded the bearish volatility threshold (is_strong_down), flagging immediate short-term profit-taking or selling pressure at this local top.
● Analysis
The chart for Gold (XAUUSD) on the 4-hour timeframe exhibits a distinct bullish market structure as defined by the " Accumulative Swing Cloud " indicator logic.
• Trend Identification The market is currently in a strong uptrend. This is evidenced by the "Cloud Fill" appearing in a bright green gradient. According to the script, this specific coloration triggers only when the Fast Moving Average of the ASI is positioned above the Slow Moving Average. The width of the cloud is visually significant, indicating a high disparity between the fast and slow averages, which the code interprets as high trend intensity via its dynamic gradient logic.
• Momentum Assessment The Accumulative Swing Index (ASI) line (displayed in teal) is trending well above the grey Signal Line. The update method in the code calculates this value based on closing price swings relative to the daily limit and volatility. The current separation between the ASI line and the Signal Line confirms that immediate bullish momentum is outpacing the longer-term average. The bar coloring on the main chart is also green.
• Signal Status There are no active bearish reversal signals visible at the hard right edge of the chart. A "Sell Signal" would require the ASI line to cross under the Signal Line, which has not occurred. Instead, the most recent interaction was a bullish crossover (visible earlier in the trend), and the subsequent price action has maintained the ASI's position above the signal threshold. The slight flattening of the ASI line at the very peak suggests a minor pause in accumulation, but the structural integrity of the bullish cloud remains intact.
⚠️ Disclaimer
All provided scripts and indicators are strictly for educational exploration and must not be interpreted as financial advice or a recommendation to execute trades. I expressly disclaim all liability for any financial losses or damages that may result, directly or indirectly, from the reliance on or application of these tools. Market participation carries inherent risk where past performance never guarantees future returns, leaving all investment decisions and due diligence solely at your own discretion.

XAU - Potential False Breakout Before Correction in Bearish FlagI expect a move toward the upper boundary of the bearish flag, with a possible false breakout before the market begins a deeper correction.
Upside targets are $4,450–$4,500, while the potential downside correction zone lies around $3,850–$3,800.

XAUUSD (Gold) – Educational Trade Setup With Levels📊 XAUUSD (Gold) – Educational Trade Setup With Levels
Analysis by: GOLD PIPS HUNTER
This analysis highlights a potential bullish reversal setup on Gold using demand & supply zones, liquidity concepts, and market structure. Price is approaching a key support area where buyers may step in again.
🔍 Key Levels & Zones
🟢 Demand Zone (Buy Area)
Price Range: $4,204 – $4,208
This zone has shown strong buying pressure before. If the price returns to this area and shows a bullish reaction, it can provide a high-quality long opportunity.
🟣 Liquidity Grab Area
Price Range: $4,198 – $4,203
Price may briefly sweep into this region to collect liquidity before reversing upward. This sweep improves the probability of a strong bullish move.
🔴 Confirmation Needed
Wait for:
Bullish rejection from the demand zone
Break of minor structure to the upside
This increases the accuracy of the trade.
🟩 Target / Supply Zone
Price Range: $4,238 – $4,244
This is the previous supply area where price strongly rejected. It serves as the ideal target for the buy setup.

XAUUSD 1H Detailed Analysis – GOLD PIPS HUNTERGold (XAUUSD) is currently reacting strongly from the Key Support Area, which has been highlighted on the chart. This zone has previously acted as a demand region where buyers stepped in and pushed the price upward.
🔹 Market Structure Overview
Price recently tapped into the support zone and showed a clear bullish reaction.
The current pullback looks healthy and is forming a higher-low structure, indicating buyers are still active.
Volume is rising at the lows, suggesting accumulation rather than selling pressure.
🔹 Expected Move (1H Structure)
Based on the clean bounce from support and maintained bullish structure:
A potential retest of support may occur before continuation.
If the structure holds, price could push toward the blue dashed resistance zone.
A breakout above this zone could trigger a strong bullish continuation move.
🔹 Key Levels to Watch
📍 Support Zone (Demand Area):
This is the main area keeping Gold bullish.
If price remains above, buyers will likely dominate.
📍 Resistance (Breakout Zone):
A close above the dashed level may lead to:
New higher highs
Strong upside momentum
Breakout retest setups
🔹 Educational Note
This chart is a perfect example of:
Support–Resistance strategy
Market structure following HL → HH pattern
Breakout anticipation trading setup
Always wait for confirmation before entering—never predict, always react.

XAUUSD 4H Range Analysis – Key Levels to WatchGold is currently trading inside a clear range zone, where price is respecting both the upper supply boundary and the lower demand boundary. This kind of sideways movement usually builds liquidity before a bigger breakout.
🔹 Key Observations:
Price continues to react inside the pink range zone, creating higher lows and lower highs — a classic sign of market compression.
Multiple wicks at the bottom show buyers protecting the lower demand zone.
The structure is forming a series of swing highs and swing lows, indicating indecision but also energy buildup.
🔹 Levels to Watch:
Demand Zone: Strong buy interest around the lower pink region. As long as this level holds, buyers can push price back up.
Range High: If price breaks above the upper boundary, a clean bullish continuation move can be expected.
Range Low: A break below this area may open the door for a deeper correction.
📈 Expected Movement:
If buyers defend the bottom zone again, Gold may continue to form higher lows and push toward the top of the range, potentially breaking out for a bullish continuation.
Patience is key — let the market choose direction, and trade based on confirmation.

Gold BUYI expect a gold buy trade after marker had motive and retraced to demand zone and started to create another motive.

XAU/USD | Double Bottom → Breakout Retest → Clear Path for Bulls🧭 Market Overview
Gold has transitioned beautifully from a bearish liquidation phase into a clean bullish breakout structure.
This chart walks through each stage of the cycle — Accumulation → Breakout → Retest → Expansion — all clearly mapped for educational insight.
After sellers exhausted around $3,940–$3,960, Gold printed a textbook Double Bottom reversal.
Once price broke and closed above the neckline at $4,120, the structure flipped bullish — and now we’re in the Breakout Retesting phase.
🧩 Step-by-Step Breakdown of Chart Markings
🔶 1️⃣ “Clear Path for Bulls” – Liquidity Void Zone
The “Clear Path for Bulls” zone highlights a previous inefficient drop — an area with minimal resistance.
When price re-enters this void, momentum often accelerates, creating strong bullish continuation.
This is why above $4,120, price faces little friction until the next supply zone.
🟩 2️⃣ “Double Bottom” – Structure Base
Formed near $3,940–$3,960, this marks the liquidity sweep and accumulation base.
The second bottom confirms buyer presence and sets the neckline at $4,120.
That neckline is now acting as support, exactly where price is retesting today.
Below it? Only a liquidity pocket — thin structure, fast moves.
⚙️ 3️⃣ “Breakout Retesting” – Confirmation Phase
The “Breakout Retesting” zone illustrates a healthy technical pullback.
This retest confirms structure integrity, shakes out weak hands, and attracts institutional liquidity.
As long as $4,100–$4,120 holds, bulls maintain full control.
🔴 4️⃣ “Invalidation Point” – Structural Risk Line
The red-labeled “Invalidation Point” defines where the bullish thesis fails: a 4H close below $4,080.
This is the cutoff level protecting traders from a failed breakout.
The red projection (−4.11%, −168 pts) visualizes the probable liquidity sweep back toward $3,940.
🟢 5️⃣ “215.25 (5.20%) → 21,525” – Bullish Projection
This is the measured-move projection from the Double Bottom’s height.
It targets a 5.20% upside move into $4,360–$4,380, which aligns with the next liquidity/supply zone.
Simple, technical, and logical — structure-based profit zone.
⚫ 6️⃣ “−168.31 (−4.11%)” – Bearish Counterpath
A failed retest would likely send price down into the liquidity pocket again.
This highlights the importance of invalidation — clear risk awareness before execution.
Great visual lesson on maintaining reward-to-risk balance.
🟩 Bullish Case
✅ Hold above $4,120 confirms breakout integrity
🎯 Target 1 → $4,280
🎯 Target 2 → $4,360–$4,380
⚡ “Clear Path for Bulls” offers minimal resistance
🟥 Bearish Case
⚠️ Close below $4,080 invalidates breakout
📉 Expect liquidity grab toward $3,940–$3,960
💧 Reaccumulation likely before next attempt higher
🧠 Educational Insights
Structure builds sentiment — price respects zones, not opinions.
Breakout Retests validate structure; they’re not reversals.
Invalidation Points = professional discipline.
Measured Moves project liquidity targets, not guarantees.
Liquidity Voids show potential acceleration zones — trade them with structure.
💬 Trade Summary
Bias Above / Below Targets Risk Structure
🟩 Bullish Above $4,120 $4,280 → $4,380 Below $4,080 Double Bottom + Retest
🟥 Bearish Below $4,080 $3,940 Invalidation Liquidity Sweep Setup
🧩 Final Thoughts
Gold is now retesting its breakout structure — a key moment for confirmation.
Holding $4,120 keeps bulls in command toward $4,380, while losing it could trigger a −4% liquidity sweep before the next buildup.
This move is a clean visual example of:
Liquidity → Structure → Confirmation → Expansion
Stay patient, stay structured, and trade confirmations — not assumptions. 📚✨
📢 Community Discussion
What’s your bias on Gold here?
🟩 Holding above $4,120 for the bullish continuation, or 🟥 expecting a retest failure toward $3,940?
Share your thoughts 👇

WEEKLY MARKET ANALYSIS-DXY, BTC,ETH, NAS100,SPX,XAU,XAGThis weekend's analysis will cover the Dollar Index, Bitcoin, Ethereum, NAS100, SPX500, Gold and Silver.
The DXY has found a strong support on both the monthly and daily charts. DXY has officially also broken it's weekly closing resistance level and I think a shift in momentum will propel DXY up higher in the next week towards a target zone of 99 to 99.600.
Bitcoin is still in a correction and currently paused on the weekly 21 EMA, I think it's consolidating sideways and will continue selling to the intended target of $102k in the coming week.
ETH nicely came to the previous resistance and seems to find some buyers there but there is no momentum or RSI strength to support an upward move, so I am bearish on ETH and think the price will fall some more into the target zone below $3,823.
NAS100 and SPX500 are also looking quite over stretch on it's Bollinger Bands and KC channels on the weekly charts, with weekly bearish candles suggesting a pullback in the equities is very likely in the next coming week.
Gold and Silver are in a strong uptrend and the uptrend will continue but I see profit taking on the charts. I expect some sideways consolidation and a minor pullback before the bullish continuation.
I thank you for listening to my publications and I wish you a great trading week. Cheers everybody!!

$3,331 Support Under Siege — Is Gold About to Crash?Price has been trending lower since the left side of the chart, shifting from a distribution top into a sequence of lower highs and lower lows. After the failed rally into the mid-chart, sellers re-asserted control and the market is now compressing under a local supply shelf. The last several candles hover around ~3,338 with shallow bounces and repeated rejections—typical of a market leaning heavy into support rather than springing from it.
The key battleground is the 3,331 zone (two green dotted prints around 3,331.17 / 3,329.85). It has acted as a base multiple times, but every touch is coming from lower highs, which increases the odds of a breakdown. Beneath that, a clean air pocket runs to 3,301.28–3,301.77 (next green level), and if momentum extends, the measured downside points toward 3,268.12 at the bottom of your map. On the topside, supply stacks up tightly: intraday cap at 3,355.98–3,360.00, then higher resistance shelves at 3,374.81, 3,390.60, and 3,409.43 (all marked with red dotted lines). The clustering of red “S” markers around the 3,355–3,375 area reinforces that zone as distribution/sell interest.
Market structure confirms the bearish bias: each rally attempt is getting sold earlier (progressively lower swing highs near ~3,360 → ~3,350), while the base at 3,331 is getting probed more often. That’s classic compression into support. The small-bodied candles near current price show lack of aggressive buying; wicks on the upside into ~3,345–3,355 keep getting faded. The green “B” markers that appeared on recent dips have not driven a higher high, which weakens their signal and suggests they’re catching falling knives inside a down-structure.
A quick invalidation map helps frame risk: any 1H close back above 3,360 would neutralize the immediate short idea and expose a squeeze toward 3,374.8, and only then would 3,390.6 → 3,409.4 come back into play. Until that reclaim, the path of least resistance remains down, with liquidity likely resting below 3,329–3,331.
Trade Setup (bearish)
• Option A — Breakdown Play: Sell the decisive break and 1H close below 3,331, or short a retest of 3,331–3,334 from underneath. Stop: above 3,356–3,360 supply. Targets: 3,301 first, stretch to 3,268 if momentum persists.
• Option B — Fade the Rally: If price bounces into 3,352–3,360 supply, look for rejection wicks to short. Stop: above 3,374.8 (next resistance shelf). Targets: 3,331 initial, then 3,301; leave a runner toward 3,268.
Risk notes: avoid chasing the very first tick below 3,331—gold often does a quick sweep before the real move. If a sweep below 3,331 snaps back inside the range and closes above the level, step aside; that’s a trap. Once the first target is hit, consider taking partial profits and trail the stop above the most recent 1H lower high to stay aligned with the down-trend. Economic calendar icons on the chart suggest upcoming USD events—expect spikes; keep sizing modest until after prints.

GOLD clear sightDear all my friends wish you bests.
1. We have strong trading range in Daily and 4H this mean market can move up and down anytime and grab liquidity.
2. Analyzing waves going to show there is a downtrend structure as correction but if you look it in weekly its always upward for gold.
3. as market couldnt pass 3452 its going to 3152
if you trade daily careful market moves extremly crazy as we have big trading range in daily.
"IT'S JUST GOOD BUSINESS"

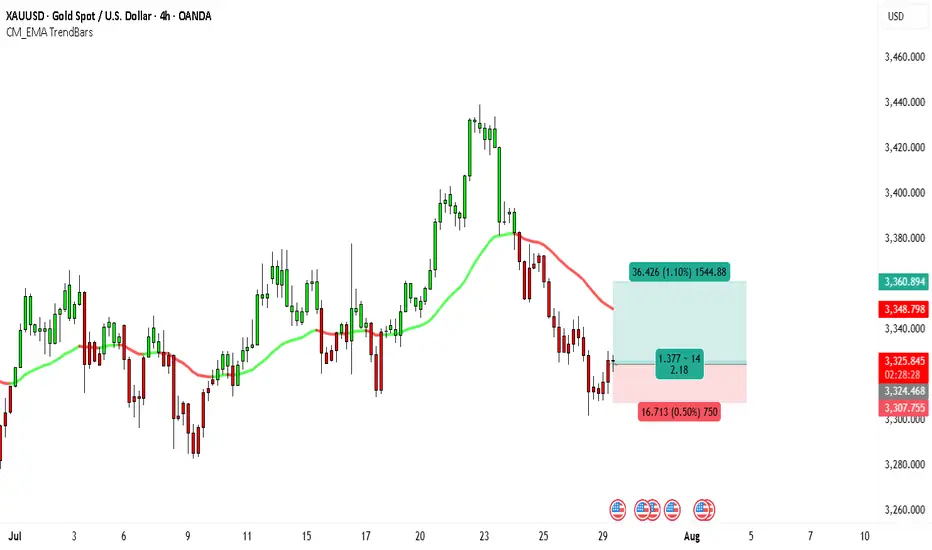
Gold Eyes $3,360 — Is This the Next Breakout?Looking at the 4H chart of XAUUSD, the price appears to be stabilizing after a period of decline, with selling pressure showing signs of exhaustion. The recent candles have smaller bodies, reflecting indecision from sellers and potential accumulation from buyers. Price is holding above the key horizontal support zone around 3,307–3,324, an area that has acted as a strong demand zone in the past. Each time the market dipped into this region, buyers stepped in, which gives the current structure a bullish undertone.
The EMA from your CM EMA TrendBars indicator has flattened out after a downward slope, suggesting that bearish momentum is losing strength. Price is also attempting to retest above this EMA, which, if achieved and maintained, could trigger further buying interest. This aligns with a possible short-term double-bottom pattern forming around 3,307, a common reversal setup if confirmed by a break above nearby resistance levels.
On the broader scale, gold has been in an overall macro uptrend for months. This recent weakness on the 4H chart could simply be a corrective pullback before another leg higher, rather than the start of a prolonged downtrend. If bulls can reclaim the EMA and hold above 3,348, the upside potential opens toward the 3,360 area and potentially higher.
Trading Setup
• Entry: Around 3,324.90
• Target: 3,360.89 (+1.10% / +36.4 USD)
• Stop Loss: 3,307.75 (-0.50% / -16.7 USD)
• Risk-to-Reward Ratio: ≈ 2.18
This setup offers more than double the potential reward compared to the risk, which fits well with a bullish bias. A decisive close above the EMA would serve as further confirmation for the trade.
XAU/USD 23 May 2025 Intraday AnalysisH4 Analysis:
-> Swing: Bullish.
-> Internal: Bullish.
Analysis and bias remains the same as analysis dated 23 April 2025
Price has now printed a bearish CHoCH according to my analysis yesterday.
Price is now trading within an established internal range.
Intraday Expectation:
Price to trade down to either discount of internal 50% EQ, or H4 demand zone before targeting weak internal high priced at 3,500.200.
Note:
The Federal Reserve’s sustained dovish stance, coupled with ongoing geopolitical uncertainties, is likely to prolong heightened volatility in the gold market. Given this elevated risk environment, traders should exercise caution and recalibrate risk management strategies to navigate potential price fluctuations effectively.
Additionally, gold pricing remains sensitive to broader macroeconomic developments, including policy decisions under President Trump. Shifts in geopolitical strategy and economic directives could further amplify uncertainty, contributing to market repricing dynamics.
H4 Chart:
M15 Analysis:
-> Swing: Bullish.
-> Internal: Bearish.
Analysis and bias remains the same as yesterday's analysis dated 22 May 2025.
In my analysis from 12 May 2025, I noted that price had yet to target the weak internal high, including on the H4 timeframe. This aligns with the ongoing corrective bearish pullback across higher timeframes, so a bearish internal Break of Structure (iBOS) was a likely outcome.
As anticipated, price targeted strong internal low, confirming a bearish iBOS.
Price has remained within the internal range for an extended period and has yet to target the weak internal low. A contributing factor could be the bullish nature of the H4 timeframe's internal range, which has reacted from a discounted level at 50% of the internal equilibrium (EQ).
Intraday Expectation:
Technically price to continue bullish, react at either premium of internal 50% EQ or M15 demand zone before targeting weak internal low priced at 3,120.765.
Alternative scenario:
Price can be seen to be reacting at discount of 50% EQ on H4 timeframe, therefore, it is a viable alternative that price could potentially print a bullish iBOS on M15 timeframe.
Note:
Gold remains highly volatile amid the Federal Reserve's continued dovish stance and persistent geopolitical uncertainties. Traders should implement robust risk management strategies and remain vigilant, as price swings may become more pronounced in this elevated volatility environment.
Additionally, President Trump’s recent tariff announcements are expected to further amplify market turbulence, potentially triggering sharp price fluctuations and whipsaws.
M15 Chart:

Gold Pullback Incoming!Gold has struggled to break through its daily highs for the past week. I am looking for another push up to the $3360-$3370 range. If it fails to break that level again, we may see support levels around $3200 being retested. In my opinion, there is even potential for it to go lower. I'd love to hear your thoughts in the comments!
*Side note:* With the U.S. dollar falling in value and ongoing economic uncertainty, I believe gold has tremendous upside potential over the next 12-18 months. FX:XAUUSD

XAU/USD 06 May 2025 Intraday AnalysisH4 Analysis:
-> Swing: Bullish.
-> Internal: Bullish.
Analysis and bias remains the same as analysis dated 23 April 2025
Price has now printed a bearish CHoCH according to my analysis yesterday.
Price is now trading within an established internal range.
Intraday Expectation:
Price to trade down to either discount of internal 50% EQ, or H4 demand zone before targeting weak internal high priced at 3,500.200.
Note:
With the Federal Reserve's dovish stance and persisting geopolitical uncertainties, heightened volatility in Gold is expected to continue. Traders should proceed with caution and adjust risk management strategies in this high-volatility environment.
Price could also be driven by President Trump's policies, geopolitical moves and economic decisions which are sparking uncertainty.
H4 Chart:
M15 Analysis:
-> Swing: Bullish.
-> Internal: Bearish.
Price did not print according to previous analysis by failing to target weak internal low.
Price has now printed a bullish iBOS. This is potentially due to the fact that H4 TF was in a bearish pullback phase and reacted at discount of 50% internal EQ which could mean that H4 TF bearish pullback phase is now over and targeting the weak internal high, which is mentioned in H4 analysis.
Price has also printed a bearish CHoCH which indicates, but not confirms bearish pullback phase initiation.
Price is now trading within an established internal range, however, I will continue to monitor depth of pullback.
Intraday Expectation:
Price to trade down to either discount of internal 50% EQ, or M15 supply zones before targeting weak internal high priced at
Note:
With the Federal Reserve maintaining a dovish stance and ongoing geopolitical tensions, volatility in Gold prices is expected to remain elevated. Traders should exercise caution, adjust risk management strategies, and stay prepared for potential price whipsaws in this high-volatility environment.
Trump's tariff announcement will most likely cause considerably increased volatility and whipsaws.
M15 Chart:

GOLD Long Trade Idea | Buying Zone: 3197–3216 | Trend Reversal Gold is currently approaching a key buying zone between 3197 and 3216, where buyers are likely to step in. This zone has previously acted as a strong support level, and signs of a trend reversal or continuation could emerge from here.
🔑 Trade Setup:
Buying Zone: 3197–3216
Potential Upside Targets:
Target 1: 3245
Target 2: 3275
Stop Loss: Below 3180 (as per your risk appetite)
Trend: Bullish bias above support
Indicators: Look for bullish candlestick patterns or RSI bounce from oversold area
This zone is critical—watch closely for confirmation before entering. Ideal for swing traders looking for a low-risk entry.
This is a trade idea, not financial advice. Always do your own analysis.

XAU/USD 04 April 2025 Intraday AnalysisH4 Analysis:
-> Swing: Bullish.
-> Internal: Bullish.
Since last analysis price has printed a bearish CHoCH which is the first indication, but not confirmation of bearish pullback phase initiation.
Price is now trading within an established internal range.
Intraday Expectation:
Price to trade down to either discount of internal 50% EQ, or H4 demand zone before targeting weak internal high priced at 3,187,835
Note:
With the Federal Reserve's dovish stance and persisting geopolitical uncertainties, heightened volatility in Gold is expected to continue. Traders should proceed with caution and adjust risk management strategies in this high-volatility environment.
Price could also be driven by President Trump's policies, geopolitical moves and economic decisions which are sparking uncertainty.
H4 Chart:
M15 Analysis:
-> Swing: Bullish.
-> Internal: Bearish.
Price has printed as per yesterday's alternative scenario whereby price has printed a bearish iBOS due to H4 TF being in, although not as yet confirmed, in bearish pullback phase.
Intraday Expectation:
Price has already traded up to premium of internal 50% EQ, therefore, price to target weak internal low priced at
Note:
With the Federal Reserve maintaining a dovish stance and ongoing geopolitical tensions, volatility in Gold prices is expected to remain elevated. Traders should exercise caution, adjust risk management strategies, and stay prepared for potential price whipsaws in this high-volatility environment.
Trump's tariff announcement will most likely cause considerably increased volatility and whipsaws.
M15 Chart:

XAU/USD 21 February 2025 Intraday AnalysisH4 Analysis:
-> Swing: Bullish.
-> Internal: Bullish.
Price printed as per yesterday's analysis and bias.
Price has printed a bearish CHocH indicating, but not confirming bearish pullback phase initiation.
Price is now trading within an established internal range.
Intraday Expectation:
Price to trade down to either discount of 50% internal EQ, or H4 demand zone before targeting weak internal high, priced at 2,954.955
Alternative scenario:
Given HTF (Daily and Weekly) have also printed bullish iBOS' it would not come as a surprise if price printed a bearish iBOS.
Note:
With the Federal Reserve's dovish stance and persisting geopolitical uncertainties, heightened volatility in Gold is expected to continue. Traders should proceed with caution and adjust risk management strategies in this high-volatility environment.
Price could also be driven by President Trump's policies, geopolitical moves and economic decisions which are sparking uncertainty.
H4 Chart:
M15 Analysis:
-> Swing: Bullish.
-> Internal: Bullish.
Price printed as per yesterday's analysis and bias.
Price is now trading within an established internal range.
You will note my comments in yesterday's analysis whereby I mentioned that as we await for H4 TF to confirm bearish pullback phase initiation, it would be a realistic expectation for price to print a bearish iBOS.
This scenario seems underway, price has targeted strong internal low, however, price has, thus far, not been able to close below.
Intraday Expectation:
Technically price should target weak internal high priced at 2,954.955, however, my alternative scenario remains live.
Alternative scenario:
As we await for H4 TF to confirm bearish pullback phase initiation, it would be a realistic expectation for price to print a bearish iBOS.
Note:
With the Federal Reserve maintaining a dovish stance and ongoing geopolitical tensions, volatility in Gold prices is expected to remain elevated. Traders should exercise caution, adjust risk management strategies, and stay prepared for potential price whipsaws in this high-volatility environment.
M15 Chart:

XAUUSD 4H (anticipating) Breakout Trade: Buy‐Stop Why This Zone?
If gold breaks and closes above ~2,770–2,775, it suggests bullish continuation toward 2,780–2,800 or more.
Possible Setup
Type: Buy Stop at ~2,775 (anticipating a breakout)
Stop‐Loss: ~2,750–2,760
The idea is to keep stops relatively tight if the breakout fails.
Take‐Profit Targets:
~2,790–2,800 (a 15–25 point run above your entry).
If momentum is strong, a secondary target near 2,830 (the 2.618 Fib extension) is possible.
Summary “Big Picture” Outlook
Daily Trend: Bullish, with price above the 50 and 200 EMAs. MACD is still positive.
Key Near‐Term Resistance: 2,763–2,770; a breakout could extend toward 2,800 and potentially 2,830.
Key Pullback Supports:
2,730–2,740 (4H FVG & VAH)
2,710 (PoC)
2,680–2,690 (4H 200 EMA / deeper volume node).
Volume Profile: Confirms strong participation around 2,700–2,730, suggesting a robust support band in that area.
Momentum Indicators: Short‐term MACD (1H, 4H) is cooling but not definitively bearish. The daily timeframe remains positive, so short‐term dips may be bought until proven otherwise.
Important: this is not personalized financial advice. It’s an illustration of how one might combine risk management principles with the support/resistance zones in play.
Final Note & Disclaimer
All market scenarios carry probabilities, not certainties. Technical signals are best combined with macro fundamentals (e.g., interest rates, USD behavior, geopolitical risks) to form a well‐rounded market view. This consolidated analysis serves an educational purpose—always do additional research or consult a licensed professional before making trading or investment decisions.

Gold's Potential Movememt in 2025Here is the detailed technical analysis of OANDA:XAUUSD
1. Key Levels and Chart Structure
- Resistance Zones (red boxes): There is a significant resistance zone highlighted around $2,720–$2,740. This is an area where the price has previously struggled to break through, indicating strong selling pressure or profit-taking.
- Support Zones (green boxes): The key support levels are marked near $2,580–$2,600. This area has been tested multiple times in the past, showing buyers stepping in and defending this zone.
2. Chart Pattern
- Symmetrical Triangle: The white lines outline a symmetrical triangle pattern. This indicates consolidation and a potential breakout, either upwards or downwards, as the price nears the apex of the triangle. Triangles often lead to sharp price movements as traders anticipate a resolution.
3. Potential Scenarios
Scenario 1: Bullish Breakout (green path)
- If the price breaks above the resistance zone near $2,720, we could see a bullish rally.
- The price might retest the breakout level before heading higher towards $2,760–$2,800. This aligns with the continuation of the prevailing uptrend from earlier in the chart.
- A breakout above the symmetrical triangle would signal strong buying momentum, supported by increasing volume during the breakout.
Scenario 2: Bearish Breakdown (red path)
- If the price fails to hold the triangle's lower boundary and the key support zone near $2,580, a bearish breakdown is likely.
- This could lead to a sharp decline, targeting levels around $2,520 and potentially further towards $2,480.
- Such a move could be triggered by strong selling pressure or macroeconomic factors unfavorable to gold, such as a strengthening U.S. dollar or rising bond yields.
4. Volume Analysis
- The volume seems to be decreasing as the price moves within the triangle, which is typical for such consolidation patterns. A significant increase in volume during the breakout or breakdown would confirm the direction of the move.
5. Trading Implications
- For a bullish breakout, traders might consider entering long positions above $2,720 with stops below the triangle and targeting $2,760 or higher.
- For a bearish breakdown, short positions could be initiated below $2,580, with stops above the triangle and targets near $2,520 or lower.
- Risk management is essential, especially in volatile market conditions like this.
This analysis is based purely on the technical chart setup and does not account for any fundamental factors or news events that could influence gold prices. It would be wise to monitor any upcoming economic reports or geopolitical developments that might impact gold's movement.

GOLD Next Move (wait for the perfect entry)TVC:GOLD Now the price must settle above 2637 to reach our resistance area which is 2660 for an ideal entry and then it will drop to the next target which are 2611 and 2583.

XAU/USD 14 October 2024 Intraday AnalysisH4 Analysis:
-> Swing: Bullish.
-> Internal: Bearish.
Analysis/Bias remains the same as analysis dated 13 October 2024.
As mentioned in my analysis dated 09 October 2024, price could print lower to bring CHoCH positioning closer to current price action, as the previous CHoCH positioning was quite distant. This is exactly how price has moved.
Price is currently positioned in the premium above the 50% equilibrium (EQ).
Intraday Expectation: Price is expected to react at the premium of the 50% EQ or H4 supply zone before targeting weak internal low.
I advise caution due to ongoing geopolitical tensions and the Fed's dovish stance. However, we will remain systematic in our approach.
H4 Chart:
M15 Analysis:
-> Swing: Bullish.
-> Internal: Bullish.
Following last week's bearish iBOS, price did not target weak internal low with price printing bullish iBOS.
This is in line with H4 bullish pullback phase.
We are now trading within an internal low and fractal high.
Should price print bearish CHoCH we would have a confirmed internal range which will be significantly narrower than previous internal ranges.
Intraday Expectation: Price is expected to print a bearish CHoCH, indicating the initiation of bearish pullback phase. Bearish CHoCH positioning is marked with a blue dotted line.
Systematically price should either react at discount of 50% EQ or M15 demand level to target weak internal high, however, due to significant narrowing of the internal range, coupled with the fact that price is in premium of 50% EQ of the H4 internal range, I would not be surpised if price printed a bearish iBOS.
M15 Analysis:

XAU/USD 09 October 2024 Intraday AnalysisH4 Analysis:
-> Swing: Bullish.
-> Internal: Bearish.
Analysis dated 06 October 2024 was accurate, with price targeting the weak internal low and printing a bearish iBOS.
We are now trading between an internal high and fractal low.
CHoCH positioning is still quite a distance from current price, so it’s possible that price may print new lows to bring CHoCH closer to current price.
Intraday Expectation: Price is expected to print a bullish CHoCH to indicate the initiation of a bullish pullback phase, keeping the above scenario in mind.
I advise caution due to ongoing geopolitical tensions and the Fed's dovish stance. However, we will remain systematic in our approach.
H4 Chart:
M15 Analysis:
-> Swing: Bullish.
-> Internal: Bearish.
Yesterday's analysis (08 October 2024) was accurate, with price pulling back, printing a bullish Change of Character (CHoCH), reacting at the premium of the 50% internal equilibrium (EQ), and then targeting weak internal low, ultimately printing a bearish iBOS.
We are now trading between an internal high and fractal low.
Intraday Expectation: Price is expected to print a bullish CHoCH, indicating the initiation of a bullish pullback phase. Bullish CHoCH positioning is marked with a blue dotted line.
Price is likely to react at the premium of the 50% EQ or the M15 supply zone before targeting the weak internal low.
M15 Chart:
