Gold (AUD) daily- Ascendin' Broadenin' Wedge(ABW) inside anotherGold (AUD) daily- Ascendin' Broadenin' Wedge(ABW) inside another ABW!
GOLD/AUD


Gold (AUD) daily- Clear breakout from Ascendin' Broaden' WedgeGold (AUD) daily- Clear downward breakout from Ascending' Broadening Wedge (ABW). Price target is horizontal red line. Temporary relief at purple UpTrend line.
Regarding the 52% of ABW that break out downwards. 81% of those act as Reversals of the prevailing trend- Thomas Bulkowski.
thepatternsite.com

Gold (AUD) daily- Downward breakout from Ascend' Broaden' Wedge.Gold (AUD) daily- Downward breakout from Ascendening Broadening Wedge (ABW).
81% of AWB breakouts occurs in the direction leading up to the ABW. However, this is that 19% of cases.
Note: We are at Oversold RSI's under 30. History shows, when the RSI hits these levels, usually prices bounce back up.

GOLD IS MELTINGIf we can see an hourly candle close below 1693, we are on a road trip down to the 1675 mark. Good economic news confirmed yesterday & today resulting in big dogs selling their gold and investing their money back into currencies now the Covid-19 uncertainties are past the worst. It truly has become a bear's market.

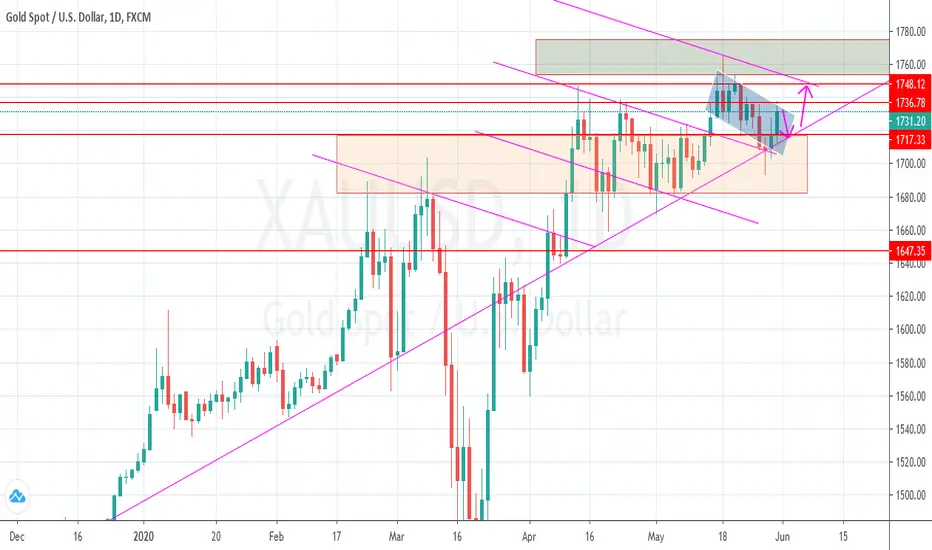
Gold against Dollar, XAUUSD weekly analysis from June 1 to 5Weekly chart suggest a bullish week with a long tail pinbar at the Ist week of June, may the bulls take control on wednesday before the price retest the area of 1720, and push the price higher to 1748 area ..where it finds the resistance zone at 1751 area and may bring the price down to 1738.. it may the roller coaster experience this week on price action for Gold.
Note - Analysis based on Technical aspect, it may subjected to differs when fundamentals involves...
Gold (AUD) daily chart-Symmetrical triangl's,Ascend/Fallin'WedgeGold (AUD) daily. Symmetrical, ascending, fallin' wedges. However, bullish uptrend intact.
With unprecedented Unlimited Fed QE , expect a big rally in Gold and Silver over the next 3 years (as occurred after the great Fed QE from 2008-11).

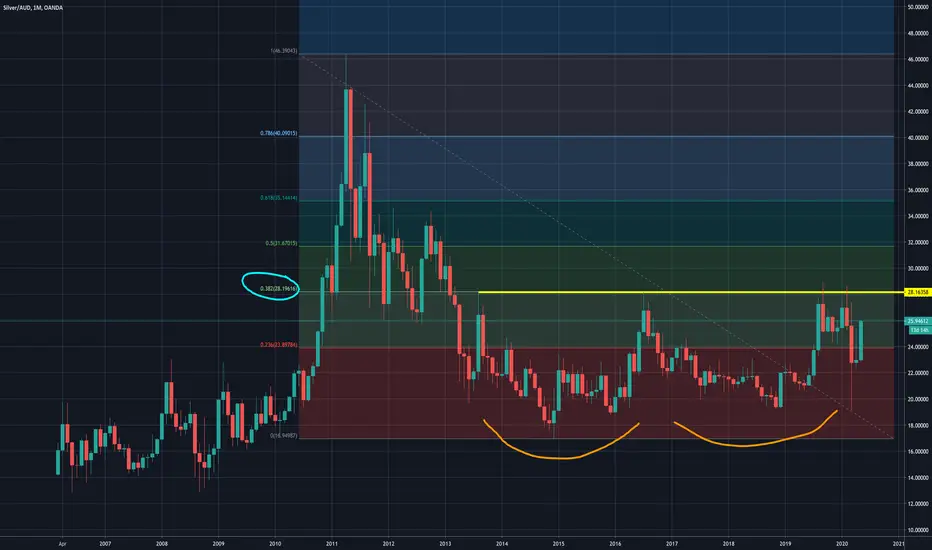
Silver (AUD)- Monthly chart. Forming Double bottom.Silver (AUD)- Monthly chart. Potentially forming a Double bottom.
Note over head resistance (yellow line)- 4 failed previous attempts.
Yellow line also coincides with 38.2% Fib retracement from the 2011 highs. So a very important line to break to complete Double bottom.
Gold (AUD) Daily- Symmetrical Triangle inside a Ascendening BroaGold (AUD) Daily- Symmetrical Triangle inside a Ascendening Broadening Wedge.
thepatternsite.com
thepatternsite.com

PMGOLD Daily- Gold ETF also forming a Symmetrical triangle. PMGOLD Daily- Gold ETF also forming a Symmetrical triangle.
Sometimes, the Gold ETFs form in advance a hint of technical insight ahead of the main underlying commodity- not this time!

Gold (AUD) daily- Rising WedgeGold (AUD) daily- Rising wedge, inside a Broadening wedge.
60% of downward rising wedge breakout. 40% upward breakout.
Larger Broadening Wedge pattern- 80% of upward eventual breakout.

BUY OPPORTUNITY FOR GOLD
GOLD
I think that this is the logical scenario now.
With the release that Gilead`s vaccine doesn`t work very well, there is no positive sentiment on the market.
Gold for example show`s us, that there is a risk for the economy to collapse more with his price which goes north.
I bet that with aproximately 26 000 000 jobless people searching for help only in the US there will be no fast recovery
how some of the big banks expected.
Stay home, make money and don`t inject disinfectant in your body
Have a profitable crisis


Gold (AUD) Daily chart- Ascendening Broadening Wedge. Gold (AUD) Daily chart- Ascendening Broadening Wedge.

Gold heading 1745 minimum the price will hit the purple box and will bounce back minimum to 1745 what I intend it will acheave 2k$
the price will bounce back from the purple box

Gold (AUD) daily chart- Symmetrical Triangle.Symmetrical triangles as part of lead uptrend, tend to bias bullish breakouts.


Gold (AUD) daily chart- Following orderly uptrend. Gold (AUD) daily chart- Following orderly uptrend.
Yellow line- 20 day simple MA.


Gold in AUD (daily chart)- Ascending broadening wedge. Gold in AUD (daily chart)- Ascending broadening wedge (yellow lines).
According to Bulkowski's chart pattern research- 81% probability of a bullish eventual breakout.
thepatternsite.com

GOLD in USD- Bullish Ascending Broadening wedge. According to Bulkowski's chart pattern- 81% probability of breakout (up) as the trend leading up to the formation (bullsih).

GOLD Trade idea as Sell-Setup loading!Gold has reached the resistance line a confluence parameters and is near the top resistance level of 1680. However I expect a fall from consolidating resistance to 15xx As inversed pattern show. Although perhaps the price will reach the level of 1680 before dropping to the support line at the level of 1600. Please also comment, like follow me and share your ideas on this particular pair too. thanks!

GOLD/AUD - Short Term LongI have not published in a long time. Lots of hours in the trenches, and with a friend we are testing a new oscillator combined with price action that is working well.
This trade was taken on the m15 time frame, TP set at previous H4 structure.
You'll be seeing a lot more posts of my entries moving forward trying to keep the charts as clean as possible.
