XAUMO WEEKLY REPORT🎬 XAUMO WEEKLY REPORT
“The Big Short… but it’s Gold, and Everyone’s Acting Innocent”
Spot Gold: ~4300
Mood: Everyone says “nothing’s wrong”
Reality: Something’s always wrong
Disclaimer: Educational only. This is not a trade signal.
If you lose money, don’t look at me like Steve Carell did.
────────────────────────────────────────
SCENE 1: THE GATES
(Also known as: Where the market pretends price discovery exists)
UPPER GATES – SUPPLY / DISTRIBUTION
U1: 4305–4337
→ This is where price goes to die… repeatedly.
Everyone buys the breakout.
Institutions sell them the breakout.
Everyone is shocked. Again.
U2: 4379–4381
→ The “decision shelf”.
Translation: either we squeeze shorts…
or dump on retail with surgical precision.
U3: 4428–4473
→ If price gets here, CNBC will call it “strong demand”
even though the selling started 20 dollars earlier.
LOWER GATES – DEMAND / RELOAD
D1: 4259–4237
→ The classic “nothing to see here” reload zone.
Looks scary.
Isn’t.
Unless it accepts. Then it really is.
D2: 4194–4154
→ Where long-term money actually wakes up.
Also where Twitter declares the bull market dead.
D3: 4137–4007
→ If we’re here, someone blew up quietly on a Friday.
RULES (No one follows them, but here they are):
- Accept above U1 → continuation possible
- Accept below D1 → liquidity vacuum, fast drops, no apologies
────────────────────────────────────────
SCENE 2: MACRO CALENDAR
December Edition: “Thin Liquidity, Thick Lies”
- US CPI
- Retail Sales
- Central Banks saying a lot without saying anything
December logic:
Less liquidity
More stop runs
Faster reversals
Everyone blames “algorithms”
Holiday effect:
The book is thin.
The wicks are long.
Your stop is food.
────────────────────────────────────────
SCENE 3: CROSS-ASSET CHECK
(The part where correlations pretend to work)
- Equities: down, but not screaming
- VIX: up, but not panicking
- Dollar: firm
- Yields: rising and annoying
Translation:
Gold can spike on fear,
but it won’t trend unless the dollar chills out.
So expect drama without commitment.
────────────────────────────────────────
SCENE 4: FUTURES STRUCTURE
GC1 vs GC2 (Because structure tells the truth, not price)
We’re in mild contango.
That’s normal.
No stress.
No emergency.
If contango compresses or flips?
Someone’s in trouble.
And they’re not tweeting about it.
────────────────────────────────────────
SCENE 5: FIB LEVELS
(The numbers traders swear by and still lose money on)
Key pivot: ~4304
Support ladder: 4295 → 4289 → 4283
Upside supply: 4318 → 4323 → 4337
Meaning:
Price is boxed.
Everyone’s impatient.
Liquidity loves impatience.
────────────────────────────────────────
SCENE 6: MULTI-TIMEFRAME DRAMA
Lower TFs:
“Let’s rally!”
Higher TFs:
“Relax. We’re distributing.”
Daily:
Still selling strength.
Weekly:
Still suspicious.
Conclusion:
Classic stop-hunt week.
Nobody gets paid for being early.
────────────────────────────────────────
SCENE 7: ICHIMOKU (Simplified for sanity)
Forget the cloud.
Treat 4305–4337 as the line of truth.
Above and accepted?
We talk continuation.
Below?
It’s all theatrics.
────────────────────────────────────────
SCENE 8: VWAP
(The only adult in the room)
- Above VWAP + defended → quick longs
- Below VWAP + defended → quick shorts
Key word: QUICK.
December does not reward commitment.
────────────────────────────────────────
SCENE 9: BIAS SCORECARD
(Because confidence should always be uncomfortable)
Weekly bias: Bear-tilted retest
Daily bias: Sell rallies
Intraday: Trying to be bullish, failing politely
Conviction:
~55%
That’s not confidence.
That’s “I know something’s wrong but can’t prove it yet”.
────────────────────────────────────────
SCENE 10: MAGNETS
(Where price goes after the lie is exposed)
If bulls win:
4379 → 4428 → 4473
If bears win:
4237 → 4194 → 4154
Then 4137 → 4007 if liquidity disappears like 2008 promises
────────────────────────────────────────
SCENE 11: SESSIONS
(Because time zones matter more than opinions)
Tokyo:
Mean reversion and fake breaks.
London:
Real liquidity test.
New York:
Where stop hunts go to graduate school.
────────────────────────────────────────
SCENE 12: LIQUIDITY MAP
(Where dreams go to get stopped out)
Buy-side stops:
Above 4337, then above 4380
Sell-side stops:
Below 4295, then 4283, then 4237
Expected behavior:
Sweep one side.
Pause.
Then decide.
────────────────────────────────────────
FINAL SCENE: THE BIG SHORT MONOLOGUE
“Look, I might be early…
but I’m not wrong.
The price is lying.
Liquidity is thin.
And acceptance matters more than direction.”
Translation:
Don’t trade the middle.
Don’t marry a bias.
Wait for acceptance.
Get paid quickly.
Respect the tail risk.
December isn’t about being right.
It’s about surviving the credits.
— End Scene —
Educational commentary.
Market structure & liquidity behavior.
Not financial advice.
Xaumo

YALLA XAUMO — GOLD (XAUUSD)📘 EDUCATIONAL ONLY — NOT FINANCIAL ADVICE
All times Africa/Cairo (+02:00).
🟡 YALLA XAUMO — GOLD (XAUUSD)
Institutional Daily — COMPREHENSIVE (Approved Protocol • Holiday-Aware)
Report time: Mon, 17 Nov 2025 — 06:35 Cairo
Spot ref: 4,083.9 (XAUUSD)
GC1 (front, Dec ’25): 4,086.3
GC2 (next, Feb ’26): 4,121.4
→ Term spread (GC2–GC1): +0.86% → mild CONTANGO
────────────────────────────────────────────────────────
0) HOLISTIC MARKET OUTLOOK (TODAY)
────────────────────────────────────────────────────────
• Macro tape:
– Equities mixed to slightly positive (US 500 flat / NAS100 green, VIX below 20).
– Dollar Index nudging higher around 99 → light headwind for gold.
– US yields stable: 10Y near 4.15%, 2Y around 3.6% → curve modestly upward, no fresh “recession panic”.
• XAUMO flow:
– Last 24h on your XAUMO order-flow board = classic “post-spike digestion”:
▸ Big prior KILL BAR down from ~4,12x into ~4,06x with huge negative delta.
▸ Below that, a wide green “Uploading” zone 4,07x–4,08x where buyers quietly reload.
▸ Above, repeated “Offloading” strips 4,10x–4,11x where rallies get sold.
– Current price ~4,08x is sitting in the **mid-channel between Uploading & Offloading**.
• Vol regime:
– RVOL line on your board ~0.2–0.25 → participation is thin vs recent sessions.
– ΔVolume% around -60% to -70%, Spread% also negative → market is **probing**, not exploding.
• Take-away for today:
– Structure is still **balanced / indecisive**, but under a heavy prior sell-Megabar.
– Base case: **range-with-downside-risk** unless buyers can reclaim 4,10x–4,11x with strong positive delta.
────────────────────────────────────────────────────────
1) SNAPSHOT & MAP (INTRADAY STRUCTURE)
────────────────────────────────────────────────────────
• Regime: Post-Megabar digestion after a sharp down-impulse.
• Key structural zones from XAUMO board:
– Uploading Zone (buyers absorb): 4,070–4,080
– Mid “neutral lane”: ~4,083–4,095
– Offloading Zone (sellers hit): 4,100–4,112
– Last KILL BAR high: ~4,123
– Last KILL BAR low: ~4,060
• Asia session:
– Broad stair-step selling from ~4,11x into ~4,07x with mostly negative delta.
– Attempts to bounce into 4,10x repeatedly met by Offloading footprints.
• Pre-London:
– Price oscillating around 4,08x–4,09x on **low RVOL**, wicks both sides.
– Market is parking near the **midpoint of the KILL BAR** = classic “decision area”.
────────────────────────────────────────────────────────
2) MACRO CALENDAR & HOLIDAYS (WEEK 47 — CAIRO VIEW)
────────────────────────────────────────────────────────
Today — Mon 17 Nov
• Canada: CPI (Oct) — medium impact on DXY via cross-flows (USDCAD).
• US: Empire State Manufacturing (Nov) — regional activity gauge.
• Some LATAM holidays (e.g., Mexico) → minor liquidity pockets in US hours.
Tue 18 Nov
• US: Trade prices, industrial production (Oct).
• RBA minutes in Asia (AUD-sensitive, risk sentiment channel).
Wed 19 Nov
• UK: CPI (Oct), Eurozone: current account + CPI final.
• US: Housing Starts & Building Permits (Oct).
• **US FOMC Minutes (Oct meeting) — key event of the week**:
→ Potential volatility shock for DXY, yields, and thus gold.
Thu 20 Nov
• US: Philly Fed, Leading Indicators, Existing Home Sales.
• Canada: IPPI / RMPI.
• Japan: CPI (Oct).
Fri 21 Nov
• US: PMIs (Manuf/Services) + Michigan sentiment (final).
• UK & Eurozone: PMIs.
→ XAUMO note: true “event risk” skew grows sharply into **Wed night (FOMC minutes)**.
────────────────────────────────────────────────────────
3) GC FUTURES TERM STRUCTURE (XCM VIEW)
────────────────────────────────────────────────────────
GC1 (Dec ’25): 4,086.3
GC2 (Feb ’26): 4,121.4
Term spread = (GC2 − GC1) / GC1 ≈ +0.86% → mild CONTANGO
— GC futures curve explainer (retail-friendly) —
• Contango → when GC2 is more expensive than GC1:
– Futures curve slopes UP.
– Market prices in storage + carry costs.
– Not automatically bearish; it just means “normal” carry structure.
• Backwardation → when GC2 is cheaper than GC1:
– Curve slopes DOWN.
– Often signals strong immediate demand or short-term supply stress.
• Term spread (%) → the % difference between GC2 and GC1:
– Positive = contango, negative = backwardation.
– The **bigger** the spread, the more the curve is leaning in one direction.
Current message:
→ Mild contango: futures market is **not** screaming panic; it accepts elevated prices
but does not yet believe in a violent crash or squeeze.
────────────────────────────────────────────────────────
4) XAUMO FIB-KICKER VOLUME MATRIX (CONCEPTUAL)
────────────────────────────────────────────────────────
(Using your latest 15m/1h XAUMO Megabar / Fib-Kicker logic)
• Last major 1h Megabar down:
– Impulse: ~4,123 → ~4,060
– Box mid: ~4,091
– Fib reference (approx):
▸ 23.6%: 4,075
▸ 38.2%: 4,085
▸ 50.0%: 4,091 (current parking area)
▸ 61.8%: 4,098
▸ 78.6%: 4,108
• Volume read:
– Below 4,075: buyers step in (Uploading) but with **thin tape** → fragile floor.
– 4,085–4,098: noisy absorption, alternating positive/negative delta.
– Above 4,108: consistent Offloading, strong sell imbalances on your footprint.
• RVOL bands:
– 15m RVOL < 0.6 most of Asia → “inside-day digestion” mood.
– XAUMO flag: only treat moves as **true breakouts** if RVOL > 1.2 AND spread widens.
────────────────────────────────────────────────────────
5) ICHIMOKU REGIME TABLE (D / 4H / 1H / 15M)
────────────────────────────────────────────────────────
(Approximate regime read, aligned with your Ichimoku templates)
Daily:
• Price above long-term Kumo but flattening.
• TK lines starting to compress.
→ Regime: Bullish but tired / late-trend.
4H:
• Price pulled back toward Kijun after blow-off highs.
• Chikou moving into crowded candles = risk of deeper mean reversion.
→ Regime: Corrective within bigger uptrend.
1H:
• Price oscillating around Kijun / 9-base with frequent TK flips.
→ Regime: Range / indecisive, controlled by prior KILL BAR.
15M:
• Frequent cloud penetrations, TK crosses every few hours, no clean slope.
→ Regime: Micro-range best suited for **scalps**, not swing entries.
────────────────────────────────────────────────────────
6) VALUE MAP (POC / VAL / VAH / VWAP – INTRADAY)
────────────────────────────────────────────────────────
(Estimates from your footprint & profile)
• Prior full session:
– VAH: ~4,110
– POC: ~4,095
– VAL: ~4,078
– Session VWAP cluster: 4,090–4,095
• Overnight/Asia:
– Price traded most between 4,078 and 4,092.
– Rejection tails above ~4,105 (no acceptance above Offloading band).
XAUMO read:
– Trading below POC and VWAP, nearer VAL → **mild bearish skew** inside the range.
– First serious “acceptance shift” would be:
▸ Bullish if we can hold above 4,105 with RVOL expansion.
▸ Bearish if we build a new value area under 4,070.
────────────────────────────────────────────────────────
7) XAUMO TREND MAP (BIAS & CONFIDENCE)
────────────────────────────────────────────────────────
Daily bias: Bullish-but-corrective (trend still up, structure softening)
4H bias: Light short / corrective (below KILL BAR mid)
1H bias: Neutral to light short (under POC/VWAP, under Offloading)
15M bias: Range-bound, volatility pocket around 4,08x
Conviction score (0–100):
• Directional short-side conviction: ~58
• Directional long-side conviction: ~42
XAUMO wording:
→ “Short-tilted range”: you respect the upside, but **you don’t trust breakouts**
unless they clear 4,11x with real delta & RVOL.
────────────────────────────────────────────────────────
8) CROSS-ASSET HEATMAP (SIMPLIFIED)
────────────────────────────────────────────────────────
FX:
• EURUSD slightly lower (USD a bit stronger).
• USDJPY up (risk-on + yield support).
→ Dollar gently firmer = small drag for gold.
Equities:
• US 500 basically flat, NAS100 up ~0.4%.
→ Risk sentiment mildly constructive, not panic.
Volatility:
• VIX just under 20 → “uneasy calm”, but not crisis mode.
Rates:
• 10Y ~4.15%, 2Y ~3.6% → modest positive slope.
→ Market pricing “steady but elevated” rates; no fresh Fed shock yet.
Oil:
• WTI around high-50s → cheap energy vs past months, easing inflation pressure.
Overall macro tilt:
→ Cross-asset matrix points to **mild risk-on / soft-USD**, not a screaming
gold panic bid. The big driver for gold today remains **its own structure**
and expectations into FOMC minutes.
────────────────────────────────────────────────────────
9) SESSION BIAS TABLE (TOKYO / LONDON / NY)
────────────────────────────────────────────────────────
Tokyo (done / in progress):
• Behavior: Digestion, stair-step selling from Offloading into Uploading.
• Bias: Light short, low RVOL, no clean trend.
London (upcoming):
• Base case:
– Early hours: probe 4,07x–4,10x range.
– Break preference: marginally lower as long as Offloading at 4,10x–4,11x holds.
• Watch:
– RVOL > 1 on breaks of 4,070 or 4,110.
– Cross-asset confirmation: DXY > 99.5 and/or 10Y popping above 4.2%.
New York:
• Will have Canada CPI + Empire State in the background.
• Expect sharper response IF:
– US data cools sharply → yields drop → gold squeezes back toward 4,12x–4,15x.
– US data beats → yields tick up → 4,07x floor gets tested.
────────────────────────────────────────────────────────
10) LIQUIDITY MAP (SIMPLIFIED)
────────────────────────────────────────────────────────
Likely resting liquidity (based on XAUMO behavior & typical levels):
Above price:
• 4,100–4,112: stacked limit sells / profit-taking (Offloading).
• 4,120–4,130: stops from shorts who sold the KILL BAR and hate being wrong.
Below price:
• 4,070–4,075: first layer of downside liquidity (short-term dip buyers).
• 4,060: low of prior KILL BAR → cluster of stops under it and fresh breakout
sellers waiting for a close below.
XAUMO takeaway:
→ First clean “liquidity event” = either:
▸ Wash below 4,060 (stop run) OR
▸ Squeeze above 4,112 (short covering into stops).
────────────────────────────────────────────────────────
11) MEGABAR / KILL-BAR DIAGNOSTICS
────────────────────────────────────────────────────────
• Last KILL BAR: strong bearish Megabar (huge negative delta, wide range).
• Since then:
– No upside Megabar to cancel it.
– Current bars are smaller, overlapping → **absorption**, not reversal (yet).
• XAUMO doctrine:
– Until a strong opposite Megabar appears OR value migrates above its mid,
the original KILL BAR keeps control.
→ Today, bears still own the steering wheel, bulls only have the handbrake.
────────────────────────────────────────────────────────
12) TRADE SCENARIOS (EDUCATIONAL EXAMPLES ONLY)
────────────────────────────────────────────────────────
These are STUDY BLUEPRINTS, not signals. Numbers are approximate.
A) Swing-style continuation short
• Bias: 60–65% probability of range-then-drift lower while KILL BAR holds.
• Example idea:
– Zone to stalk: rejection from 4,100–4,110 with negative delta & RVOL > 1.
– Hypothetical entry: 4,102–4,107 (after failed breakout).
– Protective SL: above 4,118 (beyond Offloading & 78.6% fib).
– TP1: 4,080 (VAL / Uploading top).
– TP2: 4,068 (Uploading mid).
– TP3 (stretch): 4,060 (KILL BAR low / liquidity pocket).
• Invalidation: clean 1h close above 4,118 with strong positive delta.
B) Reversal / dip-buy swing (lower-probability counter)
• Bias: 40–45% probability IF macro helps (yields drop, DXY fades).
• Example:
– Zone: sharp flush into 4,060–4,065 with capitulation delta, then
absorption + long lower wicks.
– Hypothetical entry: 4,065 with confirmation (15m footprint).
– SL: below 4,048 (under flushed liquidity).
– TP1: 4,083 (mid-range).
– TP2: 4,098–4,102 (VWAP/POC cluster).
– TP3: 4,115–4,120 (above Offloading).
• Invalidation: failure to reclaim >4,080 quickly (price “sticks” under VAL).
C) Intraday scalp (range trading inside structure)
• For experienced scalpers only.
• Long scalp idea:
– Buy near 4,073–4,076 IF:
▸ RVOL moderate (0.6–1.0),
▸ Footprint shows higher lows in delta, and
▸ No macro release imminent.
– SL: under 4,068.
– TP: 4,084–4,088.
• Short scalp idea:
– Fade tests of 4,100–4,105 IF:
▸ Offloading footprints re-appear,
▸ DXY and yields ticking up.
– SL: above 4,112.
– TP: 4,088–4,082.
D) “No-trade / wait” scenario
• Conditions:
– Price stuck 4,082–4,092,
– RVOL < 0.6,
– No macro catalyst in next 60–90 minutes.
• XAUMO rule:
→ Accept boredom > accept random risk.
→ Flat is a valid position.
────────────────────────────────────────────────────────
13) EXECUTION CHECKLIST (XAUMO MINDSET)
────────────────────────────────────────────────────────
Before ANY trade:
Is there a clear structural edge? (Uploading vs Offloading, KILL BAR context)
Is RVOL confirming the move (>1 for breakout, <0.6 for mean-reversion)?
Are DXY + yields aligned with your side, or at least not against you?
Is there high-impact news within the next 30–60 minutes?
Position size ≤ pre-defined risk (ATR-based or fixed %).
SL placed where the **idea** breaks, not where PnL hurts.
Pre-planned TP1/TP2 and trail logic — no improvisation mid-trade.
────────────────────────────────────────────────────────
14) MTF CALIBRATED RETRACEMENT LAB (15M FOCUS)
────────────────────────────────────────────────────────
Educational snapshot of how to think about today’s pullbacks:
Anchor: 1h KILL BAR 4,123 → 4,060.
• 0% = 4,060 (low)
• 23% ≈ 4,075
• 38% ≈ 4,085
• 50% ≈ 4,091
• 61.8 ≈ 4,098
• 78.6 ≈ 4,108
Retracement logic for study:
• Healthy bearish trend:
– Price struggles above 38–50% and keeps making new lows.
• Balanced market:
– Price hovers 50–61.8% with overlapping candles & mixed delta.
• Failed bearish attempt (potential reversal):
– Market reclaims 78.6% and **holds above** with positive RVOL.
Today’s 15m chart:
• Price is stuck between 50% and 61.8% (4,091–4,098).
• This is the “no hero” zone:
– Wait for either:
▸ Rejection from 4,10x (continuation short), OR
▸ Deep flush + absorption near 4,06x (counter-long study).
────────────────────────────────────────────────────────
15) QUICK ARABIC SUMMARY (HEADLINE ONLY – OPTIONAL)
────────────────────────────────────────────────────────
• الذهب دلوقتي حوالين 4,08x في نص منطقة شد الحبل بين:
– Buyers بيحمّلوا تحت 4,08x (Uploading)
– Sellers بيصفّوا فوق 4,10x (Offloading)
• مافيش خبر ضخم النهارده، بس الأسبوع يسخن من الأربعاء مع محضر الفيدرالي.
• الميل العام من منظور XAUMO:
– Range مائل هبوط طول ما الـ KILL BAR الهابط مسيطر
– حقيقي نخاف من صعود قوي بس لما نشوف اختراق واضح فوق 4,11x مع RVOL عالي.
• المتداول التعليمي النهارده:
– يا إما scalp من أطراف الرينج،
– يا إمّا انتظار اختراق صريح فوق 4,11x أو كسر 4,06x قبل ما يفكر في swing.
🏆 Winners trade with XAUMO indicators

YALLA XAUMO — GOLD (XAUUSD)- Institutional WEEKLY 📘 YALLA XAUMO — GOLD (XAUUSD)
Institutional WEEKLY — COMPREHENSIVE OUTLOOK
Week of Mon 17 → Fri 21 Nov 2025
All times Africa/Cairo (UTC+2). EDUCATIONAL ONLY — NOT FINANCIAL ADVICE.
Spot ref (XAUUSD): ~4,080 $/oz
GC1 (Dec ’25, front month): ~4,184 $/oz
GC2 (Feb ’26, next): ~4,220 $/oz
Term spread (GC2–GC1): ≈ +0.9% → mild CONTANGO
────────────────────────────────
GC FUTURES CURVE — QUICK GUIDE
────────────────────────────────
• Contango → GC2 > GC1 (upward curve):
Normal structure. Storage + carry costs are priced in. This is NOT automatically bearish for gold.
• Backwardation → GC2 < GC1 (downward curve):
Often signals strong immediate demand or short-term supply/flow stress. Can be short-term bullish for spot.
• Term spread (%) → (GC2 − GC1) / GC1 × 100:
Shows how steep the futures curve is. Bigger positive spread = market pricing more “future upside / carry”. Narrow or negative spread = nearer-term stress or demand.
Current read: Mild, healthy contango → gold is expensive but NOT in panic backwardation; market still comfortable holding exposure into early 2026.
────────────────────────
0) WEEKLY SNAPSHOT & MAP
────────────────────────
• Big picture:
– Gold is trading just below recent all-time highs (above 4,200 printed last month).
– Past month: soft pullback of roughly −3% from highs but still very elevated on a multi-year basis.
– Last 5–7 sessions: strong two-way flow, with intraday spikes both directions and closes clustering ~4,050–4,150.
• XAUMO structural read:
– Below: multi-week “Uploading” zone (institutional accumulation) where prior dips were bought aggressively.
– Above: fresh “Offloading” zone close to the recent record highs where large players started distributing size into strength.
– Vol & spreads:
• Volatility remains high but off the absolute peak.
• Spreads and intraday ranges expanded mid-week and cooled slightly into Friday.
→ Interpretation for 17–21 Nov:
• This is a “decision week inside a high range”, not a clean new trend.
• Market will likely choose between:
– (A) Deeper rotation back into the Uploading zone if macro = hawkish / growth-OK, or
– (B) A second push toward or beyond the highs if macro = dovish / growth-scared.
────────────────────────────
1) CROSS-ASSET TAPE (RISK MAP)
────────────────────────────
• Dollar Index (DXY) ~99.2:
– Off its mid-year peaks, closer to the bottom of its recent range.
– Bias: mild dollar softness compared to earlier in 2025.
• S&P 500 ~6,734:
– Near record territory but with recent pullbacks and intraday volatility.
– Investors still “buying the dip” in AI/tech, but sensitivity to Fed signals is high.
• VIX ~19–20:
– Elevated vs “calm” (12–15), but below panic (>25).
– Tells you: this is a market that can accelerate on headlines; gold benefits from that volatility.
• US 10-year yield ~4.1–4.2%:
– Still high in historical terms.
– Polls/forecasts show expectations for only modest moves higher in coming months, with cuts further out on the curve.
– Gold is coexisting with high nominal yields thanks to:
• Debasement narrative (debt, deficits),
• Central-bank buying,
• Uncertainty about real growth.
→ XAUMO conclusion:
– Cross-asset tape is mildly risk-on but fragile.
– Any surprise in Fed tone, data, or geopolitical risk can flip the intraday regime quickly and feed into gold.
──────────────────────────────
2) MACRO CALENDAR: 17–23 NOV
──────────────────────────────
Focus: what can MOVE gold, not every minor data point.
MON 17 NOV
• CAD CPI (inflation, Canada)
– Direct on CAD, indirect on commodities risk sentiment.
– Bigger-than-expected upside surprise can revive “sticky inflation” narrative.
TUE 18 NOV
• RBA Meeting Minutes (Australia)
– Asia-Pac risk sentiment signal.
– Dovish tone → supportive for gold via weaker AUD yields / global growth worries.
– Hawkish tone → limited direct effect but can tilt Asia risk-on.
WED 19 NOV — KEY DAY
• FOMC Minutes (October meeting)
– The main event of the week for gold.
– Market will scan for:
– How split is the committee?
– How worried about inflation vs growth?
– Hints about timing/pace of future cuts into 2026.
– Less hawkish / more growth-worry:
→ Bond yields ease, dollar softens → supportive for gold.
– More hawkish / inflation-worry:
→ Yields nudge higher, dollar firmer → pressure on gold (at least initially).
THU 20 NOV
• PBoC rate decision / China credit stance
– Extra easing / credit support = better commodity demand narrative (indirect positive for gold).
– Disappointment or more signs of slowdown = risk-off in cyclicals, but can also support gold as safe haven if sentiment sours.
FRI 21 NOV
• UK Retail Sales
• Flash PMIs (Germany, Eurozone, UK, US)
– Global growth thermometer.
– Weak PMIs → recession / stagnation chatter → more medium-term support for gold (cuts + safe-haven flows).
– Strong PMIs → short-term support for equities and possibly the dollar → can cap gold near the top of its range.
SUN 23 NOV (outside main trading week)
• NZ Retail Sales
– Minor for gold directly, but part of the global growth mosaic.
──────────────────────────────
3) HOLIDAYS / LIQUIDITY CHECK
──────────────────────────────
• No major US federal holiday during 17–21 Nov.
• Thanksgiving is on Thu 28 Nov (the following week), with Black Friday 28–29 Nov.
• Europe: no major pan-EU market holiday in this week; only usual local events with limited impact on global liquidity.
→ Read: This is a full-liquidity week. Moves around FOMC Minutes and PMIs are likely to be “real” flows, not just holiday noise.
────────────────────────────────────
4) XAUMO STRUCTURE — RANGE DIAGNOSTIC
────────────────────────────────────
(Conceptual: Uploading vs Offloading, MegaBars & Delta behavior)
• Uploading zones (support side):
– Built over recent weeks on pullbacks after the run to ~4,200+.
– Characterized by:
• Positive volume delta on down days,
• Strong reaction candles (MegaBars) stopping selloffs,
• RVOL elevated on lows (buyers stepping in).
– Each revisit has so far triggered a bounce, reinforcing these zones as “dynamic institutional support”.
• Offloading zones (resistance side):
– Close to or slightly above the recent record highs.
– Features:
• RVOL spikes on up-swings with fading delta (distributions into strength),
• Rejection candles / Kill Bars,
• Choppy clusters where upside follow-through stalls.
– This behavior is classic “distribute at extremes”, not clean breakout acceleration.
• Volatility regime:
– Elevated but not parabolic.
– XAUMO view: we are in a “high-altitude balancing act”:
→ deep pockets are carefully rotating risk at high prices, not simply panic-buying or panic-selling.
──────────────────────────────
5) WEEKLY REGIME (TREND VS BALANCE)
──────────────────────────────
High-level trend (multi-TF conceptually):
• Monthly:
– Strong bullish secular trend still intact (structure higher highs/higher lows).
– Over-extended zone; any deep pullback is still “inside” a long-term uptrend unless key prior monthly lows break.
• Weekly:
– Price is at/just below prior extremes with a broad horizontal band forming (multi-week range).
– XAUMO reads this as:
“Distribution-and-re-accumulation at high altitude” — not confirmed reversal, not confirmed blow-off continuation.
• Daily:
– Alternation: sharp pushes up followed by sharp shake-outs.
– Choppy value re-tests near the middle of the weekly range between Uploading and Offloading.
→ Regime label for 17–21 Nov:
“High-level BALANCED with directional optionality around FOMC Minutes.”
In other words: the trend is up on big TFs, but this week is about “who wins the range”: buyers defending Uploading vs sellers leaning on Offloading.
──────────────────────────────
6) WEEKLY SCENARIO LAB (NO ENTRIES)
──────────────────────────────
⚠ These are structural scenarios for study ONLY — NOT trade signals, no entries, no SL/TP.
SCENARIO A — “Dip then Reload” (Pro-gold bias)
• Setup:
– Early week: gold drifts lower or chops sideways as markets front-run FOMC Minutes.
– We see tests toward/into known Uploading zones on your XAUMO map.
• FOMC tone:
– Less hawkish / more concerned about growth and debt sustainability.
• Market reaction:
– US yields ease a bit, DXY softens.
– Gold prints supportive delta + MegaBars from the lower half of the range.
• Outcome:
– Week closes towards mid-to-upper portion of the recent band.
– Under this scenario, dips are “used to reload” rather than start a full reversal.
SCENARIO B — “Fed Hawkish Squeeze” (Pressure on gold)
• Setup:
– Markets go into Wednesday still near mid or upper band of the recent range.
• FOMC tone:
– Minutes show more concern about inflation, less urgency about cuts.
• Market reaction:
– 10-year yields push higher again; dollar stabilizes or firms.
– Equities wobble or correct.
– Gold fails to hold mid-range value and rotates back firmly toward the lower band.
• Outcome:
– Week prints a bearish body on weekly candle (longer upper wick), with tests or even temporary breaks beneath recent Uploading zones.
– This doesn’t kill the long-term bull but warns of deeper corrective structure into late November.
SCENARIO C — “Risk-On Sideways” (Range extension without decision)
• Setup:
– PMIs and data come in “OK but not scary”,
– FOMC Minutes are balanced, nothing shockingly new.
• Market reaction:
– Equities stay near highs with some volatility,
– Dollar only slightly moved,
– Gold oscillates between Uploading and Offloading with no decisive break.
• Outcome:
– Another wide range weekly candle closes inside the same band.
– XAUMO takeaway: continuing accumulation/distribution at altitude; bigger move postponed to December or post-Thanksgiving.
SCENARIO D — TAIL RISK (Shock event)
• Could be:
– Geopolitical flare-up,
– Surprise credit event,
– Major policy misstep headline.
• Reaction:
– Spiky MegaBars, large RVOL, fast repricing across DXY, yields, and equities.
– XAUMO focus shifts from “fine-tuning the range” to:
• Identifying NEW Uploading/Offloading zones created by the shock.
──────────────────────────────
7) XAUMO WEEKLY EXECUTION CHECKLIST
──────────────────────────────
Use this to structure your own plan (NOT to auto-trade):
BEFORE MONDAY OPEN:
Mark your key Uploading zones (multi-week support clusters).
Mark your key Offloading zones (multi-week distribution caps).
Note the middle of the recent range — where “fair value” has been trading.
EACH DAY (PRE-LONDON):
Review overnight Asia flows:
– Did Tokyo/Asia buy dips or sell rallies?
– Any unusual RVOL / MegaBar activity?
Check macro diary for the day (is it event-driven or purely technical?).
PRE-NEW YORK (ESPECIALLY WED FOMC DAY):
Re-assess:
– Is gold closer to Uploading or Offloading?
– Are DXY, SPX, and US10Y aligned with risk-on or risk-off?
Decide which scenario (A/B/C/D) the market is closer to and what would invalidate that read.
END OF WEEK:
Where did the weekly close land?
– Near highs → Offloading challenged or absorbed.
– Near lows → Uploading stressed or broken.
– Middle → range still dominant.
Update your XAUMO Gate Map and redraw your higher-TF structure for the final weeks of Q4.
──────────────────────────────
BOTTOM LINE FOR THE WEEK
──────────────────────────────
• Environment:
– Gold is in a high-altitude balance: big secular bull, but stuck between institutional Uploading and Offloading zones.
– FOMC Minutes + global PMIs are the main catalysts for a range break or confirmation of continued balancing.
• Practical XAUMO message:
– Respect BOTH tails: a dovish surprise can fuel another push toward the highs, a hawkish surprise can drive a deeper retest of support.
– Instead of predicting, let structure + volume + delta + sessions show you:
“Where are they loading the truck?” vs “Where are they unloading it?”
This whole report is for education, orientation, and planning —
not for executing trades, not a substitute for your own risk management,
================================
📘 EDUCATIONAL PRECISION MAP — XAUUSD (Next Week)
Reference spot (Fri close): ~4,080 $/oz
Recent extremes: low ~4,032 • highs ~4,215–4,250
⚠️ Not signals. Use as study levels only. You own your risk.
────────────────────────
1) “Shallow Dip” Accumulation Study
────────────────────────
Idea: market defends Friday’s lower zone and re-loads above 4,030.
• Study ENTRY zone (buyers to watch):
→ 4,040 – 4,065
(just above the 4,032 low and round 4,050 handle)
• STRUCTURAL invalidation for this idea:
→ H4 close below 4,010
(means that whole shallow support band failed, attention shifts to deeper zone).
• EDUCATIONAL targets if this zone holds:
→ TP1 (mid-range): 4,120 – 4,135
(recent intraday balance / minor resistance)
→ TP2 (upper band test): 4,170 – 4,190
(cluster of recent daily closes / resistances)
Risk logic: once you’re under 4,010, you’re no longer trading a “shallow dip”; you’re in deep-correction territory.
────────────────────────
2) “Deep Dip” Accumulation Study
────────────────────────
Idea: shallow zone fails, market washes into the bigger structural support around 4,000.
• Study ENTRY zone:
→ 3,980 – 4,005
(psychological 4,000 + early-November lows near 4,004–4,005)
• STRUCTURAL invalidation:
→ Daily close below 3,950
(breaks prior swing structure; opens room toward mid-3,800s mentioned in some forecasts).
• EDUCATIONAL targets if that zone absorbs selling:
→ TP1: 4,060 – 4,080 (back to value / ref area)
→ TP2: 4,120 – 4,140 (same mid-range resistance as in Scenario 1).
Risk logic: below 3,950 you’re no longer “buying a dip in a strong trend”, you’re in candidate trend-change.
────────────────────────
3) “Offloading Fade” — Range Sell Study
────────────────────────
Idea: big players keep distributing into strength near last week’s cap.
• Study ENTRY zone (sellers to watch):
→ 4,185 – 4,215
(recent daily closes and intraday caps; multiple analyses flag 4,203–4,219 as key resistance)
• STRUCTURAL invalidation:
→ H4 close above 4,245
(clears the rejection high / wick zone ~4,245–4,250).
• EDUCATIONAL downside targets if sellers defend:
→ TP1: 4,140 – 4,150
(recent support/flip area before Friday’s drop)
→ TP2: 4,080 – 4,095
(current reference / Friday settlement band).
Risk logic: if price accepts above 4,245 on closing basis, this “fade the top” idea is dead — you’re on the wrong side of a breakout.
────────────────────────
4) “Breakout & Hold” Continuation Study
────────────────────────
Idea: market finally accepts above the rejection band and builds a new leg higher.
• Trigger condition (not entry by itself):
→ H4 / Daily close above 4,245 with RVOL > 1 and no immediate full rejection.
• Study ENTRY zone (post-break retest):
→ 4,230 – 4,245
(retest of broken resistance as support).
• STRUCTURAL invalidation:
→ Close back inside / below 4,200
(failed breakout → bull trap, reverts to range or reversal).
• EDUCATIONAL upside targets:
→ TP1: 4,285 – 4,300
(next projected resistance band from current S/R ladders).
→ TP2: 4,325 – 4,350
(extension based on recent daily ranges ~170–200 $/oz added above 4,170–4,190).
Risk logic: if the breakout can’t hold 4,200 on a retest, treat it as distribution, not continuation.
────────────────────────
How to actually USE this (educationally)
────────────────────────
1) Mark the four zones on your chart:
• 4,040–4,065
• 3,980–4,005
• 4,185–4,215
• 4,230–4,245
2) For each touch next week, ask:
• What is volume doing (normal / high RVOL / drying up)?
• What is delta doing (aggressive buyers or sellers taking control)?
• Are DXY and 10Y yields confirming the move or fading it?
3) Only THEN design your own trade plan (or stay flat).
These levels are a **map**, not orders.
🏆 Winners trade with XAUMO indicators
EDUCATIONAL ONLY — NOT FINANCIAL ADVICE.

YALLA XAUMO — DAILY COMPREHENSIVE (Institutional)📘 Educational only — not financial advice.
All times Africa/Cairo (+03:00). Tue 14 Oct 2025.
────────────────────────────────────────────────
🟡 YALLA XAUMO — DAILY COMPREHENSIVE (Institutional)
────────────────────────────────────────────────
A) XGM Gate Map (intraday)
• Gate (distribution): 4,168–4,176
• If Gate breaks/holds → 4,189 → 4,206 → 4,220 → 4,239
• Uploading band (buy dips): 4,160 • 4,146 • 4,129 • 4,109.8 • 4,090.6
• Current state: Stair-step up; positive tape delta into highs.
B) Macro Calendar — Holiday-Aware (times in Cairo, UTC+3)
• 09:00 🇬🇧 UK data window (CPI/Jobs/Retail etc., when scheduled)
• 10:00 🇬🇧 London Cash Open (equities)
• 11:00–12:00 🇪🇺 Eurozone data window (ZEW/IFO/CPI flash, when scheduled)
• 12:00–13:00 🇩🇪/🇫🇷 Country prints (if any)
• 15:30 🇺🇸 Tier-1 US data window (CPI/PPI/Claims/Retail — **prime algo time**)
• 16:30 🇺🇸 NYSE Cash Open (US equities)
• 17:30 🇺🇸 EIA Crude Oil Inventories (Wednesdays)
• 21:00–23:00 🇺🇸 Fed speakers/FOMC mins (if scheduled)
• Holiday note: Execute London-led plan first; reassess if US liquidity is curtailed.
C) Snapshot & Map
• Spot (XAUUSD): ~4,161.8
• Short context: Trend intact; shallow pullbacks; repeated tests beneath 4,168.
• Stance: Buy-the-dip >4,146; chase only on RVOL>1.35 with 15m close >4,176.
D) GC Futures Structure (COMEX) + Explainer
• GC1: ~4,173.3 | GC2: ~4,206.5 | Term spread: +0.80% → **Contango**
• Read: Healthy curve; breakout quality improves if spread tightens during thrusts.
• Retail explainer:
– Contango: GC2 > GC1 (carry priced; normal curve).
– Backwardation: GC2 < GC1 (near-term demand/supply stress).
– Term spread (%): (GC2−GC1)/GC1×100 → rising = steeper curve; falling = flattening.
E) Fib-Kicker Volume Matrix (estimates vs avg)
TF Current Vol Δ vs Avg Target Vol Upload % Stage
15m 85–95K +10–15K ~120K 70–78% Mid→Late upload under Gate
1h 230–260K +25–35K ~320K 65–72% Mid upload; room above VWAP
4h 0.95–1.10M +0.10–0.18M ~1.30M 72–80% Trend leg developing
D 3.6–3.9M +0.2–0.4M ~4.6M 75–82% Solid participation
W 14–15M +0.5–0.8M ~18M 60–66% In progress; maintain HLs
F) Ichimoku Regime Table
TF Price vs Cloud Tenkan/Kijun Future Cloud A vs B Chikou Bias
15m Above Bull ↑ A>B (thickening) Free ++
1h Above Bull → A>B (steady) Free ++
4h Above Bull ↑ A>B (expanding) Free ++
D Above Bull → A>B (stable) Free +
W Above Bull → A>B (steady) Free +
G) POC / VAL / VAH / VWAP (refs)
TF POC VAL VAH VWAP
15m 4,140 4,122 4,160 ~4,138
1h 4,098 4,076 4,129 ~4,105
4h 4,029 3,995 4,059 ~4,046
D 3,970 3,944 4,012 ~3,985
H) XAUMO Trend Map — Confidence %
• 15m: 78% long — Buy dips 4,152–4,146; confirm RVOL>1.2 & bullish close.
• 1h : 74% long — Respect VWAP/POC rotations; partials at kickers.
• 4h : 71% long — Trail under prior HL; avoid giving back TP1.
• D : 63% long — Swing bias valid while >4,012.
Composite: **BULLISH** (buy dips >4,146; chase only on confirmed gate hold).
I) Kicker Improvement — Projections (from 4,029 pivot)
• 1.272 = 4,189 • 1.414 = 4,206 • 1.500 = 4,220 • 1.618 = 4,239
J) Session Bias Table (holiday-aware)
• Asia: Constructive climb; positive delta footprints.
• London: Primary engine; watch 4,168–4,176 acceptance.
• New York: Seek follow-through; avoid chasing if RVOL fades <1.0.
K) Cross-Asset Heat (quick read)
• DXY ~99.2 slightly softer → supportive.
• SPX firm; VIX ~19 easing → risk-on backdrop; gold retains RVOL trigger.
L) Liquidity Map (intraday)
• Offers: 4,168 / 4,172 / 4,176
• Pockets above: 4,189 → 4,206
• Bids: 4,160 • 4,146 • 4,129 • 4,109.8 • 4,090.6
M) Trade Scenarios (rules, not signals)
1) Swing — Trend-Follow
Entry: A) Dip buy 4,152–4,146 B) Break/15m close >4,176 (RVOL>1.35)
SL: A) 4,129 B) 4,160 (failed breakout)
TP: 4,168 / 4,189 / 4,206 (runner 4,220)
Prob: 71% while >4,146 and RVOL>1.1
Invalidation: 1h close <4,129
2) Edge-Fade — Counter (Conservative)
Entry: Rejection wick above 4,176 with RVOL<1.0 & delta divergence
SL: 4,182
TP: 4,160 / 4,146
Prob: 42% (only on clean exhaustion)
Invalidation: 15m close >4,176 with RVOL>1.35
3) Scalping — LTF
Trigger: Pullback to 4,152–4,146 + bullish 15m close + DI/RSI uptick
SL: 4,139
TP: 4,160 / 4,168 / 4,176 | Hold: 3–5×15m bars
Prob: 66% with net-positive tape delta
Invalidation: Two 15m closes <4,146
N) Execution Checklist
RVOL>1.35 on breakouts Close above Gate before chasing
DXY not spiking up VIX not surging
Respect VWAP/POC rotations Trail under prior HL after TP1
O) Arabic Quick Summary (numbers in English)
الاتجاه صاعد. بوابة الاختراق 4,168–4,176. شراء الهبوط فوق 4,146.
الأهداف: 4,189 → 4,206 → 4,220. تأكيد بكسر وإغلاق 15m فوق البوابة مع RVOL>1.35.
إبطال: إغلاق ساعة تحت 4,129.
P) French Quick Summary
Tendance haussière. Porte 4 168–4 176.
Acheter les replis >4 146. Cibles 4 189 → 4 206 → 4 220.
Valider avec RVOL>1,35 et clôture 15m > porte. Invalidation: H1 < 4 129.
🏆 Winners trade with XAUMO indicators

YALLA XAUMO — WEEKLY COMPREHENSIVE (Confluence Edition)YALLA XAUMO — WEEKLY COMPREHENSIVE (Confluence Edition)
Educational only — not financial advice. Timezone: Africa/Cairo.
1) Snapshot & Map
Spot (XAUUSD): ~4012.8
Distribution Gate: 4022–4029 → unlocks 4046 → 4059.2 → 4090
Uploading bands (supports): 3985 (≈VWAP) • 3970.65 (15m swing low) • 3944.2 (H1/H4 base)
Context: Uptrend intact; repeated probes of 4029 with liquidity building below.
2) GC Futures Structure (COMEX)
GC1 (front): 4036.2
GC2 (next): 4054.4
Term spread: +0.45% → Contango (healthy carry)
Read: Spot marginally under GC1 → synced. Breakout quality improves if the spread flattens during a push.
Plain-English futures curve explainer (always included):
Contango → GC2 > GC1: a normal upward curve; storage/carry cost is priced in (not inherently bearish).
Backwardation → GC2 < GC1: often signals strong near-term demand or short supply.
Term spread (%) → % difference between GC2 and GC1 that shows whether the curve is rising or falling.
3) Fib-Kicker Volume Matrix
(Directional read; volumes summarized from your charts.)
Uploading = accumulation; Offloading = distribution at resistance.
4) Ichimoku Regime Table
15m: Price above cloud; Tenkan > Kijun; Chikou free above price → Bias +
1h: Touching/above Kijun; future cloud slightly up → Bias + (light)
4h: On/near cloud edge; needs a clean 4h close >4029 → Neutral → +
Daily: Well above cloud, stretched from Kijun → Bias ++
Weekly: Above cloud; major trend up → Bias ++
5) Schabacker Patterns (concise)
4h: Flag/rectangle build over 3985–4005.
Daily: Ongoing ascending structure; measured pushes toward 4046/4059.
Weekly: Extended uptrend; 4090 as decision/supply.
6) POC / VAL / VAH / VWAP Table
15m: POC ~4004 • VAL ~3996 • VAH ~4015 • VWAP ~4003
1h: POC ~4006 • VAL ~3992 • VAH ~4022 • VWAP ~4003
4h: POC ref ~3975.15 • value area rising toward ~4020 • VWAP wkly > 3995
Daily: POC 4012 • VAL 3995 • VAH 4029 • VWAP 4003
7) XAUMO Trend Map
15m: 62% Up — buy dips above VWAP 4003
1h: 58% Up — holding >4012 strengthens breakout odds
4h: 55% Neutral→Up — decision >4029
Daily: 68% Up — targets 4046/4059
Weekly: 72% Up — 4090 supply/trim zone
Composite bias: +61% Up — Prefer buy-the-dip; avoid chasing without RVOL & positive delta.
8) Kicker Improvement (Fib + Price Projections)
Gate: 4022–4029
Kickers: 4046 → 4059.2 → 4090
Below gate: Layered support 4003 → 3985/3971; 3944 break would invalidate the weekly bull case.
9) Trade Scenarios
A) Swing — Long (bias)
Type: Buy Limit on pullback into 3985–3971
Entry: 3988 ±
SL: 3961
TP1/TP2/TP3: 4029 / 4059 / 4090
Probability: 62% ↑
Confirmation: RVOL ≥ 1.1 + positive delta + 1H close above 4012/VWAP.
B) Reversal / Edge-Fade — Short (conditional)
Type: Sell Limit from 4046–4059 only on strong rejection
SL: 4066
TP1/TP2/TP3: 4029 / 4011 / 3995
Probability: 48% ↓
Confirmation: Negative delta + failure to close 1H above 4059 + RVOL rolls < 0.9.
Invalidation: 4H close >4066.
C) Scalping — Long (execution)
Type: Buy Stop >4022; add only after 15m/1h close >4029
SL: 4014
TP1/TP2: 4036 / 4046 (move SL to BE after TP1)
Probability: 58% ↑
Confirmation: RVOL ≥ 1.2, green delta, no sharp sell-off at 4046.
10) (Quick Kicker Reference)
4022 is ignition; sustained closes >4029 activate 4046 → 4059.2; 4090 is weekly decision/supply.
11) Macro Calendar — Week Ahead (Cairo)
Mon: Central-bank speaks / bill auctions.
Tue: Sentiment/Business surveys; secondary inflation prints.
Wed: Key inflation/central-bank minutes (if scheduled).
Thu: US jobless claims + activity gauges.
Fri: Consumer sentiment / inflation expectations.
Always re-check your platform calendar for exact times and adjust risk.
12) Arabic Quick Summary (one-liner)
Uptrend, buy dips 4003/3985, gate 4022–4029 → 4046/4059, fade 4046–4059 only with rejection & red delta, break 3944 kills weekly bull.
13) Quick Reference (levels)
Supports: 4003 • 3985 • 3970.65 • 3944.2
Gate: 4022–4029
Upside: 4046 → 4059.2 → 4090
Invalidation (Swing): Daily break <3944.
Disclaimer: Educational content only; not investment advice. Trading involves substantial risk.
🏆 Winners trade with XAUMO

XAUMO GOLDEN REPORT – The Golden Analysis for XAUUSD (Footprint)XAUMO GOLDEN REPORT – The Golden Analysis for XAUUSD (Footprint 15m/60m/240m/1D)
🗓️ Date/Time: 3 October 2025 — 08:15 UTC+3
📊 Prices now: Ask 3851.77 / Bid 3851.47
Today’s levels from the footprint: 3863/3859 = intraday resistance — 3855 = Pivot — 3848/3840 = trading support — 3819 = deeper support.
15 Minutes (Scalping)
Price action: A quick buying thrust to 3851.7 then a sharp pullback; positive-delta candles at the top followed by negative-delta blocks = failed buying and quick distribution.
Volume: A volume explosion on the brief breakout, then calm with a negative tilt — the seller is holding the reins for the moment.
Range: 3859 ↔ 3848; every rise to 3855–3859 is met with offers (absorption).
60 Minutes
Internal trend: Down/sideways below 3860; a sequence of negative blocks on the minor highs.
VWAP/Fibo: Price is below the 3855 pivot and near the 50–61.8% retracement of yesterday’s wave, which favors an extension lower toward 3840 if the bounce fails.
4 Hours (240m)
Structure: After a weekly high, an orderly correction from the 3890s; the nearest important low is 3819.3, and a mid-balance zone is 3840–3828.
Momentum: Tilted to the downside with short-term lower highs.
Daily (General Trend)
Larger trend: Up, but with two clear days of profit-taking.
Candles/Volume: Longer upper wicks + elevated volume at the highs = distribution. Holding below 3860 keeps the corrective scenario open toward 3828–3819.
XAUMO’s Plan (Educational only, not advice)
The preferred scenario today: sell the pullback to the pivot.
Order Type Entry Stop Loss Take Profit Confidence
Main Trade Sell Limit 3855.20 3863.60 3838.00 🔥 81%
Reason (focused and straight):
3855–3859 is a repeatedly offered area (absorption + negative delta after a failed 15m thrust).
Staying below VWAP/Pivot 3855 = bearish bias toward 3840/3838.
60m structure is short-term down; any rise toward 3859 is likely just a pullback.
Alternative plan (if it rips upward):
Buy Stop 3864.20 → TP 3878.50 → SL 3856.80 only if a 15m candle closes above 3864 (price acceptance above resistance).
Invalidating the bearish scenario:
A steady close above 3864 cancels the short and shifts thinking to buying the breakout as above.
Risk management:
Risk ≤ 0.6% of capital; no chasing — keep your entry pending at the specified zone.
Conclusion: Today the market tends toward a corrective decline below 3860. Sell the pullback from 3855–3859 and target 3838; give new highs their due only if there is acceptance above 3864 — otherwise, the plan is bearish.

XAUMO GOLDEN REPORT - XAUUSD Technical Breakdown📊 XAUMO GOLDEN REPORT - XAUUSD Technical Breakdown
🗓 Date: Wednesday, October 1st, 2025
🔍 15-Min Chart (Scalping / Fast Entries)
Current Situation: Heavy sideways chop around 3863, low volume, neutral delta = no clear control by buyers or sellers.
Fib Levels: Price failed to hold above the 100% Fib (3875.45) and is now trading below 61.8%.
Pressure: No real bullish or bearish pressure → market in "decision-making" phase.
Decision: Stay OUT for now. Wait for a strong break above 3870 or below 3855 with high volume.
⏱ 1H Chart (Intraday Movement)
Momentum: Clearly fading, consistent negative delta, decreasing volume on the way up.
Fibonacci: After hitting the 125% level, price failed to push through 138% (a classic resistance zone).
Divergence: Negative delta divergence forming = buyers are losing strength while price tries to climb.
Decision: Watch 3858. A confirmed break opens the door to 3840 — fast pullback likely.
🕓 4H Chart (Mid-Term Outlook)
Trend: Still bullish, but the most recent candle shows clear loss of momentum.
Structure: Double top formation likely — two peaks without higher high breakout.
Support Zones: Strong support around 3840–3820 zone.
Decision: DO NOT buy highs. Wait for a correction or a strong 4H candle close above 3875.
🗓 Daily Chart (Macro Direction)
Overall Trend: Strong bullish trend still intact.
Volume: Volume is decreasing with each new high — clear volume divergence.
Candlestick: Today's daily candle might close as a "Spinning Top" — signaling indecision.
Warning: Market likely needs to breathe; profit-taking could be around the corner.
🔥 Final Summary & Hypothetical Trade (Not a signal – analysis only)
Order Type Entry Stop Loss Take Profit Confidence
Sell Sell Limit 3869.50 3875.50 3844.00 🔥 84%
🧠 Justification:
Strong resistance at the 100% Fib (3875).
High sell volume & inability to print new highs.
Negative divergence in Delta & Volume on lower TFs.
Signs of exhaustion showing up in recent candles.

MACRO CONTEXT & NEWS FLOW IMPACT — "WHY THE HELL IT MOVED"🔥 I. MACRO CONTEXT & NEWS FLOW IMPACT — "WHY THE HELL IT MOVED"
Yesterday’s move was a classic institutional fakeout followed by controlled accumulation. Today is retest day. Watch VWAP and order flow like a hawk. Don’t chase, wait for reversion and load at value.
📅 Date: July 30, 2025
📰 Event:
US Employment Cost Index: Lower than expected
Core PCE: Cooled off
Market Implication: Fed easing is now on the table.
DXY Weakens → Real yields drop → Gold gets bought like crazy.
👊 Institutional Logic:
Rate-sensitive assets (Gold, Bonds) exploded after the release.
Algorithmic reaction to macro signal: DXY down → XAU bid hard → MegaBar explosion.
BUT institutions needed liquidity to enter big → they faked a breakdown first.
That’s institutional deception 101.
📉 II. DAILY CHART ANALYSIS — THE BIG BOYS' GAMEBOARD
🗺️ Structure:
Price dropped from 3,355 to 3,258 in 3 days — a high-velocity markdown.
On July 30, Price printed a Megabar reversal (Massive range, delta-flush, volume spike).
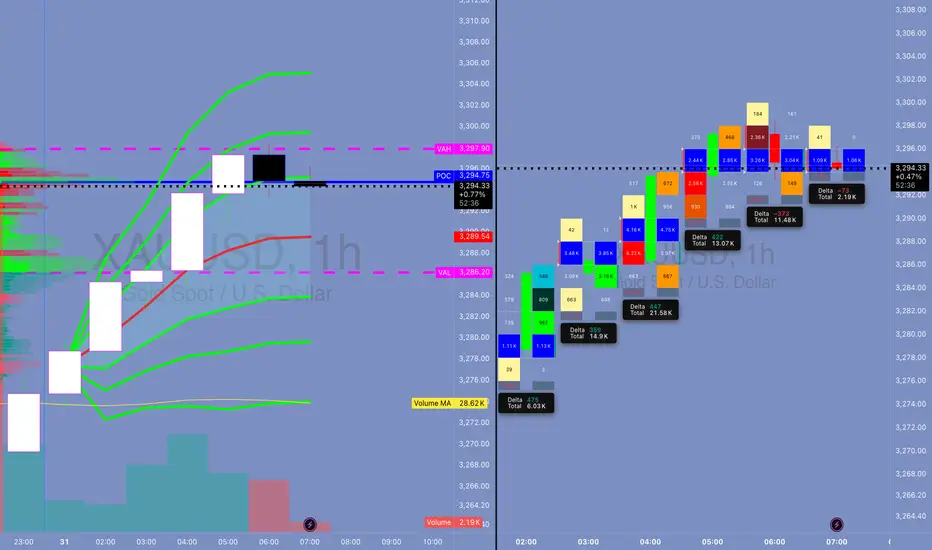
VAH = 3,294.90 capped upside.
POC = 3,288.91, and VAL = 3,282.90 held beautifully.
🔍 Institutional Pattern:
This is a classic “Flush > Absorb > Mark-up” sequence.
Textbook from “Technical Analysis and Stock Market Profits”:
“Volume confirms intention, range confirms commitment. A wide bar with climax volume at low implies the exhaustion of sellers and transfer of ownership.”
🔑 Key Daily Stats:
📉 Delta Flush: -584K
🔁 Reversal Delta: +70K
🔊 Volume spike: >450K (Well above 30-day volume MA)
💡 Inference:
This bar did not print because of retail buying. It’s smart money rebuying from panic sellers.
⏱️ III. 4H / 1H TIMEFRAME: ORDERFLOW & REACCUMULATION
📌 4H Chart:
📍 Megabar with -191K delta near 3,258 (Volume: 191.14K)
Immediate absorption by dark blue and green delta bars — this was not retail reversal.
VWAP reversion in play — price gravitates toward 3,294 (VWAP anchor zone)
🔁 1H Chart:
Rapid stair-stepping: Each hourly candle had higher lows and strong deltas.
Volume built from super-POC 3,289 to super-VWAP 3,295.25.
Final hour: exhaustion wick → distribution into resistance.
🧠 Institutional Tactic:
They used Volume by Price congestion to hold price between FVRP bounds:
Low Volume Nodes (LVNs) = acceleration zones
High Volume Nodes (HVNs) = consolidation + absorption zones
🔍 IV. 15M / MICROSTRUCTURE — WHERE THE GAME WAS REALLY PLAYED
🔬 VWAP Stack Analysis:
VWAP: 3,294.61
D-VWAP: 3,289.30
Super-VWAP Cluster held price in check — real institutional price magnet.
🔄 Delta Flow (15m):
Delta climbed from -3.15K → +3.21K in 1.5 hours.
Imbalance flipped bullish near POC.
🎯 FPVR Mapping (Volume Profile Right Side):
Thickest distribution volume occurred at 3,287 – 3,295
Value tightly packed = fair price.
Institutions are loading in value, not chasing.
⚙️ V. INDICATOR & MOMENTUM SIGNALS — INSTITUTIONAL CONFLUENCE ZONES
Tool Signal
VWAP Anchored VWAP tagged and respected — classic institution level
SMA50 Capped daily move (3,342) — still a long-term bearish lid
HMA5/9 Bullish crossover on 15m/1H – signals momentum alignment
Volume MA Volume climax confirms effort at lows, signaling phase change
🔩 VI. TECHNICAL SEQUENCING OF EVENTS (STEP BY STEP)
Asia Session: Tight range, price floats around VAL (3,282)
London Session: Fake breakdown to 3,258 – traps late shorts
NY Pre-News: Choppy price action within FRVP range
Macro News Drop: Megabar → -191K delta flush
Next Candle: Delta flips +21.2K → Absorption confirmed
Price Walks Up: Controlled bid to VWAP
End of Day: Distribution at VAH → price capped by VWAP band
💣 Final move = algorithmic mean reversion + VWAP auction completion
🧬 VII. ADVANCED ORDERFLOW INTERPRETATION
⚔️ MEGABAR (The Trap Setup):
Volume = 191K+
Delta = -191K (yep, full-on flush)
What happened?
→ Late shorts + stop runs + SL hunters got rekt.
→ Institutions absorbed, switched algo, and reversed.
🧱 FVRP (Fair Value Range Profile):
Defined by VAL (3,282.90) and VAH (3,294.90)
Institutions play inside this range for risk efficiency
They accumulate low and distribute high within it
🔄 Delta Rotation:
Delta Rotation = Shift from Negative Accumulation → Positive Distribution
Classic rotation confirms phase transition
🧠 VIII. INSTITUTIONAL OBJECTIVE (WHAT THEY WANTED)
Primary Goal: Create liquidity void below → Enter large long positions
Secondary Goal: Return to VWAP zone and unload
Tertiary Goal: Signal to market: "We're in control, stay out or get punished"
This is textbook Volume Profile Auction Theory in motion.
🎯 IX. HYPOTHETICAL TRADE SETUP (EDUCATIONAL PURPOSE ONLY)
🧾 Trade Plan: Institutional VWAP Reversion Play
Order Type: Buy Limit
Entry: 3,287.00
Stop Loss: 3,279.00 (below VAL & invalidation)
Take Profit: 3,300.00 (Super-VAH zone)
Confidence: 85%
R/R: 1:1.6
💡 Justification:
Entry at POC + SMA50 cluster
Stop below structural invalidation zone
Target near major supply
This is the exact playbooks funds run during reaccumulation rotations
🧠 X. EDUCATIONAL TAKEAWAY — WHAT YOU SHOULD LEARN
Volume is truth. If volume spikes at lows, it’s not weak hands — it’s smart money flipping.
VWAP is magnet. Everything mean-reverts back to VWAP in controlled auctions.
Delta tracks aggression. Sharp delta reversals = algorithm switch.
Megabar = signal. Huge candle + volume + delta = possible phase shift.
FRVP = roadmap. Price doesn’t move randomly — it moves to balance imbalances.
🔚 CONCLUSION — YESTERDAY’S LESSON
July 30, 2025 wasn’t just a bullish day — it was a textbook institutional deception-reversion cycle. If you understand:
How the news was used
How the megabar printed
How the volume clustered
How the VWAP held
… then you’re not trading blindly.
You’re trading with the damn architects of the market.
XAU/USD Strategy – Ride with the Market Maker, Not Against HimThis isn’t retail guesswork. This is institutional precision. You’re not reacting to the chart—you’re front-running the behavior behind it. If you want to trade like a market maker, you need to think like one. Accumulate where they accumulate. Strike where they strike. Exit before the blood spills.
Market Positioning Overview:
Gold is in a clear macro bullish phase. After confirming a textbook inverse head and shoulders breakout on the daily chart, price is targeting higher liquidity pools at 3389.50 and 3411.20. This isn’t noise—it’s calculated institutional movement. Market makers are in accumulation-to-expansion mode, and most retail traders will be slaughtered chasing false breakouts unless they understand how to align with this flow.
This strategy is not for amateurs. This is how institutional traders operate—mapping kill zones, front-running liquidity grabs, and riding the trend after the trap is sprung.
1. How Institutions Trade Gold:
Institutional price movement always follows this 3-phase structure:
• Phase 1 – Accumulation: Sideways price action to build large positions in stealth.
• Phase 2 – Manipulation: Quick stop hunts and false breakouts to generate liquidity and trap retail.
• Phase 3 – Expansion: Real directional move after the trap is full and stops are harvested.
You don’t predict any of this—you position inside the trap and ride the move when confirmation hits. Simple.
2. The Kill Zones: Where Smart Money Operates
Green Zone – Execution Zone (3350.5 to 3353.5):
This is where institutions are entering. It aligns with Fibonacci 61.8%, volume shelf, and the EMA/HMA cluster. If you’re buying, it’s here. You set your Buy Limit, wait for price to dip, and execute when the reversal candle confirms.
Yellow Zone – Accumulation Trap (3348.0 to 3355.0):
This is where market makers build their book. The price goes nowhere, volume contracts, and emotions run high. This is a no-trade zone. You wait. You observe. You let the breakout happen, then enter on the retest.
Red Zone – Manipulation Zone (3365.8 to 3372.2):
This is where retail gets wiped out. Breakouts above resistance here are bait. Market makers sweep stops and then reverse. You never chase here. You fade this zone only with volume divergence and reversal confirmation.
3. Confirmation Protocols: Trade Like a Professional
Ichimoku + Chikou Span (Heikin Ashi-Based):
If Chikou is above price and Kumo, trend is confirmed. Only go long if price is above the cloud with Chikou trailing clean air.
Stochastic RSI:
Enter long when %K crosses above %D below the 20 level—inside the green zone. Exit partials when you hit red zone and Stoch RSI turns down.
MACD:
You only enter if histogram bars are expanding upwards. Flat or fading momentum near resistance is a warning sign.
Volume Bollinger Bands:
Volume contraction followed by breakout spike = execution. Entry must be clean. No volume = no trade.
4. Trade Execution Plan: The Professional Setup
• Type: Buy Limit
• Entry: 3353.50
• Stop Loss: 3336.00
• Take Profit 1: 3389.50
• Take Profit 2: 3411.20
• Reasoning: Entry sits at Fib 61.8%, in the green zone, with clean structure. TP zones align with liquidity objectives of market makers. Risk/reward is asymmetrically favorable.
You don’t adjust the plan unless the market violates structure. This is a strategy, not a reaction.
5. Execution Rules of Engagement:
1. No trades inside the yellow zone. This is a trap. Be patient.
2. Do not chase breakouts in the red zone. Wait for the fakeout, then fade.
3. Only enter long from the green zone. That’s where smart money is.
4. Use Chikou and Volume for confirmation. No blind entries.
5. Cut losses with discipline. Stop belongs under the green zone—nowhere else.
6. Take profit at red zone or Fib extensions. That’s where liquidity gets harvested.

Margin Meltdown & the Golden Surge: How Tech Cracks Fueled Gold?Margin Meltdown & the Golden Surge: How Tech Cracks Fueled Gold’s Breakout in April 2025
Fear-Driven Flight to Gold is Real
If margin calls continue and top stocks like Microsoft and NVIDIA keep showing weakness:
• Expect more bond market stress
• A persistently weak dollar
• And a sustained gold rally
Gold is the cleanest beneficiary of the current chaos. Every chart, every data point, every political move validates it.
////////=====////////
What’s Happening in the Stock Market and Trump’s Tariffs – Simple Summary (Updated & Validated)
1. Margin Loans:
Many investors borrowed money using their stock portfolios as collateral. For example, if someone owns $100,000 in Microsoft stock (now trading at $388.45), they could borrow up to 90% of that value — $90,000 — and use it to buy other stocks like NVIDIA ($110.93).
2. Margin Calls:
When the market fell earlier this month, Microsoft and NVIDIA dropped sharply. Brokers issued margin calls, forcing investors to either deposit more funds or sell off assets to cover their positions.
3. Forced Selling:
As stocks fell further, more investors were forced to liquidate. This increased selling pressure pushed prices down even harder.
4. Vicious Cycle:
The deeper the drop, the more margin calls got triggered, which led to even more forced sales — a self-perpetuating loop of destruction.
5. Bond Selling Instead of Stocks:
Some investors didn’t want to sell their stock positions and instead began selling bonds to raise cash — including even U.S. Treasuries.
6. Bond Market Shock:
This rare, broad-scale bond selloff shook up the entire fixed-income market — everything from corporate to government bonds dumped.
7. Rising Yields:
As bond prices fell, yields spiked. But this wasn’t due to strong growth — it was pure fear-driven liquidation.
8. Unexpected Dollar Weakness:
Usually, during times of crisis, the dollar strengthens. But not this time. The U.S. dollar fell, while currencies like the euro and Swiss franc gained. The Chinese yuan stayed weak under its own pressures.
9. Trump’s Reaction:
In response to the chaos, Trump’s administration paused tariffs for 90 days — a political move under pressure. But the damage to market psychology was already done.
10. Tax-Loss Harvesting by Smart Investors:
During the crash, savvy investors sold declining stocks like Microsoft to lock in tax deductions, then bought similar alternatives like NVIDIA to stay in the market while writing off losses.
Impact on Gold (XAU/USD) – Real-Time Validation
As of April 12, 2025, Gold (XAU/USD) is trading at:
$3,235.91 (+$60.13 for the day | +12.02% over the past month)
Let’s validate the theory with what actually happened:
1. Gold vs. Stocks and Bonds:
While Microsoft and NVIDIA were collapsing earlier this month, gold surged. This shift confirms a flight to safety — gold became the preferred hedge during equity and bond volatility.
2. Falling Dollar = Bullish for Gold:
With the dollar under pressure, gold became cheaper in foreign currencies — driving international demand and pushing prices even higher.
3. Rising Yields – But Driven by Panic:
Normally, higher yields compete with gold. But this time, yields rose because bonds were being dumped, not because of economic strength. That fear drove even more capital into gold.
4. Policy Uncertainty:
Trump’s late response and inconsistent trade policies fueled further market unease. That pushed more investors toward gold as a non-political store of value.
5. Liquidity Crunch Risk:
Some gold may have been sold during the panic to raise quick cash, but overall, the trend shows that gold held firm and then broke out even harder — a textbook crisis hedge move.
Real Example: Microsoft and NVIDIA Margin Trap
Let’s walk through the actual setup:
• An investor owns $100,000 in Microsoft (MSFT at $388.45).
• They take a $90,000 margin loan to buy NVIDIA (NVDA at $110.93).
• Early April:
• MSFT dropped below $320.
• NVDA fell under $100.
This triggers:
• Margin calls.
• Forced selling of both positions.
• Possibly even bond liquidation.
• And systemic panic across portfolios.
Result?
• Tech sold off.
• Bonds dropped.
• Yields rose.
• Dollar weakened.
• Gold exploded.
///////======//////
Impact on Gold (XAU/USD): Real Events, Real Movement
• Microsoft & NVIDIA Down: Confirmed panic in tech.
• Bond Selloff = Higher Yields: But from fear, not confidence.
• Weaker Dollar: Confirmed.
• Gold Breakout: Real.
• RSI above 70
• ADX shows trend strength
• Volume surging
• Price broke $3,200 and held
Gold moved exactly how a textbook safe haven asset should behave in this
//////======///////
XAUUSD market behavior and trader mindset:
1. Monday: Continuation After Breakout (Euphoria Phase)
Psychological Insight:
Traders and institutions are chasing momentum. After a clean breakout, FOMO kicks in, especially for those who missed the first leg. They buy pullbacks aggressively, creating a bullish Monday.
Projection: Bullish continuation
Range: 3,230 – 3,270
Bias: Buy dips
Reason: Momentum from last week’s breakout still pushing higher. RSI >70 but not topping, and no reversal pattern on daily chart. Weak USD persists.
2. Tuesday: Pullback from Overextension (Reality Check)
Psychological Insight:
Once price pushes too far, short-term traders start locking profits. This creates a dip. But smart money (institutions) sees the pullback as cheap entry — especially with no bearish reversal confirmation.
This is textbook reaccumulation psychology.
Projection: Intraday pullback, then bounce
Range: 3,250 – 3,280
Bias: Buy on VWAP pullback
Reason: Small retracement likely due to overextension. Support at VWAP (~3,219). Bullish engulfing pattern might trigger dip-buyers.
3. Wednesday: Retest / Breakout (Conviction Phase)
Psychological Insight:
After a healthy pullback and hold, traders regain confidence in the trend. Breakout traders load in here — and weak shorts get squeezed. This is where bullish conviction peaks, triggering high-volume moves.
Projection: Breakout attempt
Range: 3,265 – 3,310
Bias: Scalpers can long breakout
Reason: If momentum holds, this is likely the day gold retests highs and pushes through short-term resistance (~3,300 psychological + fib extension zone).
4. Thursday: Sideways Chop (Indecision / Distribution)
Psychological Insight:
Market participants are split. Some want to hold into the weekend; others fear a Friday sell-off.
You see hesitation, tighter ranges, and volume drop-off — classic signs of short-term indecision and distribution by early buyers.
Projection: Consolidation / Sideways
Range: 3,280 – 3,310
Bias: Neutral-to-bullish
Reason: After a breakout, price typically stalls for distribution/re-accumulation. Expect reduced volatility unless triggered by macro news (watch bond yields).
5. Friday: Final Move (Greed vs. Fear Showdown)
Psychological Insight:
End-of-week decisions are all about book-squaring. If the week was strong and the narrative holds, we get greedy breakouts into the weekend.
If uncertainty creeps in (e.g. Fed noise, geopolitical tension), profit-taking overrides conviction, leading to a dip.
Projection: Second leg breakout or profit-taking
Range: 3,270 – 3,330
Bias: Depends on Thursday’s behavior
Scenario 1: If Thursday consolidates tightly, breakout possible.
Scenario 2: If extended already, profit-taking dip possible into close.
/////=====/////
Weekly Summary:
• High probability: Gold hits $3,300 – $3,330 this week
• Support zones: $3,219 (VWAP), $3,175 (previous breakout zone)
• Resistance zones: $3,298 (fib cluster), $3,330 (round number magnet)
This projection isn’t just TA — it’s behavioral trading at its core, based on how traders actually react:
• FOMO,
• profit-protection,
• fear of reversal,
• and end-of-week positioning.
Every day’s move is driven by human emotion wrapped around market structure.

XAUMO REPORT February 13th🔥 XAU/USD (Gold) Market Maker Roadmap & Trade Playbook: How to Trade Like a Shark 🦈
🔍 Mastering Market Maker Tactics: Liquidity Traps, Reversals & Smart Money Moves
Welcome to the ultimate step-by-step roadmap for trading XAU/USD like a market maker. This is not just a trading plan—it’s a dynamic guide that reacts to every move Gold makes. You’ll anticipate retail trader liquidations, institutional traps, and high-probability reversals. Let’s dive in.
📍 Step 1: Identifying the Battlefield (Multi-Timeframe Analysis)
Primary Timeframe: 30-Min Chart
• This is where the game is played—identifying liquidity zones, VWAP deviations, and smart money footprints.
Precision Entry Timeframe: 5-Min Chart
• Confirms exact execution points—look for order blocks, volume spikes, and fake breakouts.
Directional Bias Timeframes:
• 1-Hour Chart: Institutional activity and trend confirmation.
• 4-Hour Chart: Macro trend analysis and liquidity positioning.
• Daily Chart: The big picture—where market makers have set traps for the week.
📌 Step 2: Market Maker’s Liquidity Traps
🔹 Where Does the Shark Hunt?
🟢 Liquidity Pools Below Price (Retail Stop Loss Clusters)
• Key Buy Zone: $2,884 - $2,876 (Market makers hunting retail longs).
• VWAP Lower Band: $2,884 → Major support zone.
🔴 Liquidity Pools Above Price (Retail Stop Hunts Before Reversing)
• Key Sell Zone: $2,924 - $2,930 (Retail traders trapped at highs).
• VWAP Upper Band: $2,930 → Major resistance zone.
📊 Step 3: Entry Playbook – How the Market Maker Moves
📌 Entry Type 1: Normal Long (Buying the Dip in a Bullish Market)
Scenario: Price Drops into Liquidity Pool at $2,884 - $2,876
🟢 Entry (Buy Limit) → $2,884
🎯 TP1: $2,910 (POC Reversion)
🎯 TP2: $2,924 (Liquidity Grab)
🎯 TP3: $2,940 (Major Supply Zone)
🚨 SL: $2,874 (Below liquidity grab)
📈 TSL: Move stop-loss to $2,910 after TP1 is hit.
What-If Scenarios?
✅ What if price moves to TP1 ($2,910)?
• Secure 40% of the position (0.4 lots).
• Move SL to breakeven ($2,884).
✅ What if price moves to TP2 ($2,924)?
• Secure 30% of the position (0.3 lots).
• Adjust TSL to $2,910.
✅ What if price moves to TP3 ($2,940)?
• Exit final 30% of position (0.3 lots).
• Look for potential reversal short.
📌 Entry Type 2: Normal Short (Selling the Trap at Resistance)
Scenario: Price Rises into a Liquidity Trap at $2,924 - $2,930
🔴 Entry (Sell Limit) → $2,924
🎯 TP1: $2,910 (VWAP Reversion)
🎯 TP2: $2,884 (Liquidity Target)
🎯 TP3: $2,860 (Deeper Flush)
🚨 SL: $2,930 (Above liquidity trap)
📉 TSL: Move stop-loss to $2,910 after TP1 is hit.
What-If Scenarios?
✅ What if price moves to TP1 ($2,910)?
• Secure 40% of position (0.4 lots).
• Move SL to breakeven ($2,924).
✅ What if price moves to TP2 ($2,884)?
• Secure 30% of position (0.3 lots).
• Adjust TSL to $2,910.
✅ What if price moves to TP3 ($2,860)?
• Exit final 30% of position (0.3 lots).
• Look for bullish re-entry.
📌 Entry Type 3: Breakout Play (London & NYC Sessions)
Scenario: Price Breaks Above $2,924 with Strong Volume
🔵 Entry (Buy Stop): $2,926
🎯 TP1: $2,940 (Fib Extension)
🎯 TP2: $2,948 (Final Supply)
🚨 SL: $2,914
📈 TSL: Trail behind VWAP.
✅ What-If Scenarios?
🚀 If price rejects at $2,940, exit early.
⚠️ If price breaks down below $2,924, flip short.
📌 Entry Type 4: Fakeout Trap (Market Maker Reversal)
Scenario: Price Breaks Above $2,930, But Volume Fails
🔴 Entry (Sell Stop Below Fakeout): $2,926
🎯 TP1: $2,910 (VWAP Test)
🎯 TP2: $2,884 (Liquidity Pool)
🚨 SL: $2,940
✅ What-If Scenarios?
⚡ If volume spikes above $2,930, close the trade.
⚡ If price breaks down fast, hold until TP2.
🔄 Step 4: How to Scale In & Out Like a Market Maker
✅ Scaling In:
• Add 0.2 lots per VWAP test when price confirms direction.
• Example: Buy 0.5 lots at $2,884, then add 0.2 lots at $2,876 if confirmation appears.
✅ Scaling Out:
• TP1: Exit 40% of position.
• TP2: Exit 30% of position.
• TP3: Exit final 30% of position.
🔥 Step 5: Market Maker Playbook – Dynamic Adjustments
What Happens If…
✅ Gold Moves in One Direction Without Pullbacks?
• Use VWAP deviations & RSI overbought zones to time reversals.
✅ Gold Breaks a Key Level & Holds?
• Flip position & enter on pullback to broken level.
✅ Volume Spikes on a Level & Price Stalls?
• Exit 50% immediately & move SL to breakeven.
✅ Gold Fakes Out & Reverses?
• Look for MACD cross + RSI divergence & enter opposite trade.
📌 Step 6: Session-Specific Execution Plan
🎯 Tokyo Session (Scalping Liquidity Traps)
✅ Market Conditions:
• Lower volatility but accumulation phase for later sessions.
• Market makers set up liquidity traps.
✅ Best Trades:
• Buy VWAP Lower Band at $2,884, target $2,910.
• Scalp breakout above $2,910 to $2,924 if volume confirms.
✅ Key Risks:
• If price fails to hold $2,884, expect deeper retrace to $2,876.
• If liquidity trap at $2,924 triggers, expect NYC reversal.
🎯 London Session (Breakouts & Momentum Moves)
✅ Market Conditions:
• High volatility from European banks entering the market.
• Market makers manipulate price to liquidate both sides.
✅ Best Trades:
• Breakout Buy above $2,926 (only with strong volume).
• Short rejection at $2,924 resistance (fakeout trap).
• Buy liquidity sweep at $2,884 after fake breakdown.
✅ Key Risks:
• If price consolidates between $2,910-$2,924, expect NYC move.
• If breakout fails at $2,926, market will hunt $2,884 liquidity.
🎯 NYC Session (Volatility, Traps, and Trend Reversals)
✅ Market Conditions:
• Peak liquidity with high volume from US market open.
• Major liquidity traps executed before trend moves.
✅ Best Trades:
• Buy deep liquidity trap at $2,884 for reversal.
• Short rejection of $2,940-$2,948 liquidity grab.
• Breakout buy above $2,926 ONLY if supported by order flow.
✅ Key Risks:
• If price stalls at $2,924 resistance, expect mean reversion.
• If NYC starts with a fakeout, expect price to reverse aggressively.
📌 Step 7: Order Flow & Delta Analysis
🟢 Bullish Confirmation:
• Positive delta + increasing volume at support = Strong buy setup.
• Aggressive limit buyers absorbing sell orders at $2,884.
🔴 Bearish Confirmation:
• Negative delta + sell imbalances at resistance = Strong short setup.
• Market makers triggering buy orders at $2,924 before dumping price.
📌 Step 8: Institutional Execution Plan
📈 Scenario 1: Bullish Trend Continuation Setup
🔹 Criteria: Price holds above VWAP & MAs, bullish order flow.
🔹 Entry: Buy Limit at $2,884 or Buy Stop at $2,926.
🔹 TP1: $2,910, TP2: $2,924, TP3: $2,940.
🔹 SL: $2,874, move to breakeven at TP1.
🔹 Scaling: Add 0.2 lots per VWAP test.
📉 Scenario 2: Bearish Liquidity Trap & Reversal Setup
🔸 Criteria: Price rejects $2,924 resistance with high volume.
🔸 Entry: Sell Limit at $2,924.
🔸 TP1: $2,910, TP2: $2,884, TP3: $2,860.
🔸 SL: $2,930 (Above liquidity trap).
🔸 Scaling: Add 0.2 lots per new rejection at resistance.
📌 Step 9: Advanced “What-If” Management for Market Reactions
✅ What if price consolidates near VWAP $2,910?
• No trade until a breakout or liquidity sweep occurs.
• Wait for volume confirmation at key levels ($2,884 or $2,924).
✅ What if price breaks above $2,926 with strength?
• Hold longs to TP3 ($2,940) with trailing stop.
✅ What if price fakes out above $2,930 but fails?
• Flip short aggressively with TP at $2,910 and $2,884.
✅ What if price crashes below $2,876?
• Look for deep liquidity trap at $2,860 before re-entering long.
✅ What if momentum dries up in NYC session?
• Exit 50% of all positions & tighten SLs aggressively.
📌 Final Step: The Market Maker’s Complete Daily Game Plan
🔹 Buy the liquidity grab at $2,884.
🔹 Sell the retail trap at $2,924.
🔹 Only play breakouts with strong volume confirmation.
🔹 Avoid consolidation—trade the extremes.
🔹 Adapt dynamically—VWAP, RSI, order flow, and smart money tracking.
📌 This is how you dominate XAU/USD like a market maker—executing liquidity sweeps before the crowd reacts. 🦈
📊 Final Take: The Market Maker’s Daily Game Plan
🔹 Buy the liquidity grab at $2,884.
🔹 Sell the retail trap at $2,924.
🔹 Play breakouts with confirmation.
🔹 Adapt dynamically—use VWAP, RSI, volume, and order flow.
📌 This is how you trade XAU/USD like a true market maker, swallowing retail traders before they even realize what happened. 🦈

XAUMO Report & XAU/USD Institutional Trading Playbook📌 Executive Summary
This report consolidates the full-spectrum multi-timeframe analysis and trading strategy execution plan for XAU/USD. It provides precision-based entries, dynamic risk management, and advanced trade management techniques tailored for:
✅ Scalping (Tokyo Session)
✅ Breakouts (London Session)
✅ Volatility Setups (NYC Session)
The 30-minute chart serves as the primary execution timeframe, with 1H, 4H, and Daily charts providing macro-trend confirmation. Lower timeframes (5M/15M) are used for sniper entries.
This Institutional Trading Playbook integrates:
🔥 VWAP Deviations & Liquidity Traps
🔥 Ichimoku Kumo Structure & Fair Value Gaps (FVGs)
🔥 Order Flow, Delta Imbalances & Market Maker Manipulation
🔥 Multi-Timeframe RSI/MACD Divergence for Trade Precision
🔥 ATR-Based Dynamic SL/TP & Risk-Managed Scaling Strategy
📊 Multi-Timeframe Market Overview
1️⃣ Daily Chart (Macro Trend Context)
• Trend: Bullish, but nearing exhaustion at $2,942.59 (Key resistance).
• Key Levels:
• Support: $2,910.10 (VWAP Lower Band & Institutional Demand Zone)
• Resistance: $2,942.59 (Liquidity Cluster)
• Ichimoku Analysis:
• Kumo Thickness: Supports trend but signals potential mean reversion.
• Chikou Span: Above price, confirming bullish sentiment but extended.
2️⃣ 4-Hour Chart (Institutional Liquidity Zones)
• Bullish Trend, But Price Overextended from VWAP & MAs.
• Liquidity Zones Identified:
• Demand Zone: $2,910 - $2,915 (VWAP & SMA 50)
• Supply Zone: $2,940 - $2,945 (Market Maker Trap)
• Unfilled Fair Value Gaps (FVGs):
• $2,904 - $2,910 → High-probability retracement area.
3️⃣ 1-Hour Chart (Intraday Structure & Volume Profile)
• VWAP Anchoring:
• Upper Band: $2,942 (Market Maker Sell Zone)
• Lower Band: $2,910 (Buy Zone)
• Divergence Signals:
• RSI Overbought (75+) & MACD Bearish Divergence → Expect pullback.
4️⃣ 30-Minute Chart (Primary Trade Execution Chart)
• Trend: Bullish but nearing exhaustion above $2,942.
• Liquidity Traps Identified:
• Above $2,942 = Retail Buy Trap (Short Setup).
• Below $2,910 = Stop Hunt for Long Positions.
• VWAP Midline at $2,919.91 → Acts as a price magnet.
5️⃣ 5-Minute Chart (Precision Entry Execution)
• VWAP Interaction:
• Price consolidating around VWAP midline $2,919.91.
• Order Flow Analysis:
• Large Sell Orders Clustered Above $2,942 → Market Maker Activity.
🎯 Institutional Trading Playbook
✅ Entry Triggers (Technical Signals)
• VWAP Deviations
• 📌 Short when price sweeps above VWAP Upper Band ($2,942-$2,944).
• 📌 Buy when price retests VWAP Lower Band ($2,910-$2,912).
• Fair Value Gaps (FVGs)
• 📌 Unfilled FVG at $2,904 - $2,910 → Ideal Buy Zone.
• Ichimoku Triggers
• 📌 Bearish TK Cross Above Kumo = Short Setup Confirmation.
• 📌 Chikou Span Losing Momentum = Trend Exhaustion.
• RSI & MACD Divergences
• 📌 RSI Overbought + MACD Bearish Divergence = Sell Signal.
• 📌 RSI Oversold + MACD Bullish Crossover = Buy Signal.
• Delta & Volume Confirmation
• 📌 Institutional Sell Orders Above $2,942 = Short Setup.
📈 Key Trade Scenarios & Execution
Scenario 1: Liquidity Trap Short Setup (High Probability)
• Entry: $2,942 - $2,944
• Stop-Loss: $2,948 (Above liquidity zone)
• Take Profit 1: $2,921.50 (VWAP POC)
• Take Profit 2: $2,910.10 (Lower VWAP Band)
• Take Profit 3: $2,904 (FVG Completion Zone)
• Trailing Stop: Move SL to $2,929 after TP1.
• Risk-to-Reward: 1:3+
• Justification: Market Makers will trap buyers above $2,942 before initiating a stop-run.
Scenario 2: Trend Continuation Buy Setup
• Entry: $2,910 - $2,912
• Stop-Loss: $2,904
• Take Profit 1: $2,921.50 (VWAP POC)
• Take Profit 2: $2,930 (EMA 8 Resistance)
• Take Profit 3: $2,942 (Liquidity Exit)
• Trailing Stop: Move SL to $2,919 after TP1.
• Risk-to-Reward: 1:2.5+
• Justification: Institutional buyers will likely defend the $2,910 VWAP zone.
🔁 Dynamic SL/TP & Trade Management
ATR-Based Dynamic Stop-Loss Adjustments
• Short Setup SL: Above ATR deviation at $2,948.
• Long Setup SL: Below ATR deviation at $2,904.
Scaling Strategy
✅ Short Entry Scaling:
• First Entry: $2,942
• Second Entry (Add-on): $2,945 (If liquidity sweeps higher)
✅ Buy Entry Scaling:
• First Entry: $2,910
• Second Entry (Add-on): $2,905 (If deeper retracement)
📊 Session-Specific Strategies
Tokyo Session (Scalping)
• Trade Setup:
• Buy $2,910 - $2,912, TP $2,921.
• Short $2,942 - $2,944, TP $2,921.
• Justification: VWAP deviations + liquidity traps.
London Session (Breakout Play)
• Trade Setup:
• Buy if price holds $2,910, TP $2,942.
• Short if price rejects $2,942, TP $2,910.
• Justification: Higher liquidity → More trend confirmation.
NYC Session (Volatility Play)
• Trade Setup:
• Watch for fakeouts above $2,942 or below $2,910.
• Justification: NYC session = Market Maker reversals.
🔥 Conclusion & Next Steps
✅ Market Makers likely to trap buyers above $2,942 before reversing.
✅ Short from $2,942 - $2,944, target $2,910 - $2,904.
✅ Buyers should wait for a retrace to VWAP lower band ($2,910).
✅ Execution must be precise, using volume confirmation & order flow mechanics.

XAUMO Strategy – GOLD (XAU/USD) for Monday, Feb 12, 2025 Market Overview – The Smart Money Play
🔹 Gold (XAU/USD) trading around $2,860-$2,861 – Bulls still in control on higher timeframes but showing signs of exhaustion.
🔹
Liquidity traps above $2,875-$2,880 – Institutions baiting late buyers.
🔹
Volume decreasing at resistance – Smart money unloading positions.
Translation? Market prepping for a trap & reversal play before the next expansion.
📌 XAUMO SESSION BREAKDOWN & EXECUTION PLAN
🔴
1) Asia Session: Market Balance & Trap Setup
Price Action: Tight consolidation, low volatility, setting up liquidity grab.
Volume: Diminishing – classic pre-move buildup.
Liquidity Zones: Buyers trapped above $2,875-$2,880.
Key Levels:
Support: $2,850-$2,855
Resistance: $2,870-$2,875
🚨 Game Plan:
If price spikes into $2,875-$2,880, look for a reversal short.
If price drops to $2,855 and holds, expect a bounce.
✅ Trade Setup:
📉 Sell Limit: $2,875
🎯 Target: $2,855 > $2,845
❌ Stop Loss: $2,883
🟡
2)London Session: Expansion & Trend Confirmation
Price Action: Market picks a direction – we trade the retest.
Volume: If RVOL spikes, expect breakout move.
Liquidity Zones: Order blocks forming at $2,850-$2,855.
Key Levels:
Bullish if price holds $2,855, expect $2,880+.
Bearish if rejection at $2,875, expect $2,840-$2,830.
🚨 Game Plan:
Watch for fake breakouts at session highs/lows.
VWAP & POC confirm bias.
✅ Trade Setup:
📉 Sell if $2,872 rejects
🎯 Target: $2,850 > $2,835
❌ Stop Loss: $2,881
🟢
3) NY Session: Institutional Moves & Volume Surge
Price Action: The real move happens here – Smart Money decides direction.
Volume: If RVOL > 1.5, trend continuation is confirmed.
Liquidity Zones:
$2,875-$2,880 – Bull Trap Zone
$2,840-$2,830 – Sell-Side Liquidity
🚨 Game Plan:
If price fakes out above $2,875 & dumps, SELL HARD.
If NY session defends $2,855, BUY THE DIP.
✅ Trade Setup:
📉 Sell below $2,850
🎯 Target: $2,830 > $2,815
❌ Stop Loss: $2,860
📈 Buy if price reclaims $2,860 after fakeout.
🎯 Target: $2,880 > $2,885
❌ Stop Loss: $2,852
FINAL XAUMO EXECUTION STRATEGY
If price spikes to liquidity levels, fade the move.
🔸
If VWAP & Delta confirm direction, ride the trend.
🔸
Use session highs/lows as liquidity magnets.
🔸
If RVOL confirms strength, scale in aggressively.

Tokyo Session Analysis (30-Minute Timeframe) – XAU/USDXAUMO REPORT
1. Market Structure & Price Action Behavior
• Session Overview:
• Price ranged between 2,737.77 (Low) and 2,745.14 (High) during Tokyo.
• Small-bodied candles indicate low volatility and accumulation.
• Institutional players likely absorbed liquidity below 2,738 before a bounce.
• Retail Traders’ Behavior:
• Scalpers targeted small pullbacks between 2,741-2,743.
• Many stop-losses likely triggered below 2,738, where institutions absorbed liquidity.
• Institutional Traders’ Behavior:
• POC (Point of Control) at 2,742.36 suggests institutions accumulated here.
• They possibly induced liquidity sweeps near 2,738-2,737 before positioning long.
2. Volume Profile Data
• POC (Point of Control - Highest Volume Traded Level):
• 2,742.36 → Institutions built positions here, making it a key level.
• Value Area:
• VAH (Value Area High): 2,745.14
• VAL (Value Area Low): 2,738.24
• Market Implication:
• Trading above VAH (2,745.14) could trigger a breakout toward 2,748.06+.
• Trading below VAL (2,738.24) could push price toward 2,736.22 or lower.
3. VWAP & Institutional Bias Comparison (Yesterday vs. Today)
• VWAP Levels (Tokyo Session):
• VWAP High: 2,745.38
• VWAP Low: 2,737.77
• VWAP Median: 2,741.09 (Price is hovering near it).
• Relative VWAP Comparison to Yesterday:
• Price is trading within yesterday’s value area, suggesting market indecision.
• If price holds above VWAP Median (2,741.09), expect a bullish continuation in London.
• If it fails and breaks below VWAP Low (2,737.77), institutions may hunt deeper liquidity before reversal.
4. Major Fibonacci Levels (Based on Tokyo Range)
• Fib Levels from Tokyo High (2,745.14) to Low (2,737.77):
• 23.6% Retracement: 2,739.67 (Already tested).
• 38.2% Retracement: 2,741.09 (Key VWAP zone).
• 50.0% Retracement: 2,741.83 (Currently at resistance).
• 61.8% Retracement: 2,742.52 (Next resistance).
• 78.6% Retracement: 2,743.95 (Final barrier before breakout).
→ If price clears 61.8% (2,742.52), expect upside continuation to 2,748.06.
Tokyo Session Key Takeaways:
✅ Institutional Buying Zone: 2,738-2,737
✅ POC Control Level: 2,742.36
✅ VWAP Battle Zone: 2,741.09 (median)
✅ Breakout Trigger: Above 2,745.14 (VAH)
✅ Downside Warning: Below 2,738 (VAL), liquidity grab possible.
🔥 London Session Outlook:
• If price holds above VWAP & POC (2,742) → bullish continuation to 2,748.06.
• If price rejects VWAP & fails below 2,738, institutions may hunt stops at 2,736.22 before a bounce.
Stay sharp. Market makers are setting traps before the next move. 🔥

XAUMO Weekly Report: Institutional Playbook for XAU/USDXAUMO Weekly Report: Institutional Playbook for XAU/USD (Gold Spot)
Crafted for Institutional-Grade Market Maker Operations
This report provides a comprehensive institutional-grade strategy for XAU/USD, integrating:
Advanced analytics
Market-maker insights
Multi-timeframe projections
With the Institutional Weekly Playbook: XAU/USD indicator, this playbook equips traders with precision tools to:
Stay ahead of the market
Capitalize on institutional behaviors
Weekly Market Context: Building the XAUMO Narrative
Previous 3 Weeks Overview
Bullish Momentum in Control
Strong bullish movement observed, breaking resistance and holding higher zones.
XAUMO Insight:
Institutional buyers defended $2,683, with $2,700 becoming a critical psychological level.
Liquidity Manipulation
Market-Maker Moves:
Exploitation of liquidity pockets above $2,692 and below $2,683.
Retail traders systematically trapped with sudden reversals around VAHs (Value Area Highs) and VALs (Value Area Lows).
Volume and POC Interplay
Weekly POC ($2,688):
Acts as a central magnet, reflecting institutional accumulation and retail indecision.
Current Weekly Trend Analysis
VWAP Anchored Levels (XAUMO Indicator):
Upper Band ($2,710-$2,726): Institutional profit zones.
Median VWAP ($2,688): Consolidation magnet.
Lower Band ($2,675-$2,660): Institutional buying opportunities.
Momentum Analysis
ADX Levels: Moderate strength, favoring cautious continuation.
Moving Averages: Price remains above EMA 8 and SMA 50, confirming short-term bullish trends.
XAUMO Key Levels for the Week
Primary Levels of Focus
$2,683 (VAL):
XAUMO Insight: Key support level.
Impact: Holding keeps bullish momentum intact; breaking signals potential bearish movement to $2,675.
$2,688 (POC):
XAUMO Insight: Central magnet level.
Impact: Expect price consolidation or reversals here.
$2,692 (VAH):
XAUMO Insight: Critical breakout level.
Impact: Locking above signals bullish continuation.
XAUMO Bullish Targets
$2,700:
First resistance level and psychological target for breakout traders.
$2,710-$2,726:
Final institutional profit zones.
XAUMO Bearish Targets
$2,675:
Short-term support zone; potential liquidity grabs expected.
$2,660:
Strong buying base for institutions.
$2,650:
Ultimate downside liquidity level.
XAUMO Weekly Playbook
Scenario 1: Bullish Breakout Above $2,692
Market-Maker Logic:
Breaking $2,692 signals institutional buying, targeting stop-loss clusters near $2,700 and $2,710.
XAUMO Targets:
$2,700: Retail FOMO trigger.
$2,710-$2,726: Institutional profit zones.
Shark Moves:
Trap breakout buyers near $2,700-$2,710, then reverse sharply to $2,688.
Scenario 2: Bearish Breakdown Below $2,683
Market-Maker Logic:
Breaking $2,683 triggers retail panic, enabling institutions to accumulate at discounted prices.
XAUMO Targets:
$2,675: Intermediate support.
$2,660: Institutional buying base.
$2,650: Final liquidity grab.
Shark Moves:
Sweep stop-losses below $2,675, then reverse aggressively to $2,688.
Scenario 3: Range-Bound Play ($2,683-$2,692)
Market-Maker Logic:
Indecision in this range allows sharks to exploit both retail buyers and sellers.
XAUMO Playbook:
Short at $2,692: Target $2,688 and $2,683.
Buy at $2,683: Target $2,688 and $2,692.
Shark Moves:
Fake breakouts and breakdowns to clear stop-losses on both sides.
XAUMO Daily Projections
1-Monday:
Focus: Define weekly range ($2,683-$2,692).
Shark Action: Trigger false breakouts to lure retail traders.
2-Tuesday:
Focus: Attempt breakout or fakeout near key levels.
Shark Action: Reverse direction mid-session to trap retail traders.
3-Wednesday:
Focus: Push price toward $2,700 or $2,675 during session overlaps.
Shark Action: Clear stop-losses at mid-week highs/lows.
4-Thursday:
Focus: Reversal day. Look for shifts from mid-week extremes.
Shark Action: Create FOMO near mid-week trendlines, then reverse sharply.
5-Friday:
Focus: Weekly close near $2,688.
Shark Action: Use thin liquidity to exaggerate moves and confuse retail traders.
Leverage the Institutional Weekly Playbook: XAU/USD Indicator
This report is complemented by the Institutional Weekly Playbook: XAU/USD Indicator, a free-to-use tool tailored for institutional-grade analysis.
Key Features:
Dynamic Levels: VAL, VAH, POC, VWAP bands, stretch targets, and ultimate support.
Multi-Timeframe Analysis: Align with institutional logic using daily and weekly projections.
Visual Clarity: Labels on key levels for immediate recognition.
Market Maker L
ogic: Anticipate traps and exploit liquidity zones.
Empower your trading with this tool:
Track institutional movements.
Avoid retail pitfalls.
Execute trades with precision, aligning
with the sharks.
Final Notes for XAUMO Traders
1-Monitor Key Metrics:
VWAP ($2,660-$2,726)
Volume surges and ADX momentum (>25)
2-Anticipate Market-Maker Tactics:
Liquidity sweeps at $2,692 (upside) and $2,683 (downside).
Retail traps with fake breakouts and sudden reversals.
Trade like the sharks with this XAUMO Weekly Report and the Institutional Weekly Playbook: XAU/USD indicator. Align your trades with institutional flows for success.
Signed:
ICHIMOKUontheNILE
Mastermind Behind XAUMO Analytics
