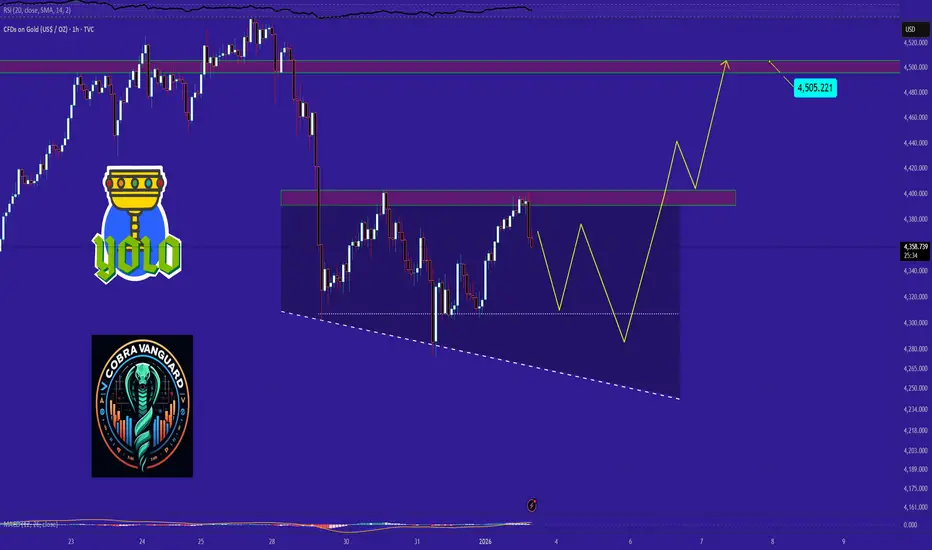
GOLD's SituationWe can be hopeful that after breaking out of the wedge, we will see significant price growth.AB=CD
Best regards CobraVanguard.💚
Give me some energy !!
✨We spend hours finding potential opportunities and writing useful ideas, we would be happy if you support us.
Best regards CobraVanguard.💚
Xausd
XAUUSD Daily: Tightening Trendlines Ahead of High-Impact Events
Gold remains in a strong bullish structure on the daily chart, but price action is now approaching a critical juncture where multiple trendlines are tightening and converging. This compression typically precedes a breakout, and given the current macro backdrop, volatility is expected to rise.
Key technical levels to watch:
Resistance Zones:
4,352 – Psychological level and short-term pivot (PDH and PWH)
4,381 – Upper resistance and breakout target (previous record high).
Above 4,381, the path opens toward new record highs.
Support Belt:
4,320 – 4,300 – Strong demand zone; as long as this area holds, selling remains unattractive.
The price is currently consolidating near the upper channel boundary, signaling potential energy buildup for the next directional move.
Macro Drivers & Volatility Risks
Today’s calendar is packed with high-impact events that could significantly influence the U.S. Dollar Index (DXY) and, by extension, gold:
BoE Interest Rate Decision
ECB Interest Rate Decision
U.S. CPI Data
Initial Jobless Claims
These events collectively create a scenario for heightened volatility, as markets reassess inflation trends and central bank policy stances.
Trading Scenarios
Bullish Breakout:
A decisive move above 4,352 will likely accelerate momentum toward 4,381, with potential extension to new record highs beyond that level.
Support-Based Entry:
If price retraces into the 4,320 – 4,300 belt, this zone offers a favorable risk-reward for long positions.

XAU/USD analysisFollowing the appreciation observed in October, the XAU/USD pair has entered a phase of consolidation, currently trading in the vicinity of 4.173 as it nears the apex of a symmetrical triangle formation. From a technical standpoint, the "Weak High" at 4.220 is a notable liquidity target, reinforcing the potential for upward momentum consistent with the prevailing bullish trend. Nevertheless, given the current price compression and the impending economic data releases, a prudent approach is advisable over immediate market engagement. A definitive breakout is required for clarity; a decisive breach of the 4.190 resistance level would confirm a bullish trajectory, whereas a close below 4.130 could exacerbate selling pressure. Consequently, the optimal strategy at this juncture is to await the asset’s departure from the consolidation zone to ascertain the market’s directional intent clearly.

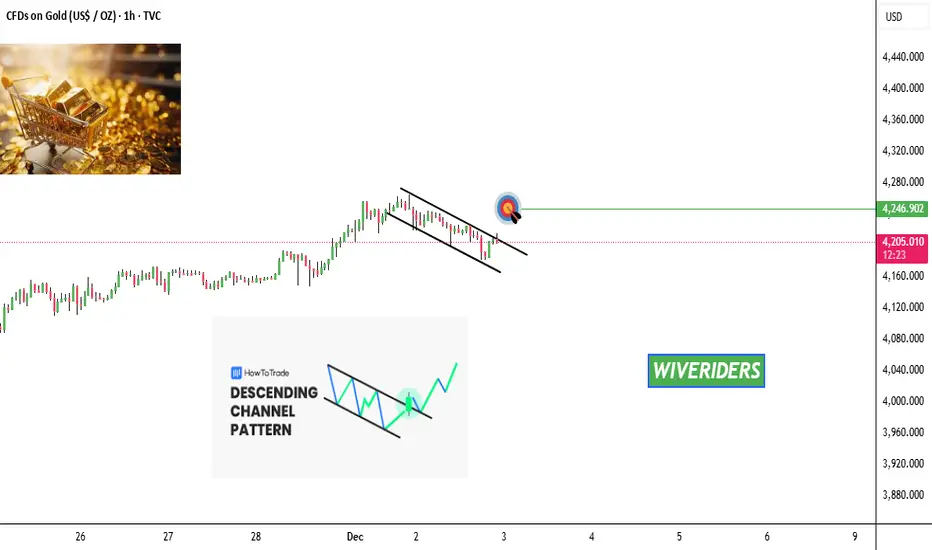
GOLD is forming a descending channel pattern 📊 GOLD Update
GOLD is forming a descending channel pattern 🔻📉 —
a structure that often leads to a strong move once price breaks out.
Right now, price is still moving inside the channel,
but if GOLD breaks above the descending trendline,
we could see momentum shift and price push toward the first target at the green line level 🟩.
Here’s the key breakdown:
Pattern: Descending Channel
Bullish signal triggers ONLY if we break out upward
A clean breakout = momentum toward the green target zone
Until breakout, sellers remain in control inside the channel
Watch for:
✔️ Strong breakout candle
✔️ Volume confirmation
✔️ Retest holding as support (optional but bullish)
If breakout happens → first target = green line level 🟩
XAUUSD - Liquidity Storytelling Through Structure.🔶 Welcome to Liquidity Atlas — The Footprint Journal of XAUUSD
Gold continues to operate inside a liquidity-defined environment with a very clear distribution of resting pools and inefficiencies.
After the BOS, price expanded into a new range and began building repeated swing highs — each one reinforcing sell-side liquidity engineering and creating a clean cluster of liquidity labeled as SSS on the chart.
Below, one major point stands out:
a deep discount liquidity pool sitting around the blue zone, an area where price previously delivered impulsively and left inefficiencies unbalanced.
Markets rarely ignore untouched inefficiency for long — imbalance is the algorithm’s unfinished business.
Above price, we also hold a SIBI zone coupled with a previous swing high point.
The LH marks an area of premium where earlier rejection occurred, but inefficiency remains open — meaning there is unfilled narrative above, even while discount liquidity sits untouched beneath.
This creates a two-sided story, where liquidity exists both above and below, and the next sweep reveals intention.
This is not about predicting direction — it’s about understanding flow:
• BOS established a directional shift.
• SSS zones reflect engineered liquidity.
• The lower blue region remains a draw if displaced.
• SIBI overhead remains unmitigated inefficiency.
Whichever side gets liquidated first may reveal the algorithmic path — whether rebalancing inefficiency below or tapping into unmitigated premium inefficiency above.
The narrative is already in the structure. Price is simply writing the next chapter.
— Liquidity Atlas | Reading Imbalance, Not Guessing.

Gold Moves Exactly as PlannedHey traders!
In my previous analysis, I mentioned that I expected a price correction — and gold perfectly followed the plan, dropping from 4150 to 4096, giving us a great profit!
As anticipated, the bullish move has now started, aiming for the target shown on the chart.
Follow me for more updates and fresh analyses! 🚀💰

Gold compression before expansionGold remains in a controlled accumulation phase after a strong move, holding rising lows and respecting the fair value zone near 3990. As long as buyers defend the 3985–4000 range, the setup favors a false dip and re-entry scenario with continuation higher. A clean break and hold above 4040 unlocks the first target at 4110, and extension toward 4200 remains valid on structural expansion and Fibo alignment. The market is balanced on a hinge: levels are defined, buyers present, but confirmation lies only in price reclaiming the breakout zone.
Fundamentally gold still tracks macro uncertainty. Rates, inflation expectations, dollar hesitation and US debt dynamics keep capital rotating defensively. This is one of those periods where expectations and reality diverge, and the longer the compression holds, the stronger the eventual move. Still, discipline first — price must confirm above 4040.
Bias remains bullish while above 3985. Break below opens a corrective path toward 3920–3890 before another attempt higher.

Gold Outlook after the Dip. What to expect NOW?The price correction has ended, and the price is now in a strong support zone according to Fibonacci levels. From this point onward, the price is expected to rise and retest its previous high.

GOLD NEXT TARGET XAUSDGOLD NEXT TARGET XAUSD as per trend and Gann value. market will reach 3850 target 2 before July 2025. Target will ready to achieve in a week seems. lets wait for market move.

Gold Faces Rejection at Supply Zone, Bearish Retracement Gold (XAUUSD) is currently trading around 3,711 after a strong bullish rally but has reached a key supply zone, where rejection is likely. The chart indicates a potential bearish move, with price expected to retrace downward toward the 3,646–3,650 target zone. This move aligns with the marked order blocks and fair value gap, suggesting sellers could step in at current levels.

Potential bearish drop off?The Gold (XAU/USD) has reacted off the pivot and could drop to the 1st support which acts as a pullback support.
Pivot: 3,674.77
1st Support: 3,624.94
1st Resistance: 3,697.75
Disclaimer:
The above opinions given constitute general market commentary, and do not constitute the opinion or advice of IC Markets or any form of personal or investment advice.
Any opinions, news, research, analyses, prices, other information, or links to third-party sites contained on this website are provided on an "as-is" basis, are intended only to be informative, is not an advice nor a recommendation, nor research, or a record of our trading prices, or an offer of, or solicitation for a transaction in any financial instrument and thus should not be treated as such. The information provided does not involve any specific investment objectives, financial situation and needs of any specific person who may receive it. Please be aware, that past performance is not a reliable indicator of future performance and/or results. Past Performance or Forward-looking scenarios based upon the reasonable beliefs of the third-party provider are not a guarantee of future performance. Actual results may differ materially from those anticipated in forward-looking or past performance statements. IC Markets makes no representation or warranty and assumes no liability as to the accuracy or completeness of the information provided, nor any loss arising from any investment based on a recommendation, forecast or any information supplied by any third-party.

XAUUSDHello Traders! 👋
What are your thoughts on XAUUSD?
Gold has been moving within a medium-term ascending channel and recently managed to break above a major resistance area that had previously rejected price multiple times.
Currently, the price is facing a psychological and technical barrier at the $3500 level, acting as the next resistance.
Price is expected to consolidate slightly below $3500 before attempting another push higher.
As long as price holds above the broken resistance and stays within the ascending channel, the bullish outlook remains valid.
A successful breakout above $3500 could open the path toward targets at $3600 – $3700-$3900 in the medium term.
Don’t forget to like and share your thoughts in the comments! ❤️

XAUUSD | Weekly Fakeout → Wedge Breakout | Targeting 3508+🔔 Summary:
Reclaimed liquidity, broke wedge structure with strength, and printed continuation signs.
Expecting bullish move toward 3,508 on higher timeframe if breakout holds.
Will reassess if price closes below 3,314 (invalidates short-term momentum).
🔔 Long Version:
📝 Description:
📆 Date: 2nd August 2025
📊 Timeframe: Weekly → Multi-TF Analysis
📈 Bias: Bullish
🧠 Setup: High-volume breakout from descending wedge + weekly fakeout/liquidity sweep.
⸻
🧱 Structure
• Weekly fakeout below trendline rejected with strength
• 4H bullish engulfing candle broke through EMA stack and wedge resistance
• Price retested previous Fair Value Gap (FVG) and confirmed buyer strength
• Strong volume spike and MACD momentum shift confirmed breakout conviction
📊 Indicators
• EMAs: Price above 20/50/100/200 on H1 & 4H
• MACD: 4H flipping bullish, Weekly still holding green
• Volume: Significant bullish breakout candle, multi-timeframe confluence

GOLD Range-Bound Before Fed – Breakout Above 3349 Unlocks 3374GOLD | Bullish Momentum Builds Ahead of Fed Decision – Key Range Between 3349 and 3312
Fundamental Insight:
Gold is slightly higher as the U.S. dollar weakens ahead of the Fed’s rate decision. Markets await signals on future policy, which could drive sharp moves in gold.
Technical Outlook:
Gold remains bullish while above 3320, with upside potential toward 3349.
A 1H close above 3349 confirms breakout momentum, opening the path toward 3374, and potentially 3401.
A break below 3320, especially below 3312, would invalidate the bullish setup and trigger downside toward 3285, then 3256.
Currently range-bound between 3349 and 3312 — watch for breakout confirmation to determine the next trend direction.
Key Levels:
• Support: 3320 – 3285 – 3256
• Resistance: 3349, 3374 – 3401
Bias: Bullish above 3320
📍 Watch Fed volatility – breakout expected soon

"The Great Gold Heist" – XAU/USD Master Plan🏆 "The Great Gold Heist" – XAU/USD Master Plan (High-Risk, High-Reward Loot!) 🚨💰
🌟 Attention, Market Robbers & Money Makers! 🌟
Hola! Oi! Bonjour! Hallo! Marhaba! 🤑💸
🔥 Based on the legendary Thief Trading Strategy (technical + fundamental heist tactics), here’s our blueprint to STEAL massive profits from the XAU/USD (Gold vs. Dollar) market! 🔥
🎯 The Heist Plan (Long Entry Setup)
Entry Point 📈: *"The vault is UNLOCKED! Swipe bullish loot at any price—but for a cleaner steal, set Buy Limits within 15-30M recent swing lows/highs. ALERT UP! ⏰"*
Stop Loss 🛑: "Thief’s SL hides at the nearest swing low (4H TF: 3310.00) OR below the last daily candle wick. Adjust based on your risk appetite & lot size!"
Target 🏴☠️: 3440.00 (or escape early if the cops—err, bears—show up!)
⚡ Scalper’s Quick Loot Guide:
"Only scalp LONG! Rich? Go all-in. Broke? Join the swing traders & rob slow ‘n’ steady. Use Trailing SL to lock profits!"
📊 Market Status:
XAU/USD (GOLD) – Neutral (But Bullish Sneak Attack Likely! 🐂💥)
"The heist is ON, but watch for traps—overbought zones, consolidation, and bearish robbers lurking!"
🔍 Pro Thief Moves:
✅ Fundamentals Matter! (COT Reports, Geopolitics, Macro Data, Sentiment—check our Bii0 for the full loot list!) 🔗👉🏻☝🏻 klik lin.kk
✅ News = Danger! Avoid new trades during releases. Trail your SLs to protect stolen cash! 📰🚨
💖 Support the Heist Crew!
"Hit the BOOST BUTTON 💥 to strengthen our robbery squad! More boosts = easier money steals daily!"
🚀 Stay tuned—another heist drops soon! 🐱👤💎

XAUUSD – Support Under Threat, Deeper Decline LoomsGold is stalling below the 3,444 USD resistance, forming a series of lower highs — a clear sign of weakening bullish momentum. The support area around 3,358 USD is under pressure, and a break below this level could trigger a drop toward 3,280 USD.
On the news front, the FOMC has reaffirmed its hawkish stance, making no mention of a rate cut despite signs of slowing economic growth. This has strengthened the USD, placing additional downward pressure on gold.
In summary, XAUUSD is on the verge of breaking its bullish structure. If current support fails, sellers may take full control of the market.
XAUUSD Trade Idea:
Position: SELL if price breaks below 3,358 USD
Target: 3,304 – 3,280 USD
Stop Loss: Above 3,400 USD

Gold’s in a Trap — And That’s Exactly Why You Should Be CarefulGold is stuck in a tight sideways range. It’s been bouncing between $3,370–$3,380 for two days now. Everyone sees it. Every trader watching gold knows this level acted as support — and judging by the candle shadows, buyers are getting aggressive here.
So if you're purely technical — yeah, looks like a solid buy right now.
But here’s the twist…
___________________________________________________________
I’m not buying.
And I’ll tell you why — because it's too obvious.
When something screams "buy" from every chart and every textbook, that’s when you pause and ask yourself:
“Am I about to walk into a classic setup… or actually catch a real move?”
Because history shows us — these textbook setups often play out like this:
Motivation → Encouragement → Payback. (See Chart 2)
It goes like this:
Price breaks a visible high or low (Motivation)
Traders jump in and get some pips(Encouragement)
Then — brutal reversal (Payback)
Only then will everything get off the ground, and it will be fast, so that the "unnecessary" passengers who were "dropped off" should not have time to return to this train. So why are they "unwanted"? Well, here's one possible answer: because retail tends to hold losing trades too long , but gets spooked early on winners. We’re wired that way.
So what happens when everyone starts booking profits after a small bounce?
You get limit sell orders piling up , slowing momentum — sometimes even flipping the trend.
And then what do big players do?
Then come back in — buying at higher levels, averaging their positions. Not the best case scenario....
Key Takeaway:
______________________
Here’s my advice — especially if you’re in this game long-term:
1. Avoid those super obvious setups everyone else is jumping into.
2. Instead of asking, "Why should I open a trade now?"
Try asking: "Why shouldn’t I open a trade now?"
p.s.
If you liked this kind of deep-dive — follow along. We don’t just read charts. We read the market behind them.
Conclusion:
_________________________
📍 Gold is testing a key zone — but don’t let the crowd pull you in.
🧠 The first quick impulse is often a trap
📈 Stay sharp, stay ahead.


Gold Buy/Sell Zone Bana Diya Ha Kya Yahaan Sa Trade Leba Safe HaGold ka latest price action dekhte hue maine TradingView par Buy aur Sell zones clearly mark kar diye hain.
Iss chart idea mein aapko milega:
✅ Fresh zones jo price respect kar sakta hai
✅ Kya aap is zone ko dekh kar trade le sakte ho?
✅ Confirmation signals ka short breakdown
✅ Risk management aur entry tips
Agar aap Gold (XAUUSD) mein trading karte ho to yeh chart aapke liye game-changer ban sakta hai.
Chart idea check karein, analysis samjhein aur informed decision lein!
📈 Follow karo aur ko like/share karna na bhoolein!
#GoldAnalysis #XAUUSD #BuySellZone #TradingView #PriceAction #ForexTrading #GoldTrade

Massive Breakout in EUR/USD – Time to Ride the Trend?📊 EUR/USD Daily Technical Outlook – April 11, 2025
The euro-dollar pair (EUR/USD) continued its upward momentum on Friday, reaching a high of $1.1473 before closing at $1.1352. This movement reflects a significant appreciation of the euro, influenced by a weakening U.S. dollar amid escalating trade tensions and a selloff in U.S. Treasuries.
📈 Current Market Structure:
After consolidating earlier in the week, EUR/USD broke above key resistance levels, indicating strong bullish sentiment. The pair's movement suggests a potential shift in market dynamics, with investors seeking alternatives to the dollar.
🔹 Key Resistance Levels:
$1.1473: Immediate resistance. A break above this level could signal further bullish continuation.
$1.1500: Psychological resistance and a potential target for bulls.
$1.1600: A more substantial resistance area that could be tested if momentum continues.
🔸 Key Support Levels:
$1.1300: Recent support. A break below this level could indicate a short-term pullback.
$1.1200: Next significant support, representing a potential bounce point.
$1.1100: A critical support level that, if breached, could lead to a shift in market sentiment.
📐 Price Action Patterns:
The pair's recent breakout above previous resistance levels suggests a strong bullish trend. The formation of higher highs and higher lows supports this view. However, traders should watch for potential reversal patterns near resistance areas.
🧭 Potential Scenarios:
✅ Bullish Scenario: If EUR/USD breaks and holds above $1.1473, it could target $1.1500 and potentially $1.1600. Continued weakness in the U.S. dollar and positive Eurozone data would support this move.
❌ Bearish Scenario: Failure to sustain above $1.1300 may lead to a retest of $1.1200, with further declines possible toward $1.1100 if bearish momentum increases.
📌 Conclusion:
EUR/USD is exhibiting strong bullish momentum, breaking through key resistance levels. Traders should monitor upcoming economic indicators and geopolitical developments that may influence the pair's direction.
💬 What's your outlook for EUR/USD? Do you anticipate continued strength in the euro, or will the dollar regain its footing? Share your thoughts below!
Let me know if you'd like this analysis tailored for a specific platform or with additional details!

XAU/USD 25 March 2025 Intraday AnalysisH4 Analysis:
-> Swing: Bullish.
-> Internal: Bullish.
Bias and analysis remains the same as analysis dated 23 March 2025.
Price has printed a bearish CHoCH following printing further all time highs.
Price is now trading within an established internal range. I will however continue to monitor price.
Intraday Expectation:
Price to trade down to either discount of internal 50% EQ, or nested Daily and H4 demand levels before targeting weak internal high priced at 3,057.590.
Note:
With the Federal Reserve's dovish stance and persisting geopolitical uncertainties, heightened volatility in Gold is expected to continue. Traders should proceed with caution and adjust risk management strategies in this high-volatility environment.
Price could also be driven by President Trump's policies, geopolitical moves and economic decisions which are sparking uncertainty.
H4 Chart:
M15 Analysis:
-> Swing: Bullish.
-> Internal: Bearish.
Analysis and bias remains the same as yesterday's analysis dated 24 March 2025.
As per analysis dated 19 March 2025 whereby I mentioned as an alternative scenario that internal range has significantly narrowed. All HTF's require a pullback, therefore, it would be completely viable if price printed a bearish iBOS.
This is how price printed, by printing a bearish iBOS.
Price has yet to print a bullish CHoCH to indicate bullish pullback phase initiation, however, price has traded into premium of 50% internal EQ, therefore, I am happy to confirm internal range.
Intraday Expectation:
Price has traded in to premium of 50% EQ and has mitigated M15 supply zone.
Technically, price to target weak internal low priced at 2,999.465.
Note:
With the Federal Reserve maintaining a dovish stance and ongoing geopolitical tensions, volatility in Gold prices is expected to remain elevated. Traders should exercise caution, adjust risk management strategies, and stay prepared for potential price whipsaws in this high-volatility environment.
M15 Chart:

XAU/USD: Bullish Momentum Holds with Breakout PotentialXAU/USD closed its third straight bullish week, with price testing Tuesday’s low before rebounding and closing near the 50% mark of the weekly range. Despite a brief dip, the candle closed above last week’s high, showing continued strength. A breakout above the 3,000 level raises the potential for further gains, especially if the market opens with a gap up.
On the daily timeframe, Friday's candle recovered after early weakness, resembling a previous pullback seen earlier this month. With a 1.90% retracement, the structure suggests possible upward continuation. The market is currently moving sideways within Friday’s range, hovering around the 3,030 key level.
While high-impact news could cause volatility, any pullback toward the 3,000 support zone—aligned with the trendline and previous week’s high—may offer buying opportunities. A breakout from the inside bar pattern forming on the daily chart could target the 3075 resistance zone

XAUUSD Today's strategyEconomic Data Expectations
The market will eye the U.S. CPI on Wednesday and PPI on Thursday. Per a Reuters survey, February's CPI is projected to rise 0.3%. Traders anticipate a Fed rate cut in June. Concerns over economic growth downside risks and rate cut expectations underpin the price of gold.
XAUUSD sell @2920-2925
tp: 2900-2905
XAUUSD Buy @2900-2905
tp: 2915-2920
Traders, if you liked this idea or if you have your own opinion about it, write in the comments. I will be glad
If you also aspire to achieve financial freedom,Follow the link below to get my daily strategy updates
