GOLD LONG, B SetupXAUUSD on the 1H timeframe shows a bullish continuation structure after reacting strongly from the bullish order block zone around 4580–4590. Price has respected this demand area and printed higher lows, indicating renewed buying interest. A break of structure has already occurred, supporting further upside momentum. As long as price holds above the 4610 support zone, bullish bias remains intact. Upside targets are positioned near 4645 as the first resistance and 4670 as the extended target.
Only for educational purpose only
Xausdanalysis

Gold at Critical ResistanceGold (XAUUSD) is showing a very interesting structure on the 4H timeframe. After breaking the previous falling trendline, price has shifted into a short-term bullish mode and is now moving inside a rising channel.
🔍 Key Technical Observations
Price broke the downtrend line with strong bullish candles, confirming buyer strength.
XAUUSD is currently trading near the upper boundary of the rising channel (around 4140–4145), where price usually faces short-term resistance.
The EMA ribbon (red/blue) is acting as dynamic support from below, supporting the bullish trend.
As long as price holds above the lower channel trendline, the market structure remains bullish.
📈 Bullish Scenario
If price breaks above 4145–4160, we could see continuation to:
4185
4210
4250 (extended target)
A breakout above 4160 may trigger a strong upside move.
📉 Bearish Scenario
If price falls below the lower channel support (4080–4100), it would signal a deeper correction:
4050
4020
A channel breakdown would be an early sign of trend reversal.
🎯 Bias Summary
Trend: Short-term bullish
Structure: Rising channel
Current Position: At upper channel resistance (expect possible pullback)
Major Trigger: Break above 4160 or below 4080

A+++ Setup That Completed My Prop Firm Challenge
(Structure · Precision · Patience · Faith)
This trade wasn’t luck.
It wasn’t guessing.
It wasn’t hope.
It was pure structure, multi-timeframe alignment, perfect execution, and flawless risk management—and it ended up completing my Prop Firm Challenge.
Here’s the full story, exactly how the setup unfolded from the first signal all the way to final execution.
⸻
📌 Higher-Timeframe Context: The Bearish Top Was Already Set
Everything began with the 4H BOS around 93,900, which officially broke structure and created the macro bearish environment.
Then price formed a clear 4H Lower Low at 89,000, confirming the downtrend.
But the real clue came next:
👉 Price aggressively pulled back to 92,900–93,000, retesting the old 4H BOS zone
👉 Then failed to reclaim it
👉 Entered a tight range directly underneath the level
👉 Volume dropped
👉 Candle bodies got smaller
👉 Wick pressure increased
That’s redistribution—not accumulation.
I knew sellers were loading.
⸻
📌 LTF Alignment Begins: The Dominoes Fall One by One
Once I had the HTF context, I waited for LTF confirmation.
1️⃣ 1M BOS below 92,900
Signaled the first crack in the bullish micro-flow.
2️⃣ 5M Displacement + BOS
Not noise — real intent.
Selling pressure was confirmed.
3️⃣ 15M Market Structure Shift (MSS)
This was the decisive moment.
The bullish internal structure broke.
Momentum flipped.
The range under 92,900 was officially a distribution block.
4️⃣ 30M & 1H candle closes below 92,880
This erased any bullish reclaim attempt.
HTF + MTF now perfectly aligned.
At that point, the short wasn’t a prediction — it was a requirement.
⸻
📌 The Entry: Precision at the Retest
I placed my short on the retest of 92,900, right into the ceiling of the redistribution.
Entry: 93,055
Stop Loss: 93,943
Target: 90,955 (MTF sell-side liquidity)
⸻
📌 Risk Management That Passed the Challenge
I didn’t gamble.
I executed professionally:
✔️ 33.33% partial at 92,000 → +$96.75
✔️ SL moved to 93,210 → protected profits
✔️ 33.33% partial planned at 91,050 (SSL target)
✔️ 33.33% runner for extended continuation
When FTMO notified that I had completed the challenge, I closed the entire position at 91,950.
Clean. Controlled. Disciplined.
⸻
📌 Outcome: Challenge Completed by Structure Alone
No indicators.
No fundamentals.
No emotions.
No guesswork.
Just:
• 4H BOS
• LTF MSS
• Displacement
• Retest
• Liquidity targets
• Risk management
• And unshakable patience
My trade went from A+ to A+++ the moment all timeframes aligned perfectly.
This is the kind of setup you wait for — not the kind you chase.
⸻
📌 Final Words
I’m extremely grateful —
to God first,
to the journey second,
and to the discipline that carried me through.
If this breakdown gave you clarity and shows you how powerful clean structure can be…
👇
Leave a like, drop a comment, share it, and hit Follow.
Your support motivates me to keep bringing high-level breakdowns to the community.
more legendary setups to come.
COINBASE:BTCUSD OANDA:XAUUSD OANDA:EURUSD

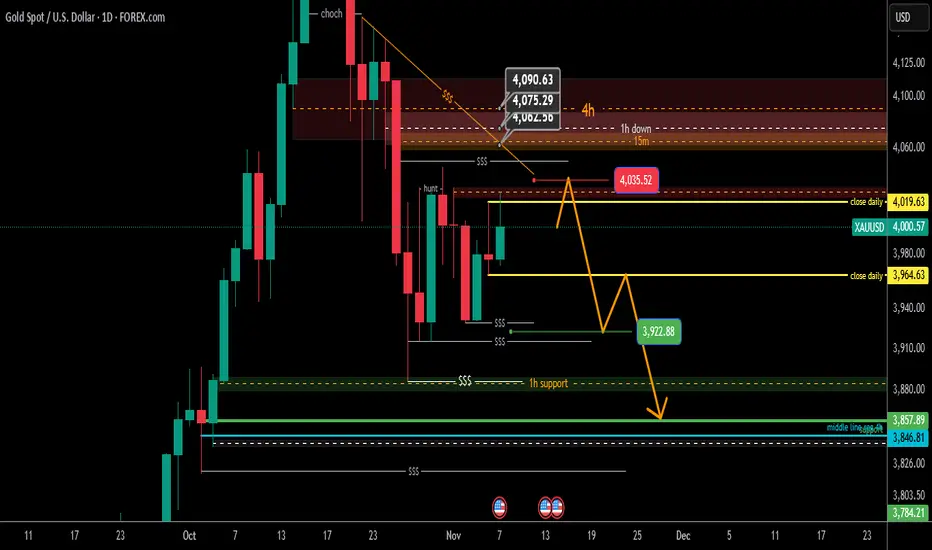
Gold Analysis Daily Time Frame
Hello Traders
Gold is within its daily range (4024 - 3929) and for Monday it will be important whether it can close above or below the marked candle.
I expect a similar move for gold this week, the condition for this move is that the daily candle does not close above 4019, if the Monday candle moves towards 4035 and immediately stabilizes below 4019, this path can be expected to continue until liquidity levels are low.
The three levels of 4062, 4075 and 4090 are still important resistance points, and the market has not yet pulled back to these levels, so the price may be slightly higher than these areas to continue the path. Good luck
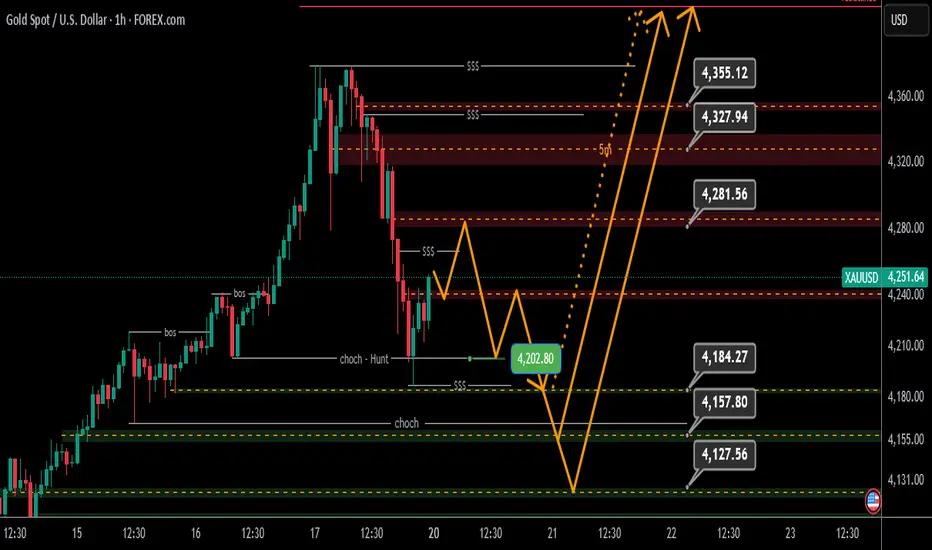
Analysis and possible path of goldHi traders
One-hour structure of gold:
The structure of the one-hour time frame and above is still the bullish structure and the movement that can be imagined this week. The liquidity points and three resistance / support are marked on the chart. They are the market reaction points that can be triggered to enter at these levels in the lower time.
The area of 4202 is the choch-hunt line that can act as a support pullback and even the main positive reaction can be formed from this area, but ideally the current bottom is collected once again and rises from one of the three supports below the bottom.
Have a good week
ElDoradoFx PREMIUM 2.0 – GOLD FORECAST 25/09/2025 (ASIA SessioN)🔍 Multi-Timeframe Technical Outlook
Daily Chart
• Price trading 3,750, consolidating just below recent high at 3,791.
• Momentum still bullish overall, but candles show rejection at highs → suggesting possible short-term retracement before continuation.
• 20EMA support at 3,727, stronger structure support at 3,705.
⸻
1H Chart
• Price has created a triangle structure, now testing resistance 3,748–3,751.
• Clear invalidation/decision levels:
• Break & Retest 3,748/3,751 = bullish continuation.
• Break & Retest 3,732 = bearish continuation.
• MACD histogram turning positive, showing early bull momentum.
• RSI mid-zone → neutral bias, awaiting breakout confirmation.
⸻
15M Chart
• Price consolidating above 3,744, respecting intraday demand zone.
• Bullish divergence forming on MACD → supports a possible bounce.
• Key resistance: 3,751–3,756 (short-term profit zone if broken).
⸻
5M Chart
• Current consolidation 3,746–3,750, coiling for Asia session move.
• Micro trend supports scalping longs if 3,748 holds as support.
• Downside scalp possible if 3,732 breaks & retests.
⸻
🎯 High Probability Scalping Entries (Asia Session)
(max 60 pips SL)
✅ Scalp Buy Setup
• Entry: Above 3,748 with retest confirmation.
• SL: 3,742 (-60 pips).
• TP Zones: 3,756 / 3,764.
• Reasoning: Break above intraday resistance aligns with bullish MACD & higher-timeframe trend.
✅ Scalp Sell Setup
• Entry: Below 3,732 with retest confirmation.
• SL: 3,738 (-60 pips).
• TP Zones: 3,722 / 3,710.
• Reasoning: Clean liquidity pocket below 3,732, bearish MACD cross on 5M supports momentum lower.
⸻
📌 Fibonacci Golden Zone Check
• Pullback from 3,791 high → 3,732 low shows golden zone at 3,748–3,755.
• Price is inside golden zone right now → high chance of reaction.
• This strengthens the importance of 3,748–3,751 breakout for bullish continuation.
⸻
⚠️ Key Asia Session Levels
• Bullish Breakout: 3,748 → target 3,756 / 3,764.
• Bearish Breakout: 3,732 → target 3,722 / 3,710.
• Intraday Pivot: 3,744–3,746 zone (control level).
⸻
✅ Summary:
For Asia, gold is coiling inside the golden zone. A break above 3,748–3,751 should open the path to 3,764, while a clean drop below 3,732 could accelerate toward 3,710. Both setups respect a 60-pip stop loss. Wait for break-and-retest confirmations on 5M & 15M before entering.

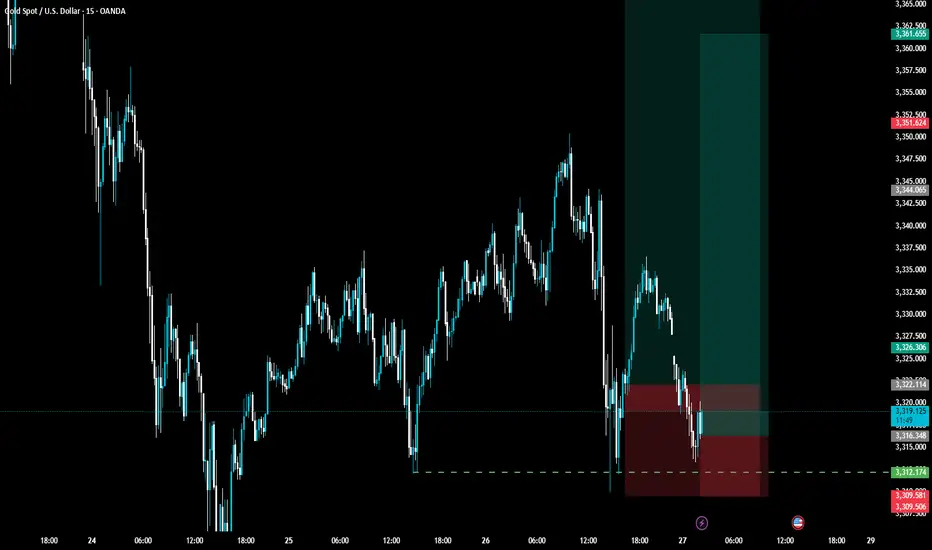
"The Great Gold Heist" – XAU/USD Master Plan🏆 "The Great Gold Heist" – XAU/USD Master Plan (High-Risk, High-Reward Loot!) 🚨💰
🌟 Attention, Market Robbers & Money Makers! 🌟
Hola! Oi! Bonjour! Hallo! Marhaba! 🤑💸
🔥 Based on the legendary Thief Trading Strategy (technical + fundamental heist tactics), here’s our blueprint to STEAL massive profits from the XAU/USD (Gold vs. Dollar) market! 🔥
🎯 The Heist Plan (Long Entry Setup)
Entry Point 📈: *"The vault is UNLOCKED! Swipe bullish loot at any price—but for a cleaner steal, set Buy Limits within 15-30M recent swing lows/highs. ALERT UP! ⏰"*
Stop Loss 🛑: "Thief’s SL hides at the nearest swing low (4H TF: 3310.00) OR below the last daily candle wick. Adjust based on your risk appetite & lot size!"
Target 🏴☠️: 3440.00 (or escape early if the cops—err, bears—show up!)
⚡ Scalper’s Quick Loot Guide:
"Only scalp LONG! Rich? Go all-in. Broke? Join the swing traders & rob slow ‘n’ steady. Use Trailing SL to lock profits!"
📊 Market Status:
XAU/USD (GOLD) – Neutral (But Bullish Sneak Attack Likely! 🐂💥)
"The heist is ON, but watch for traps—overbought zones, consolidation, and bearish robbers lurking!"
🔍 Pro Thief Moves:
✅ Fundamentals Matter! (COT Reports, Geopolitics, Macro Data, Sentiment—check our Bii0 for the full loot list!) 🔗👉🏻☝🏻 klik lin.kk
✅ News = Danger! Avoid new trades during releases. Trail your SLs to protect stolen cash! 📰🚨
💖 Support the Heist Crew!
"Hit the BOOST BUTTON 💥 to strengthen our robbery squad! More boosts = easier money steals daily!"
🚀 Stay tuned—another heist drops soon! 🐱👤💎

Gold’s in a Trap — And That’s Exactly Why You Should Be CarefulGold is stuck in a tight sideways range. It’s been bouncing between $3,370–$3,380 for two days now. Everyone sees it. Every trader watching gold knows this level acted as support — and judging by the candle shadows, buyers are getting aggressive here.
So if you're purely technical — yeah, looks like a solid buy right now.
But here’s the twist…
___________________________________________________________
I’m not buying.
And I’ll tell you why — because it's too obvious.
When something screams "buy" from every chart and every textbook, that’s when you pause and ask yourself:
“Am I about to walk into a classic setup… or actually catch a real move?”
Because history shows us — these textbook setups often play out like this:
Motivation → Encouragement → Payback. (See Chart 2)
It goes like this:
Price breaks a visible high or low (Motivation)
Traders jump in and get some pips(Encouragement)
Then — brutal reversal (Payback)
Only then will everything get off the ground, and it will be fast, so that the "unnecessary" passengers who were "dropped off" should not have time to return to this train. So why are they "unwanted"? Well, here's one possible answer: because retail tends to hold losing trades too long , but gets spooked early on winners. We’re wired that way.
So what happens when everyone starts booking profits after a small bounce?
You get limit sell orders piling up , slowing momentum — sometimes even flipping the trend.
And then what do big players do?
Then come back in — buying at higher levels, averaging their positions. Not the best case scenario....
Key Takeaway:
______________________
Here’s my advice — especially if you’re in this game long-term:
1. Avoid those super obvious setups everyone else is jumping into.
2. Instead of asking, "Why should I open a trade now?"
Try asking: "Why shouldn’t I open a trade now?"
p.s.
If you liked this kind of deep-dive — follow along. We don’t just read charts. We read the market behind them.
Conclusion:
_________________________
📍 Gold is testing a key zone — but don’t let the crowd pull you in.
🧠 The first quick impulse is often a trap
📈 Stay sharp, stay ahead.

XAU/USDGold seems to be touch daily bullish FVG also that area is a swing daily high lots of liquidity is resting this zone, One's liquidity is swiped price will target daily low target.

#XAUUSD 1HBased on the 1-hour analysis, I’m watching for a selling opportunity around the key resistance levels of 2673.00 and 2671.00.
Targets: 2662.00 / 2640.00 / 2625.00
However, with the major NFP event coming up today, there's potential for an upward spike. Avoid placing advance orders for now and wait for solid bearish confirmation before entering.
#XAUUSD

#XAUUSD 1HBased on the 1-hour analysis, the price is consolidating near the resistance area. I'm personally looking for a selling opportunity around the 2509.00 zone.
There’s a chance the price could drop directly from here without testing our zone.
Avoid placing advance orders for now and wait for strong bearish confirmation before entering.
#XAUUSD

XAUUSD - GOLD - Scalping Mode! 5th AugLet's see what the market has to offer.
Disclaimer:
This is simply my personal technical analysis, and you're free to consider it as a reference or disregard it. No obligation! Emphasizing the importance of proper risk management—it can make a significant difference. Wishing you a successful and happy trading experience!

XAU-USD Bearish divergence intraday.Hi traders.
1 Hour and below has bearish divergence taking place. A slow breakdown in price. We have hit the upper bound resistance in a bullish channel. I expect a short term reversal. We must wait for a breakout of the channel before attempting a short down to $2360 zone.
On the other hand, price could push hard out of the intraday channel to $2420

XAUUSD SCALPINGwe'll wait for the news on 17:30 to confirm whether we BUY or SELL
If it breaks the up trend line we buy
If it breaks the down trend line we wait for retest or double confirmation candle then we sell

Gold daily analysisGold is likely to touch the 2050 where it is a upper channel line and I have 2 scenarios. I think the control is in the buyers hand, so I just look for buy until 2050 get touch.

XAU/USD 22 Jan 2024 Daily Analysis-> Swing: Bullish.
-> Internal: Bearish
-> Has reached EQ.
Price pulled back following bearish iBOS and is reacting to 50% EQ of the internal structure marked in green and daily demand zone.
Price is currently trading within internal high and fractal low.
Expectation: Price to target weak internal low. Current demand zone to be respected.
In the event price continues to trade bullish the likely scenario is for price to trade up to strong internal high before continuing bearish internal order flow.

xauusd 1h timeframe chart xauusd chart analysis 1hours time frame. if breakout 1934 so you can buy, if xauusd breakdown 1931level so can sell.

XAUUSD 26/04/2023Currently, on the 15-minute timeframe chart, we are within a bullish range that ranges from 2009 to 1991, with the former being the liquidity point of the range. Therefore, we could expect a bullish reaction in the zone ranging from 1998 to 1996. As long as the price does not close below this zone with a bearish candle, we can say that the zone is being absorbed in lower timeframes, and we can move down to lower timeframes to position ourselves in bullish ranges.

XAUUSD 15M 24/04/2023On the 15-minute timeframe, we can see that we are already mitigating the zone between 1998 and 1990. Depending on the confirmation style, one could already be in a short position with a target at 1971, as it is the liquidity point of the bearish range.

Gold Spot Bulls Can Show The PresenceHello Friends,
On my last analysis it was suggested 2048 - 2050 can bring bears on charts till 1980 - 1970. Today we have witnessed 1970 now this is a support, an important support infect.
So those who are shorts should look to book gains or at least adopt risk management. For details of That analysis please go though my previous research on GOLD.
I believe short covering base pull back from here can be seen till 1981 - 1986.
Closing US session above 1986 would shift control to ST to bulls.
For MT to LT please review my previous details research.
Happy Trading.

possibilities of reversal move about xauusdhello everyone
we have few factors on xauusd chart 4h
that gives us a point to how think about next moves

XAUUSDOANDA:XAUUSD
The gold is going up and may bounce back down to break below support line.
What do you think will happen with GOLD?
