Xaushort

potential 3:1 $XAU short not a financial advice, just an idea based on my bias and interpretation of the market.


Sell From this ZoneSell from this zone . Take profit @1977- 1969
Gold Intraday: key resistance at 1991.00.
Pivot:
1991.00
Our preference:
Short positions below 1991.00 with targets at 1977.00 & 1969.00 in extension.
Alternative scenario:
Above 1991.00 look for further upside with 1999.00 & 2006.00 as targets.
Comment:
As long as the resistance at 1991.00 is not surpassed, the risk of the break below 1977.00 remains high.

GOLD BREAKDOWN ANALYSIS dear traders gold still in consolidation you don t have to trade during correction i have this zone price ranging up and down follow the ruls in chart and be careful from news good luck

Gold- From buying dips to selling ralliesLast week was a tough one for Gold bulls, with 3 failed attempts to stay above important 2k mile stone and, finaly, a close well under this figure.
Although the medium term up trend remains intact so far, on short term, we can assist to a deeper correction.
A level to watch for this correction is the next obious support zone between 1940 and 1945.
In conclusion, as long as 2k remains intact, I'm looking to sell rallies with the up mentioned target.


Gold shortBig sell-off from gold due to that non-farm payroll data .... but again any pull back and re-test on the breakout area, is another opportunity to look for shorts. Good luck and happy trading guys.

Gold Sell From Liquidity Area With 1000 Pips Target Hi Trader's ,, Let's Explain This Analysis For Gold For Next Period ,,
Gold Arrive To Liquidity Area At 1907 - 1910 And Try To Break Out It And It's False ,,
So We Can Sell From This Area ,, To Targets ON Chart ,, And Stop Lose Above 1935 For Safe ..

XAUUSD By HesamUNTHey traders
as i said before, we had a strong Supply Zone at 1805 and I was bearish on that Zone
after sell pressure, the Price come back and break up this Zone
it means bulls collect this sell pressure
also, I was bullish about that move and the target is 1900 $
u can check both of em
the bullish and bearish move
now I'm expecting some selling pressure in this Zone, which means we can go back to the lower zone at 1810, it will b the second target
we need 2 breaks 1810 for trend confirmation, after that, we can touch 1774 and confirm By Dynamic level
Yellow dynamic levels will b confirmation for short and mid-term oscillation, so after breaking down dynamic level, we can aim for the last target which is 1735 - 1730 and confirmed by Fib EXT and Demand Zone
so, that's my move
what u think ?
Share your chart and leave a comment

XAUUSDthere is no reason to gold going to upside beside DXY is strong bullish with yesterday's economic events.
I am waiting for NFP also come with bullish for dxy and gold is gonna crash at least 1812.

XAUUSD Short PlanContinue the Wyckoff methodology and Volume Profile series, today I will do the analysis of XAUUSD. We can assume/define the Buying climax starting from Dec 15, then the price moves down to up, while the volume is just down, which means this wave may not be good - even if the price is still sideways up (Phase A). After that, take a look carefully at Phase B of this channel, the price is continuously sideways but the structure of the volume is broken with a climatic volume at the middle of the range - It is a warning signal as it should not appear as a general rule in the accumulation schemes and therefore could be a footprint to add in favor of the downward control.
Focus in Phase C - UTAD, the price tries to leave the value area of the composite profile but is strongly rejected (bear engulfing candles - Dec 27 & 28). The market is not interested in trading at higher prices and that's a new signal is added in favor of sellers.
The last signal: Do you see the price's momentum is very weak when it reaches back the UTAD?
-----
Once again, this setup looks very basic, but it's really effective. Let's follow the plan and see what will happen.

XAUUSD 1H SHORT SIGNALwe got a rejection from the golden zone and heading down to test the trendline

XAUUSD STILL LOOKING WEAKrising wedge Breakout And retest Has Already Done
Now Moving In Ascending Channel If XAU Breaks Channel To Trhen expecting another Bearish Move Towards 1755 to 1760

How's About XAUUSD??? where the price will go??let's see on Monday. if the price continues go up the price will be fly but if the price rejected will go down to make a right shoulder.
but i think the price will go down until 1677.
that's my opinion :)
be wise dan luck trade.

XAUUSD GOLD high risk tradehigh risk trade
with the info in an hour we take a sales opportunity with a big risk
minimize the risk
possibility that the dollar index rises from this point

GOLD BEAR RUN UNTIL 1450See chart anchored notes and markups for multi-time frame analysis and price predictions
$XAUUSD - CoT Suggests A Quick Short Before the Long Run *SMT*Inverse relationship with the dollar may also suggest a quick short as the dollar just dropped from the all time-high. The dollar may start to pull back down and if so we should see Gold rise. But not after it shorts from the next bearish order block to the nearest Bullish order block and by looking at the Commitment of Traders for Gold Futures, it appears that the longs outweigh the shorts over all. But short term there are mostly shorts. Here's the daily up close to see how the CoT Compares.
As we know bonds have not been great this year and currency chases the bond yield . If the yield is inverse the bond then It may suggest that all currency become weaker which would make gold more valuable. That's why I believe this may be the last short to capitalize on before it takes off.
I expect the short to happen during the London session just a little after midnight NY Time, I would expect the gold start creeping higher until it around 2-3 a.m. a rush up into that bearish order block and then a slow drop through the rest of the day until the end of the London session, that's when I would expect it hit the bullish order blck and turn around and start moving back up. We'll see what happens I guess.
Good luck and happy trading :)
OANDA:XAUUSD
COMEX:GC1!

gold-usdwe are going down to hit 1560 soon as the dollar index has reached a historical areas at 114

Cpi goes up $dxy goes up everything else goes down.This count is based on my assumptions so anything can happen not a trading or financial advice just for educational purposes only kindly do your own ta thanks trade with care good luck.

GOLD DOWNTREND CONTINUESThe price of the precious metal continues to decline with the rise of the value of USD. Continuous hawkish talks are putting even greater pressure on the price of the GOLD.
The technical indicators are also placing the instrument into a bear market, with MACD histogram below 0 line and continuing to decrease and RSI well below 50 neutral line.
Bearish traders are looking at a target price of 1600 if the trend continues. If it reverses, though, it might test the previous resistance at 1680.
Risk Disclosure: Trading Foreign Exchange (Forex) and Contracts of Difference (CFD's) carries a high level of risk. By registering and signing up, any client affirms their understanding of their own personal accountability for all transactions performed within their account and recognizes the risks associated with trading on such markets and on such sites. Furthermore, one understands that the company carries zero influence over transactions, markets, and trading signals, therefore, cannot be held liable nor guarantee any profits or losses.

GOLD: Bearish Multi-Bar Fakey SetupGOLD – SPOT: Selling On Retracement To Within The Range Of Bearish Multi-Bar Fakey Setup
Price Action: Price moved lower from the Bearish Multi-Bar Fakey Setup that had formed mid-last week (We suggested selling on a breakdown of this setup in the Sep 22nd, members' daily newsletter).
Price exploded lower from the prior Bearish Multi-Bar Fakey Setup that had triggered early last week (Price just tickled above this Setup, before collapsing back down), (We suggested selling on a breakdown of this setup in the Sep 12, weekly newsletter and hopefully, some traders got on board)
Potential Trade Idea: We are considering selling on retracement higher to within the range of the most recent Bearish Multi-Bar Fakey Setup that had triggered late last week.

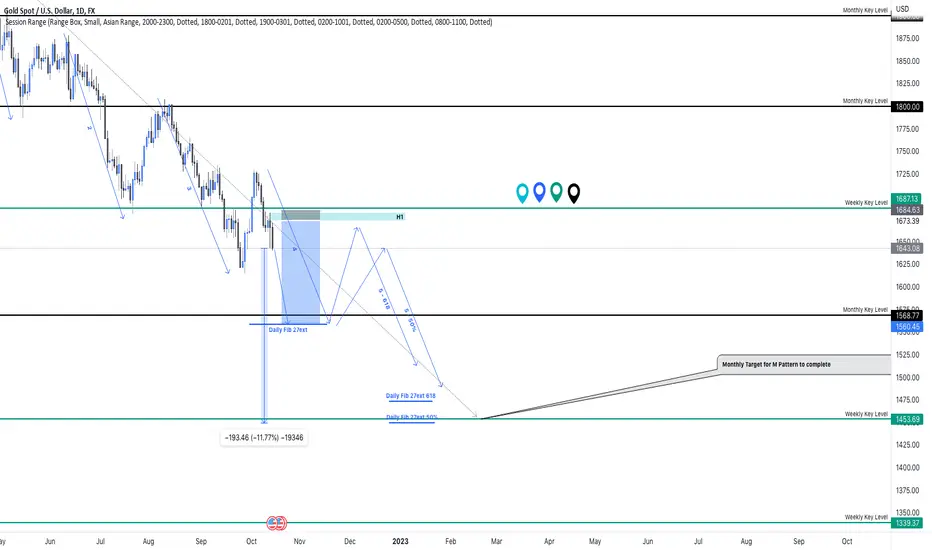
Lifetime Opportunity Short on XAU/USDGold just broke a major key level it's been holding for the last 2 and a half years. With such a strong piece of structure broken and failed to reclaim from the retest, clear signs that Gold has a strong chance of heading to it's next 2 major levels below.
