GOLD (XAUUSD) — SMC Accumulation Complete | Targeting New ATHThis GOLD (XAUUSD) analysis is based purely on Smart Money Concepts & market structure, not indicators or emotions.
Price spent a long time in a clear Accumulation range, where smart money quietly built long positions while retail traders stayed confused.
The marked HH inside accumulation shows where liquidity was engineered before expansion.
After accumulation, price executed a classic manipulation move, sweeping sell-side liquidity below the range (HL), trapping weak sellers and fueling smart money entries.
📌 Key Confirmation:
The aggressive bullish displacement from the manipulation zone confirms institutional intent. This was not random — this was planned.
Now price is reacting into a Mitigation Block / Distribution zone, where previous sell orders are getting mitigated.
As long as GOLD respects this mitigation block, the bullish narrative remains valid.
🔍 Bullish Scenario:
• Healthy pullback or consolidation inside the mitigation block
• Liquidity taken ➝ continuation higher
• Targeting new ATH around 4730 and above
⚠️ Invalidation:
Only a strong acceptance below the mitigation block would delay the upside. Until then, dips are viewed as opportunities, not reversals.
This is how smart money builds trends: Accumulation ➝ Manipulation ➝ Expansion ➝ Continuation.
💡 If you wait for perfect clarity, you enter late.
If you understand liquidity, you enter with confidence.
💬 YOUR TURN
Do you see GOLD continuing toward a new ATH,
or do you expect deeper mitigation first?
👇 Comment your bias (Bullish / Pullback / Neutral)
🔁 Share this idea if it helped your market perspective
⭐ Follow for more Smart Money GOLD breakdowns
Xausudanalysis

GOLD— SMC Explained | Accumulation → Manipulation → DistributionThis Gold (XAUUSD) analysis is a complete Smart Money cycle breakdown, not a random buy/sell idea.
Every zone, label, and projection on this chart is built with intent, logic, and patience.
Let’s break down what price is really doing 👇
🔹 1️⃣ Accumulation Phase
Price first entered a tight range where smart money quietly built positions.
Retail traders see “consolidation” — institutions see inventory building.
Notice how liquidity was resting on both sides during this phase.
🔹 2️⃣ Manipulation Phase
After accumulation, price made a false move designed to trap breakout traders and trigger stop losses.
This move is not random — it exists only to engineer liquidity.
➡️ Weak hands are forced out
➡️ Liquidity is collected
➡️ Smart money prepares for expansion
🔹 3️⃣ Distribution Phase
Once liquidity was taken, price expanded aggressively into the distribution zone.
This is where late buyers enter emotionally — and smart money begins to offload positions.
Multiple SSS (Sell-Side Liquidity) levels above confirm where price is being drawn next.
🔹 4️⃣ Liquidity Pool & OB Reaction
After the distribution, price retraced toward a clear liquidity pool, aligning perfectly with a valid Order Block.
This zone is not chosen randomly — it’s where unfilled orders + inefficiency exist.
The marked Entry Zone is based on: • Liquidity draw
• OB mitigation
• Smart money re-entry logic
🔹 5️⃣ Projection Logic
The projected path shows engineered pullbacks, not straight-line movement.
Markets don’t move to be fair — they move to rebalance and seek liquidity.
This roadmap is a framework, not financial advice.
🧠 Final Thoughts
If you trade without understanding: • Where liquidity sits
• Who is trapped
• Who benefits from the move
Then you’re reacting — not trading.
This idea took serious time, screen work, and precision, and it represents how I personally read the market.
💬 ENGAGEMENT (Very Important)
👉 Do you agree with this Smart Money cycle?
👉 Which phase do you think Gold is currently in?
👉 Drop your bias or mark-ups in the comments — let’s learn together.
If this breakdown added value, LIKE & SHARE so more traders can see how institutions truly move price.

XAUUSD Weekly Scenarios⚙ Weekly Scenarios
Bullish Scenario:
The price holds above support at ~$3,660 and breaks resistance at ~$3,760–3,800.
Then, a rally to $3,900 and beyond is possible, especially with support from rate and geopolitical news.
Consolidation:
The price may move sideways between $3,660 and $3,760 until a strong signal (from news or volume) breaks the range.
Bearish Scenario:
A break below $3,660 with volume confirmation could lead to a correction to $3,600 or even lower.
In this case, it's important to watch whether lower support levels hold, otherwise a deeper pullback is possible.
🔎 Conclusion
The overall picture for the week is bullish, but with the risk of a pullback or consolidation due to overbought conditions and resistance.
Key: Watch for a reaction in the resistance zones of ~$3,760–3,800 and for support to hold at ~$3,660.
For traders: consider buying on dips near support zones and shorting (or taking profits) as the price approaches strong resistance if it fails to break through.

Gold balances on a fine line: growth or correction?Following the release of soft US inflation data, gold is consolidating in the $3,250–$3,450 range, holding above key support. A weak dollar and expectations of a Fed rate cut are supporting bulls, but locally the price has hit a resistance zone.
Bullish:
Fixing above $3450 → target $3500, then $3550–$3600.
Breakthrough of $3500 will increase momentum to $3650+.
Bearish:
Breakthrough below $3250 → decline to $3200, with increasing pressure — to $3100.
📊 Indicators (D1)
RSI (14): ~43 — neutral, not overbought
MACD: in the negative zone — signal of a possible correction
SMA50/100/200: price slightly below average, indicating a pause in growth

GOLD HOLDS 3330 LIQUIDITY ZONE – BULLISH REVERSAL IN PLAY!📌 Market Overview
Gold has firmly held the 3330 liquidity support zone and bounced back strongly, now trading around 334x, forming a clean bullish structure on the M30 chart.
If the current momentum continues, price is likely to target the FIB resistance & CP Zones above at 335x and 336x in the short term.
On higher timeframes, the corrective wave is still present, but intraday traders must stay alert – today’s geopolitical headlines from the Trump–Putin meeting could inject volatility. Friday’s usual liquidity sweeps also add risk, so stay adaptive and avoid getting trapped by false breaks.
🧐 Key Technical Insights (MMFLOW Analysis)
CP Resistance 3355 aligns with a strong OBS SELL ZONE – watch for reaction here.
Further upside resistance near the 0.62 FIB level. If price reaches this early in the Asian or early London session, it’s a valid short setup. Late London or NY session tests could be false break traps due to the confluence with the downtrend line.
BUY Entries are still valid from 3334–3336 for early intraday longs, with SL below 3330. If 3330 breaks, wait for deeper liquidity at 331x before buying again.
🎯 Trading Plan – MMFLOW Strategy
🔹 BUY ZONE
Entry: 3334 – 3336
SL: 3330
TP: 3340 – 3345 – 3350 – 3355 – 3360 – 3365 – 3370 – 3380
🔹 SELL ZONE
Entry: 3355 (OBS SELL) or 0.62 FIB confluence
SL: Above 3362
TP: 3350 – 3345 – 3340 – 3335 – 3330
📊 Key Levels
Resistance: 3355 – 3362 – 3370
Support: 3336 – 3330 – 331x
💡 MMFLOW Comment:
The best approach today is trend-following buys from liquidity zones while monitoring intraday resistance for short scalps. Geopolitical headlines and Friday liquidity sweeps may trigger traps – trade smart, not just fast.

XAUUSD - Trading scenariosTechnical market condition
The price holds above $3,370, demonstrating sustainable bullish potential. Tariff tensions and inflation data expectations are keeping interest in gold as a safe haven asset.
However, gold is trying to break through the barrier at $3,400 again: until the breakout is confirmed, quotes will remain under pressure.
Counteraction to the decline: data on the reduction of geopolitical risks (for example, in Ukraine) and the strengthening of the dollar are exerting pressure - a possible decline to the support level of $3,314-$3,342.
Support and resistance levels
Key resistance levels:
~$3,400 - a psychological barrier, repeatedly confirmed by sales.
With a confident breakout, an attack on $3,435 is possible and then - to $3,500-$3,600, as Citi analysts predict against the backdrop of a weak US macroeconomy.
Main support levels:
~$3,370 — current support.
If broken — potential for a drop to $3,314–$3,342

XAUUSD 4H SHORTPrice broke out of the bearish trend line and moved sideways in a range forming two tops or a double top.
Fundamentally, US jobs data came out positive keying into hawkish tone on interest rate and influenced CPI.
Price broke the neckline after 4H closure giving signal for bearish move to $3250 support.
Here’s my little idea on GOLD. Follow for more.

Can we continue to go long on gold now?Gold has an obvious double bottom structure at the bottom, and gold has an obvious bottom signal near 3210
Trading ideas: Buy gold near 3238, stop loss 3220, target 3270

Gold’s 3200 mark is the key!Due to the ceasefire between India and Pakistan and the easing of the Sino-US trade war, gold opened directly and fell below 3280 and 3260 successively, so the decline of gold will continue.
From the gold hourly chart, the focus below is on the 3200 integer mark. If it falls below 3200 and cannot effectively stabilize, then gold will have a big double top here, and the next decline will extend to around the 3000 integer mark. On the contrary, if the 3200 mark is not broken, then the bulls will fight back, at least they will fill the gap again
So in terms of operation, it is not recommended to chase the short now. If you want to go long on gold, you can wait for it to fall back to the 3200-3210 area and stabilize before buying

The golden earthquake storm is coming!In terms of news: Major events over the weekend include the conflict between Russia and Ukraine, the sudden change in the situation between India and Pakistan, and the progress of Sino-US negotiations: Although India and Pakistan announced a truce, India's surprise attack turned the agreement into a joke. The high-level economic and trade talks between China and the United States are still continuing in Geneva, and it is difficult to have clear results in the short term. The war between Russia and Ukraine is still in a stalemate. The superposition of multiple events has injected uncertainty into the market.
Technical aspects:
Pay attention to the pressure in the 3360-3380 area. If it stands firm at 3346, it can fall back to arrange long orders. If it directly breaks below 3300 at the opening, pay attention to the support near 3280 - this position is likely to be lost, and effective support depends on the downward pattern formed after the 3260 break, and the ultimate target is 3200.

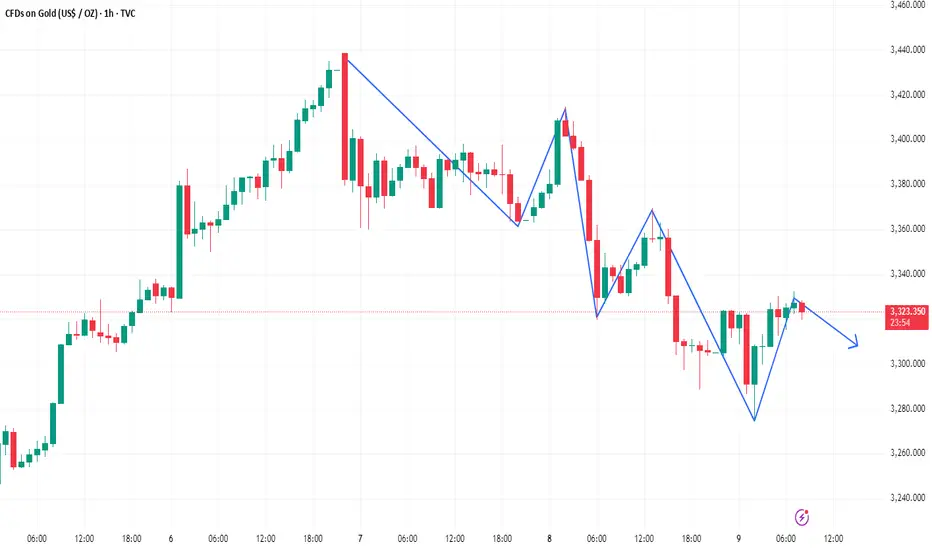
Gold is still in a short-term bearish trendGold's 1-hour moving average continues to turn downward. If it crosses below to form a downward death cross, then gold's room for decline may further open up. The short-term short position of gold has not ended yet. Gold has a trend of falling again. The short-term trend of gold is still short.
Trading ideas: short gold near 3325, stop loss 3340, target 3290
Gold breaks through 3400, the upward trend will continue
The Federal Reserve's interest rate decision will keep the interest rate unchanged, which is in line with the psychological expectations of most people in the market. The current price of gold still continues to fluctuate at high levels, but in terms of the general direction, gold bulls have actually not changed, and bulls are still in a strong phase.
If gold breaks through 3400 strongly in the short term, then you can go long gold on dips above 3400. If gold rebounds, focus on the pressure near 3430.

Gold is under pressure at 3400, with a short-term decline expectGold is under pressure around 3400. Today we will have the Fed's interest rate decision and Powell's speech. If gold is under pressure at 3400, it is expected to fall. Before the data, we need to be cautious.
In terms of trading ideas, we can short short-term, pay attention to the short near 3393-96, stop loss 3403, take profit 3360/3350

Gold is under pressure at 3300 in the short termThe key suppression area above gold remains near 3300. At present, you can short on rallies below 3300, with the target around 3270-3265 and the stop loss at 3205. You need to trade with caution

The gold shorts aren’t over yet
The 1-hour moving average of gold continues to turn downward. If the 1-hour moving average of gold forms a death cross downward, then there is still room for gold to go down in the 1-hour period. Gold has been under pressure from the 3340 resistance line for many times in the US market and has fallen. Gold has hit a new low again in the US market, falling to the 3260 line. The lows of gold continue to hit new lows, so the gold short position has not ended yet. The resistance of the 1-hour moving average of gold has moved down to around 3366. Gold continues to be shorted at highs below 3366.

Gold adjusts at a high level, continues to be short on rebound
Gold risk aversion eased, and gold fell directly. After gold fills the gap, if gold cannot continue to rise, then the gold shorts will continue to exert their strength. The current gap resistance of gold is at 3382, but the market is volatile now. If the gap is filled, gold may have momentum to repair in the short term, so you can pay attention to the suppression of 3400.
Trading ideas: Short gold near 3400, stop loss 3410, target 3370

Gold has an adjustment trend, shorting is the main trendGold has begun to fluctuate in a wide range. The gold high has been suppressed frequently in the past two days and will fall back. Don't chase too much after the gold high. Even if you are long, you must patiently wait for the opportunity to fall back and adjust.
The gold 1-hour moving average has begun to show signs of turning, so the volume of gold bulls has begun to weaken, and gold bulls may have adjustments. In the short term, the confidence in further rising gold is not very strong. The structure of the double top of gold 1 hour.
Trading ideas: short gold near 3221, stop loss 3231, target 3200

Will gold first fall and then rise today?
The gold 1-hour moving average is still in a bullish arrangement with a golden cross. Now the price is gradually approaching the moving average, but the gold bull trend has not changed for the time being. Patiently wait for the opportunity to adjust. Pay attention to the support near the previous low of 3185. The moving average support has now moved up to the line near 3177. Overall, gold may form a strong support near 3180. For today's gold trend, I personally think it will fall first and then rise.

Gold is strong, wait for a pullback to go longThe 1-hour moving average of gold has formed a bullish arrangement with a golden cross upward, and gold is now supported near 3100. If gold can stand firm at 3100 after the data, then we can continue to go long on dips.
Trading ideas: Buy gold near 3100, stop loss 2990, target 3130

Gold has won two consecutive games, continue to short?Gold continued to be in a dead cross downward short position at 1 hour. The strength of gold short positions has not diminished. Gold fell near the resistance of 3017, and the gold moving average resistance has now moved down to near 3021. After gold rebounds, it is still mainly short selling.
Trading ideas: short gold near 3015, stop loss 3025, target 2990
The above is only a sharing of personal opinions and does not constitute investment advice. Investment is risky and you are responsible for your profits and losses.

You can't make money from such a simple market?After gold stepped back, it hit a new high again. Gold bulls continued to be strong. Gold broke through 3127 again, so the bulls are even better.
The gold 1-hour moving average continues to cross upwards and diverges. The support of the gold 1-hour moving average has moved up to 3096, but gold is now far away from the moving average, so wait patiently for adjustments and then step back to continue to buy. The gold 1-hour lowest yesterday fell to around 3100 and then stabilized again, so today gold will continue to buy on dips above 3100.
Trading ideas for reference:
Go long near gold 3110, sl: 3100, tp: 3130

A real correction for gold could be comingGold 30-minute chart is beginning to have the possibility of a double top, so don't chase long for now. If you want to go long, wait patiently for a pullback, otherwise the high adjustment may also be large. Gold can be shorted on rallies. If gold falls below 3060, then the real adjustment of gold may come.
The market is changing rapidly. Since the strength of gold has been insufficient after breaking through new highs, don't chase too much.

Risk aversion pushes gold higher againFrom the perspective of gold trend, after three trading days of shocks and consolidation, this trading day also chose to break upward. After breaking through the pressure near 3030/32, it inertially rushed up to 3056, which is only one step away from the historical high.
Gold broke out of the upward trend mainly driven by risk aversion. Russia, Ukraine and Gaza opened fire again. The originally planned peace talks did not achieve substantial results, so the current market risk aversion pushed gold upward again. Gold strengthened again after breaking through the convergence triangle.
Gold can be shorted in the short term, sl: 3063 tp: 3042
