XAUUSD: Bulls Reach Full Targets; Start SellingToday the bullish momentum remained very strong. First, the market reached our initial target at 4228–4232, then moved up to 4250–4260, and eventually even surged to 4285, completing the final 4280 objective.
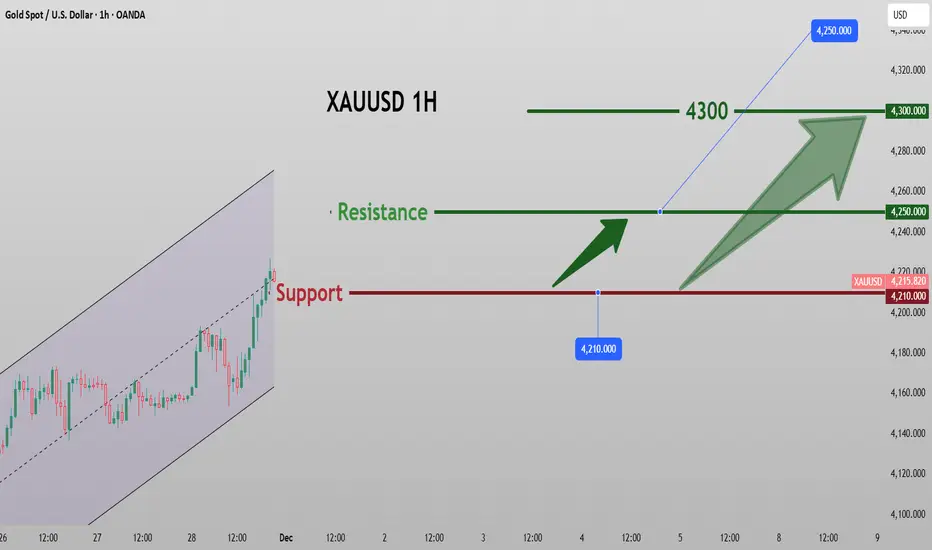
However, after reaching this area, the strength of the bulls clearly began to slow. On the one hand, we are approaching the market close, and trading activity is naturally fading. On the other hand, today’s rise has already been substantial, and gold is approaching the key 4300 level, where bullish pressure becomes significant.
Therefore, I plan to begin positioning a base short position. If prices continue to rise into the 4290–4310 zone, I will continue adding to the position to capture a pullback opportunity. The initial target is around 4260, followed by 4250. If the price extends above 4300, these targets will be adjusted upward accordingly, for example toward the 4270 area.
Xauusd1h

The upward momentum is strong. Buy on a slight pullback.The number of Americans filing for unemployment benefits recorded its largest weekly increase, suggesting that the job market may be facing new pressures. In addition, the Federal Reserve announced the reappointment of all 11 regional Fed presidents, a move that helped alleviate market concerns about uncertainty surrounding senior personnel appointments.
Influenced by this news, the precious metals market strengthened in tandem, with international gold prices reaching a high of $4286, a 1.22% increase on the day; silver prices reached a high of $64.3, a 2.79% increase.
Gold closed strongly in the US session, especially with a significant surge in the final moments, which typically suggests that the upward momentum is likely to continue in the last trading session of the week.
Currently, a move above $4300 for gold prices seems highly probable, and it may even challenge the previous high near $4381. Quaid recommends a buy-on-dips strategy for the short term. After breaking out of the previous trading range, the short-term technical structure of gold remains strong. The key focus should be on whether a slight pullback will lead to a challenge of the previous high. If buying momentum continues to strengthen, the upside potential remains considerable.
Gold prices have broken strongly out of their trading range, and the previous resistance level of 4260 has now become a key support. As long as the price remains above 4260, it can be considered a strong bullish trend, and this level can be used as a reference for short-term entry points. I will update more trading information in the channel.

XAUUSD: Maintain Buy Strategy, Target 4232–4250With the Federal Reserve’s rate cut finally confirmed, gold delivered a roller-coaster performance. It first climbed to around 4250, and today it has returned to the 4200 area. After holding long positions throughout yesterday, we finally captured significant profits under the stimulus of the rate cut.
Today we maintain a bullish strategy, paying particular attention to 4217. If it can hold above this level, it should at least rise to around 4232. We can seize this opportunity.
The next resistance level is 4250-4260. Next is the resistance at 4250-4260. If it cannot be broken strongly, you can sell with a small position at this level. If it falls back but does not break 4225, you can continue to go long. If the bulls are strong, we may be able to look forward to the 4268-4280 area.

XAUUSD: Beware of a Spike-and-Fade MoveOn Tuesday, gold experienced a roller-coaster move. It dipped to 4170 under selling pressure before rebounding again. Although both bulls and bears showed strength, neither side sustained momentum, indicating that the market remains in a choppy consolidation phase. Yesterday, silver rallied sharply to new highs, pulling gold higher as well. Expectations of a Federal Reserve rate cut continued to grow, attracting dip-buyers and supporting gold prices. However, Tuesday’s stronger-than-expected economic data pushed the U.S. dollar higher and drove Treasury yields to a three-month high, causing gold bulls to hesitate and limiting any major upside.
Today’s focus is the interest rate decision. With markets previously optimistic about a rate-cut-driven boost for gold, the 4200 support level has held firmly. Before the data release, gold may continue to fluctuate in a wash-and-rinse range, so a long-biased strategy with supplementary short positions is appropriate. During the announcement, be cautious of a potential “buy-the-rumor, sell-the-news” reaction, where prices spike and then drop sharply.
Yesterday’s public strategy was to go long in the 4190–4160 range with targets at 4200–4215. After achieving these targets, a sell trade was opened and closed in the 4200–4190 region, followed by another long position that was closed near 4215, resulting in ideal profits.
For today, buying around or below 4200 is recommended, while selling above 4260 is advised.

gold await breakout#XAUUSD price await 2 times breakout below 4192-90, this price act as reverse on buy but if the H1 closes below there then sell will occur.
Buy limit 4192-90 2 times breakout, target 4209-31, SL 4186.
Below 4187.8 D1 low, breakout again will go sell but we await below 4186 to sell. Above 4231 holds sell retrace

GoldXAUUSD
- Completed " 1234 " Impulsive Waves
- Bullish Channel as an corrective pattern in Long Time Frame
- Fair Value Gap
- Symmetrical Triangle in Short Time Frame
- Order Block

Be vigilant. Continue shorting below 4225.Gold has recently maintained a narrow range-bound trading pattern at high levels, consistently trading above the 4000 trendline since late November.
Prices have repeatedly tested the 4245-4250 area but failed to break through, indicating significant resistance above. Meanwhile, the 10-day moving average continues to provide short-term support, resulting in a tug-of-war between bulls and bears. The overall pattern continues the wide-range sweeping characteristic seen since November.
Currently, the key focus is on the first resistance area at 4225, which is a short-term dividing line between bullish and bearish sentiment. If a strong breakout fails, the market will likely remain weak; however, if the price breaks out effectively, it may test the 4245 or even the 4260-4265 area.
However, it should be noted that only a valid upward breakout above 4260-4265 will open up further upside potential. The key support level is in the 4165-4170 area. If this support level is broken again, the downward momentum will increase. I will update more transaction information in the channel.

Gold Faces Pressure at 4200, Start Buying Near 4170From a fundamental perspective, the market’s expectation for a 25 bps rate cut remains as high as 89%, and this has not shown any major change. Geopolitically, the prolonged Russia–Ukraine conflict and Trump’s proposed tariff hikes on multiple categories continue to provide a safe-haven cushion for gold. However, the repeated fluctuations in the U.S. Dollar Index and U.S. Treasury yields are simultaneously suppressing gold’s upside momentum.
Therefore, for the first half of this week, the overall outlook should still be treated as range-bound, with the main focus remaining on Wednesday’s interest rate decision.
From a technical standpoint, gold failed to stabilize above 4215 yesterday and subsequently retreated to around 4176.
Although price rebounded toward 4200 today, it still failed to break through and has since oscillated lower, even piercing 4170.
The 4170 level offers weak support, while the more significant support zone remains at 4156–4143. If price can pull back into this area today, it would present a relatively ideal opportunity for long positions. The immediate upside resistance is located at 4196–4210.
Regarding yesterday’s trades:
After gold failed to hold above 4215, a follow-through short position yielded a small profit;
Later, a light-position long below 4185 also produced a modest gain.
Overall profits were not impressive, mainly because the price did not reach the ideal trading zones.
💵 Trading Strategy for Today
📉 Sell on Rebounds
Watch around 4200 as resistance.
If price fails to break through, consider light short positions.
If a strong breakout occurs, monitor the 4210–4215 area for continuation.
📈Buy on Pullbacks
Focus on the 4170–4160 support zone → suitable for light long entries.
If price extends lower toward 4156 or even 4140-4130, consider adding long positions gradually.

Consider buying at the low point. Sell at the resistance level.Gold saw little movement in the Asian and European markets, but the rebound in the US session was weak, remaining under pressure below 4220, just as Quaid predicted over the weekend, perfectly reaching the profit target.
The 1-hour chart still shows an overall sideways trend, but the gold rebound is relatively weak. If gold rebounds in the US session and continues to be pressured below 4220, short positions can be considered, with support at 4160 to watch. Gold is likely to remain range-bound ahead of the Fed's interest rate decision.
Key resistance levels to watch are 4225-4230, while key support levels are 4165-4175. The technical picture indicates a consolidation trend, requiring patience to wait for key entry points.
Gold is still range-bound in the short term, without a clear one-sided trend, so continue trading within the range and wait for the Fed's interest rate decision to determine a clear direction for gold.
Trading Strategy:
Buy at 4160-4170, stop loss at 4150, profit target 4200-4230.
If the price rebounds to around 4220 and encounters resistance, you can maintain the strategy of shorting at that level. More trading information will be updated in the channel.

Gold: Watch 4216 Resistance and 4180 SupportLast Friday, gold briefly surged to around 4260 following the data release, but soon encountered heavy selling pressure and pulled back toward the 4200 area. During the rebound, the price failed to hold above 4216, a key level that has repeatedly shifted between support and resistance, and it has now once again become a major resistance zone.
On the 4H chart, short-term support lies near 4180. If interpreted as a potential double-top formation, the main support levels to watch are 4156 / 4138 / 4123 / 4110.
If gold continues to be suppressed below 4216 today and breaks 4170, tomorrow may offer a low-level rebound opportunity.
If the price rises back above 4216, attention should shift to whether 4228 and 4240–4245 can be reclaimed.
Short-term trading can temporarily focus on the 4170–4216 range, while closely monitoring any breakout of key support or resistance zones.
This Wednesday’s FOMC rate decision is the most important event of the week. If gold remains in a choppy pattern beforehand, the announcement is likely to trigger a strong directional move with significant volatility. If a one-sided rally occurs before the release—especially with supportive headlines—be cautious of potential profit-taking pressure once the “good news” is priced in.
Overall, both opportunities and risks coexist this week. Manage your positions wisely and trade according to your risk tolerance.

XAUUSD: Bulls Profited Friday — Sell the Rebound TodayLast week, gold moved largely within a choppy range. Early in the week, price surged to 4264 but failed to break higher and pulled back. Mid-week, gold traded in a narrow band around 4220, and on Friday it spiked to 4259 before rapidly reversing downward, closing at 4196—losing the key 4200 level directly.
The supportive factors for gold remain intact: the market is pricing in nearly a 90% chance of a Fed rate cut in December, and easing expectations tend to suppress real interest rates. In addition, geopolitical risks in the Middle East and the Russia-Ukraine conflict, along with strong global central-bank gold purchases, continue to provide support. However, stronger-than-expected U.S. non-farm payrolls pushed the dollar higher, weighing on gold. Friday’s spike-and-fade also showed profit-taking from the bulls, suggesting short-term downside tests of support may continue.
Before Thursday’s data release, gold may continue its choppy consolidation. Upside momentum will only be renewed if price breaks above 4260; a successful breakout could open the path toward 4300 and potentially 4350. Early in the week, price is likely to remain within a range. Key levels:
Near-term strength/weakness zone: around 4210
Minor resistance: 4225–4230
Higher resistance: 4245 and 4265
Supports: 4190, 4175, and 4160
At the moment, gold continues to dip and bounce repeatedly. Bullish momentum is still insufficient for a breakout, and without major catalysts, price is likely to remain range-bound. The market is waiting for Wednesday’s Fed rate decision, which will guide the next directional move. In the first half of the week, expect continued sideways action—ideal for short-term “sell high, buy low” trading. Trend trading favors selling rallies for now, with both high-sell and low-buy opportunities available.
Last Friday’s long setup based on the PCE data played out perfectly, and the post-pullback short-term long position also delivered profits.
Today’s trading plan:
Go long if price stabilizes above 4215; watch resistance at 4230. If it fails to break, consider selling.
Watch support near 4190; if it holds, look for buying opportunities.

Gold Under Pressure, Watch the 4207 LevelIn recent days, gold has continued to fluctuate within the 4250–4160 range. Lifted briefly by the positive ADP report yesterday, the price broke above the 4228 resistance and spiked to 4240, only to retreat shortly after. During the subsequent swings, the 4216–4228 zone once again acted as a firm resistance, and as of today, the price has still failed to break above it.
On one hand, U.S. Treasury selling has pushed yields higher, Liquidity in the gold market has decreased. On the other hand, easing tensions between Russia and Ukraine have reduced safe-haven demand. The combination of these factors has kept the bullish momentum suppressed. Meanwhile, the stability of downside support comes from rising expectations of Federal Reserve rate cuts. These conflicting forces have led to the current range-bound price action.
From a technical perspective, the key level to watch remains the 4230 resistance. Should the price continue to face pressure here—without support from upcoming news or data—it may pull back to test the 4152–4133 zone. Trend support on the daily chart has now risen to around 4096.
For short-term trading, keep an eye on the 4203–4207 resistance area, which serves as the immediate barrier before another attempt toward 4216–4228. As long as the price can hold above 4206, upward pressure is likely to ease, opening the door for a move toward 4250–4270.
Strategically, the focus remains on buying dips, especially if the price pulls back below 4160, which offers a relatively favorable entry within a ranging market. If the price fails to break above 4216, short-term selling opportunities may appear, but traders should manage timing and risk carefully.

Gold Bulls Suppressed Repeated Tests of 4200Gold continued to fluctuate between 4190 and 4240 today, with 4200 being repeatedly tested. This range is expected to be broken soon, as the main support level has been rising over time, currently around 4198. If this level is broken, I expect the price to fall below the low of 4163, reaching the 4150-4130 range. If the price drops rapidly to this area, a rebound is likely, similar to the market reaction after today's data release, although the rebound may not be as significant. Of course, this also needs to be considered in conjunction with news developments.
Therefore, we need to adjust our trading strategy. We should lower the buying range to below 4170, and at the same time, we should lower the selling range to above 4200.

Consider buying at a low point before the data is released.On Monday, gold prices rebounded after hitting a low of around 4163 in the US session, and have since reached a high of around 4228, approaching the previous high of 4235.
Although currently undergoing a minor pullback in the short term, the overall trend remains bullish, and there is a possibility of further upward breakout after a period of consolidation. The current support level will remain around the psychological level of 4200, and there is a possibility that this level will be broken.
However, given the current overall situation, a continuous decline is relatively unlikely. In a sustained uptrend, Monday's pullback serves as a significant indicator of bullish correction. Key support remains around 4190, a level crucial for future price movements.
If the price continues to consolidate above 4200 in the European session, a long position could be considered. Key resistance remains around Monday's high of 4235; a break above this level could lead to further gains.
In the short term, it's advisable to patiently wait for a pullback before going long. Consider buying around 4190-4195, with a target of 4230-4150 and a stop-loss at 4180. This trading strategy will remain unchanged until the US data release. I will also update the channel with information based on market movements.

Gold Aiming for 4300? Watch U.S. PMI and ADP DataYesterday, gold once again showed a roller-coaster pattern—high-level consolidation, a pullback downward, yet still maintaining strong resilience near the highs. During the U.S. session, it fell to around 4163, but the late session recovered the losses strongly. If gold continues to hold this kind of structure, we may see the daily chart gradually shift into a rising consolidation, bringing the market back to a bull-dominant phase.
Although gold faces short-term profit-taking pressure, multiple factors—including Fed rate-cut expectations, strong central-bank buying, falling U.S. yields, a weaker dollar, and ongoing geopolitical uncertainty—continue to support the upside breakout. Looking ahead, the 5000 target may not be unrealistic. Keep a close eye on the Federal Reserve and upcoming key economic data.
Today, on rebounds, continue to watch the 4236–4245 and 4265 resistance zones; if price approaches but fails to break, consider light short positions. On pullbacks, first monitor 4211–4193, and if that breaks, watch the 4176–4163 support levels.
Price action remains highly repetitive at the moment. Short-term movement shows high-level choppy consolidation with repeated spikes and pullbacks. Maintain your rhythm—avoid chasing trades, and pay attention to disciplined execution.
Yesterday’s public plan was to buy near 4200, short around 4230, then buy again below 4178 and close at 4187, waiting for another dip to re-enter. However, the market turned strong, so we chased lightly in the 4187–4180 area and are still holding. If resistance near 4245 fails to break, the long positions will be closed, and we will shift to short trades.
Therefore, today’s trading plan is:
Sell above 4240
Buy below 4200
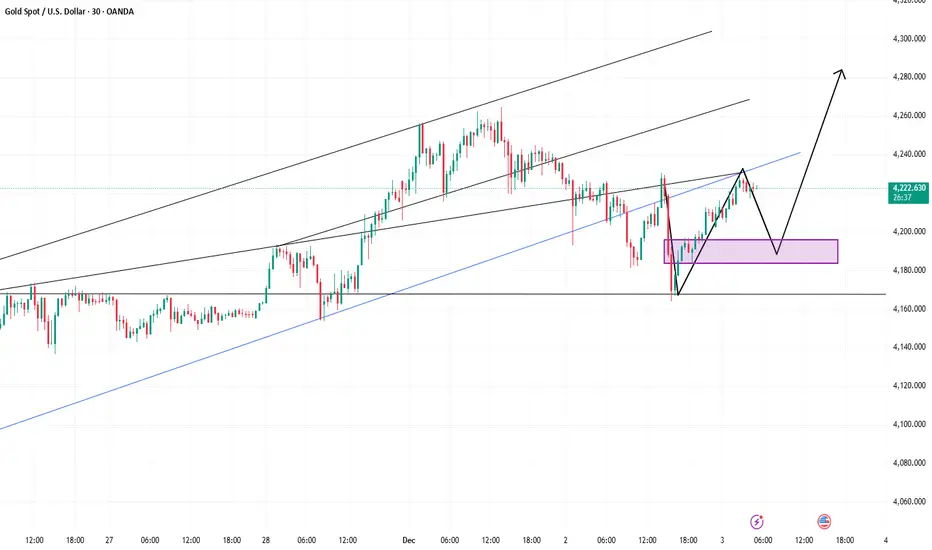
Support level confirmed. You can buy after the pullback.Currently, the upward momentum for gold is weakening. If gold wants to continue its upward trend, it still needs to patiently wait for a pullback opportunity. The strategy of placing long positions on Monday has successfully yielded good profits.
On Tuesday, after the Asian market opened, gold immediately retraced to the 4200 level. This downward move after consolidation is actually the market confirming the effectiveness of support. A valid pullback is necessary for a more stable upward move later. Currently, there is no significant resistance level for gold, and the overall outlook remains bullish in the short term.
The key support zone is concentrated in the 4200-4190 area, where the trend line and moving average intersect, and it is also an important defensive level for a stepped upward move. If the price breaks through the 4235-4245 resistance zone, a bullish position can be held patiently, targeting a breakout of the 4270 resistance level.
Note that a shooting star pattern with high volume appeared on the four-hour chart on Monday, indicating short-term selling pressure in the market. Only by stabilizing above 4270 can the upside potential to 4330-4380 be further unlocked.
Note:
If the price falls below the 4200-4190 support zone, we need to remain on the sidelines and avoid making any trades. With the downside potential opening up, a short-term pullback to the 4160-4140 Fibonacci retracement level is possible. This area will determine whether the upward trend can continue; pay close attention to any stabilization signals here.
Aggressive traders may consider initiating a small long position around 4200-4205. I will adjust my strategy flexibly based on market fluctuations and update the channel accordingly.
Gold: Shorts from 4250 Profit — Beware of Shakeouts TodayOn Monday, gold moved higher within a range. It first surged to 4255 but met resistance and pulled back to find support, then consolidated around 4220 before moving upward again. Later, it was once more pressured downward near 4265. Yesterday, I publicly suggested buying below 4220 and watching the resistance near 4250—selling if the structure turned unfavorable. Today, gold pulled back below 4200. After taking profits perfectly during the drop, we executed a new long entry and captured a small gain.
From a technical perspective, based on the triangle breakout projection, the short-term key support zone defining bullish or bearish strength is 4170–4180. Within this zone, the strategy remains to follow the trend and buy. On a larger scale, gold is trading within the 4380–3890 range, which serves as the trend divider: a breakout above 4380 would restart the bullish trend, while a breakdown below 3890 would confirm a bearish trend.
So far, gold has completed its first test of the 4200 area. The short-term pattern continues to reflect a cycle of pushing higher, pulling back, retesting, and repeated consolidation. This level is likely to see more fluctuations. The key focus is whether the market can reclaim 4236–4245 during the next upward move.
Today’s trading plan:
Sell lightly near 4245 on a rebound; if the price breaks strongly, watch the resistance near 4265.
Buy near 4200 on pullbacks; if support breaks, watch the 4179 zone.

It's the right time to go long on gold.Monetary Policy: Rate Cut Expectations Become the Strongest Driving Force
Current CME FedWatch data shows that the probability of a 25 basis point rate cut in December has risen to 86.9%. Several Fed officials have sent dovish signals, and remarks from core decision-makers have strengthened expectations of a policy shift. The market has even raised its forecast for rate cuts this year and next to 4-5 times. A rate cut will directly lower the US dollar index and real interest rates. As a non-yielding asset, the opportunity cost of holding gold will decline significantly, and funds will flow from money market funds and short-term bonds to gold, opening up space for gold prices to rise.
Market Demand: Central Banks and Private Investors Form a Gold Buying Alliance
Global central banks' gold purchases have continued to support gold prices. In the first three quarters of 2025, global central banks' net gold purchases reached 902 tons, setting a new historical high. China, Qatar, and other countries continued to increase their holdings in November. At the same time, Western ETFs saw the largest monthly inflow of funds since mid-2022, creating a situation where central banks and private investors are simultaneously increasing their positions. Meanwhile, gold supply growth has almost stalled, and this imbalance between supply and demand further solidifies the foundation for gold price increases.
Geopolitical Risks: Safe-Haven Attributes Remain Activated
The Russia-Ukraine conflict and the situation in the Middle East continue to escalate. The ineffective implementation of the Lebanon-Israel ceasefire agreement makes it difficult to ease regional tensions. Additionally, events such as the US sending troops to Venezuela have increased global geopolitical uncertainties. These risk events constantly stimulate market demand for safe-haven assets. As a traditional safe-haven asset, gold remains the core choice for investors seeking refuge, providing continuous emotional support for going long.
Today's Gold Trading Strategy
buy:4210-4220
tp:4230-4250-4300
sl:4195

There is still room for a bullish positionGeopolitical conflicts continue to activate the demand for safe-haven assets.
The uncertainty of global geopolitical situations provides continuous emotional support for gold. The conflict between Russia and Ukraine has entered a stalemate phase, and the winter energy supply competition has intensified; the situation in the Middle East has been fluctuating, and the implementation of the ceasefire agreement between Lebanon and Israel is questionable, and the risk of regional armed conflicts is still simmering. In addition, there are frequent local geopolitical frictions worldwide, driving funds to concentrate on gold, a traditional safe-haven asset. Historical data shows that during periods of escalating geopolitical risks, the volatility of gold increases by 30% compared to normal levels, and safe-haven buying often becomes the key driving force for short-term price breaks.
Central bank gold purchases provide long-term support
The global trend of central bank gold purchases continues, forming the most stable bottom support for gold prices. In the first three quarters of 2025, global central banks net purchased 634 tons of gold, among which the central bank of China has continuously increased its holdings for 12 consecutive months, and its gold reserves reached 2,304.46 tons by the end of October; Poland, Turkey, and other countries are also accelerating their purchases, and Poland plans to increase its gold reserve ratio to 30%. More importantly, central bank gold purchases have accounted for more than one-third of the global annual gold output, and in the long term, they will continue to disrupt the balance of supply and demand. A survey by the World Gold Council shows that 95% of the surveyed central banks plan to continue increasing their holdings in the next 12 months, and structural buying demand will provide long-term support for gold prices.
Today's Gold Trading Strategy
buy:4225-4235
tp:4245-4255-4300
sl:4215

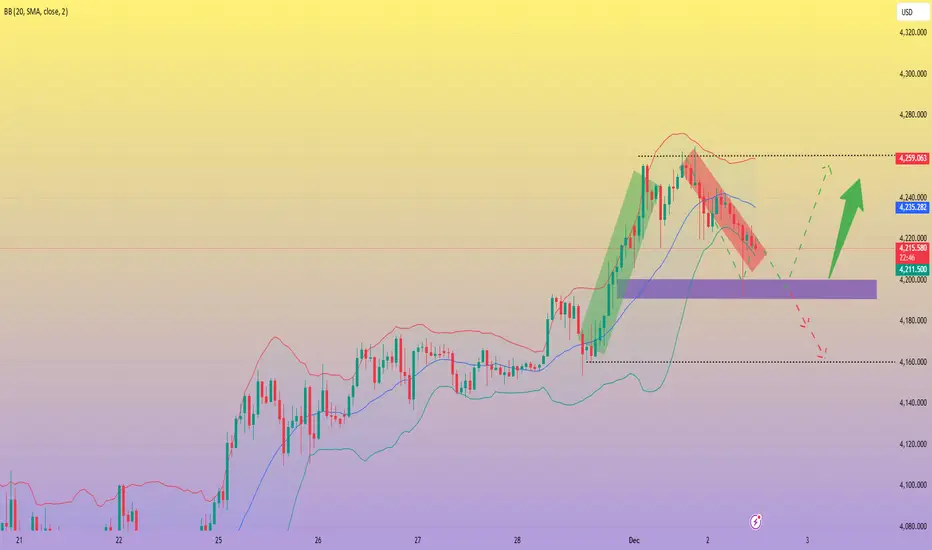
Intraday Buy Below 4220 — Spot On!After gold fell below 4220, it perfectly entered our buying range, and the price subsequently rebounded as expected, bringing us considerable profits again. Currently, you can choose to partially reduce your position to lock in profits, or close all positions to secure gains, depending on your own position size and risk tolerance.
Next, we need to focus on the resistance above 4250. If the price action at this level is unfavorable to the bulls, this will become a new short-term selling opportunity.
However, it's important to note that this is a short-term fluctuation; from a broader perspective, we remain firmly bullish. As I mentioned before, our next target is around 4300.

Gold Bulls Triumph — Watch Resistance Near 4250 IntradayBoosted by weekend geopolitical tensions, gold opened higher today, although the upside has been relatively limited. In terms of data, the key economic releases are concentrated from Wednesday to Friday, while today and tomorrow will be driven mainly by sentiment. Market focus should remain on the progress of the Russia–Ukraine peace talks. If negotiations move smoothly, it could temporarily suppress bullish momentum in gold, though rising rate-cut expectations may offset part of the impact. Ultimately, this week’s direction still depends on Wednesday’s data and the major releases that follow.
Technically, the daily chart continues to show a bullish structure. However, as prices approach the 4250 level, selling pressure is likely to increase. Without significant news catalysts, gold may continue to consolidate within the 4170–4250 range, waiting for data-driven momentum to break out.
For intraday levels, key support lies in the 4186–4178 zone, while resistance sits at 4240–4258. If gold directly surges into the 4250–4260 region, pay attention to the 4216–4208 support zone during any pullback triggered by profit-taking.
Overall, the trading approach remains unchanged — buy on dips continues to be the primary strategy.

ElDoradoFx – GOLD SESSIONS ANALYSIS (01/12/2025, ASIA SESSION)
1. Market Overview
Gold continues trending bullish after reclaiming 4,212–4,202 support and extending through 4,220–4,230 breakout zone. Price is currently consolidating near recent highs, showing controlled momentum — typical pre-session positioning before liquidity expansion in London. No macro weakness unless structure loses support.
⸻
2. Technical Breakdown
D1
• Macro bullish intact
• Price holding above daily EMA stack
• RSI mid-high range → continued strength
• Next structural expansion possible towards 4,250+
H1
• Strong bullish push after BOS at 4,215
• Price retesting channel support with higher-lows protected
• EMA alignment bullish (fast > medium > slow)
• As long as 4,212 holds — continuation is favoured
15M–5M
• Micro retracement forming Asian accumulation
• Short-term structure bullish while maintaining HL formation
• MACD positive side recovery → trend continuation probable
• Pullbacks into support = potential re-entries
⸻
3. Fibonacci Analysis (Golden Zone)
Swing Reference: 4,202 → 4,230
Level Price
38.2% 4,221
50% 4,216
61.8% 4,212
📌 Golden Re-Entry Zone: 4,221 – 4,212
⸻
4. High-Probability Trade Scenarios
📈 BUY Scenario (Primary Bias)
Re-test Entries: 4,221 / 4,216 / 4,212 liquidity sweep
🎯 Targets: 4,232 → 4,245 → 4,257 → 4,275+
🛑 SL below: 4,202
📈 BUY Breakout Setup
Trigger: Clean break & hold above 4,232
🎯 Targets: 4,245 → 4,257 → 4,281
🛑 SL: 4,219 break-back
⸻
📉 SELL Scenario (Countertrend Only)
Sell Zone: 4,232–4,245 rejection only
🎯 Targets: 4,221 → 4,216 → 4,212
🛑 SL: Above 4,250
📉 SELL Breakout Setup
Trigger: Break below 4,212
🎯 Targets: 4,202 → 4,194 → 4,185
🛑 SL: 4,223
⸻
5. Fundamental Watch
• No major news in Asia — controlled range expected
• London + NY likely to generate breakout expansion
• Higher volatility expected once volume enters
• Watch DXY — weakness fuels upside continuation
⸻
6. Key Technical Levels
Support: 4,221 / 4,216 / 4,212 / 4,202
Resistance: 4,232 / 4,245 / 4,257 / 4,275+
Breakout Buy Trigger: > 4,232
Breakout Sell Trigger: < 4,212
⸻
7. Analyst Summary
Market remains bullish above 4,212.
Best re-entry = pullback into Golden Zone → continuation to 4,245+.
Breakout above 4,232 unlocks next leg of strength.
Only consider sells from 4,232–4,245 rejection or if 4,212 fails.
⸻
8. Final Bias
Bullish until 4,212 breaks.
📌 Smart money favour continuation — structure clean, momentum sustained.
⸻
— ElDoradoFx PREMIUM 3.0 Team 🚀
⸻

Policy-driven Long Position Analysis(1) Divergence of monetary policies in developed economies supports gold valuation. The probability of the Fed cutting interest rates in December has declined from its peak, but "data shortage leading to cautious policy" is a short-term disturbance. The core contradiction of weak employment and economic stagnation remains unchanged, and the long-term easing direction is clear. More importantly, the probability of the Bank of England cutting interest rates in December has significantly increased. Bailey's statement suggests that "the decline in inflation will open the door for rate cuts", and the Bank of Japan maintaining a 0.50% interest rate unchanged and continuing its dovish stance have led to a sell-off of the yen, further highlighting the currency hedging value of gold. This "US and Europe waiting and watching, UK and Japan being more accommodative" divergence pattern weakens the upward momentum of the US dollar index, providing valuation support for gold.
(2) Escalation of geopolitical policy conflicts strengthens the risk premium. The geopolitical policy game in the Middle East continues to escalate, with the frequency of friction along the Lebanese border increasing by 30% month-on-month. The expectation of Hezbollah retaliation and the security risk of Iran's nuclear facilities form a dual threat. Such geopolitical policy conflicts not only directly stimulate the demand for hedging but also indirectly push up inflation expectations through disruptions to energy supply. As gold is a "anti-inflation + hedging" dual attribute asset, it becomes the optimal choice in periods of policy uncertainty. Historical data shows that during the period of geopolitical policy upheaval, the risk premium of gold can persist for 1-2 weeks, and the correction amplitude is usually no more than 3%.
(3) Policy transmission path: Suppressing the US dollar and reducing holding costs. The combined effect of monetary policy divergence and geopolitical risks makes it difficult for the US dollar index to form an effective breakthrough. The rising expectation of the UK to cut interest rates suppresses the pound, but the drag on the yen from Japan's easing, and the lack of US dollar buying due to the cautious policy of the Fed, have caused the US dollar index to be in a range-bound state. At the same time, the easing policy trend of major global economies has pushed down real interest rates, reducing the opportunity cost of holding gold, which aligns with the core pricing logic of "downward real interest rates → gold rises".
Next week's gold trading strategy
buy:4210-4220
tp:4230-4250-4300
sl:4195