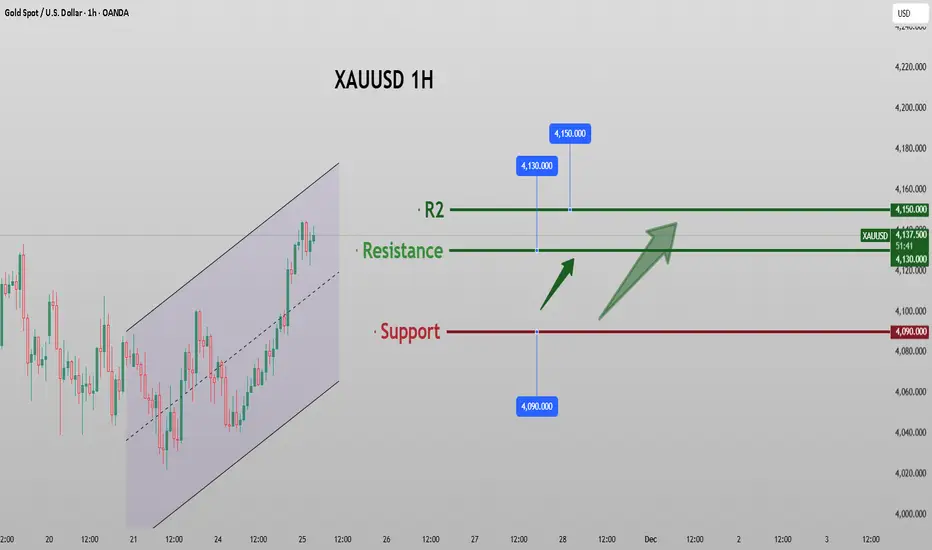
Gold is about to Experience A Significant SurgeThe current gold trend is caught in a tug-of-war between “macro bullish forces” and a “rebound in risk appetite.” While easing geopolitical tensions and a recovery in risk assets are limiting traditional safe-haven inflows, the Federal Reserve’s confirmed shift toward monetary easing is reshaping asset-pricing dynamics.
With real rate expectations moving lower and the U.S. dollar weakening, gold’s appeal as a hedge against currency depreciation and policy uncertainty has risen significantly. In the short term, as long as the 4030 support holds, the bulls remain in control.
Close attention should be paid to the upcoming Durable Goods Orders, Initial Jobless Claims, and Chicago PMI data, as well as speeches from FOMC members. These factors will determine whether gold can successfully break above 4200 and begin a new upward wave.
As for the current technical structure—just as I mentioned during the Asian session—there is resistance near 4169 and support around 4146. Overall, the 4169 barrier is unlikely to stop the bulls’ advance. We are holding long positions and already sitting on solid profits. Remain patient as the market attempts a breakout; you may also choose to close positions and re-enter after the trend is confirmed. If any changes occur in the structure, I will update everyone promptly.
Xauusd1h

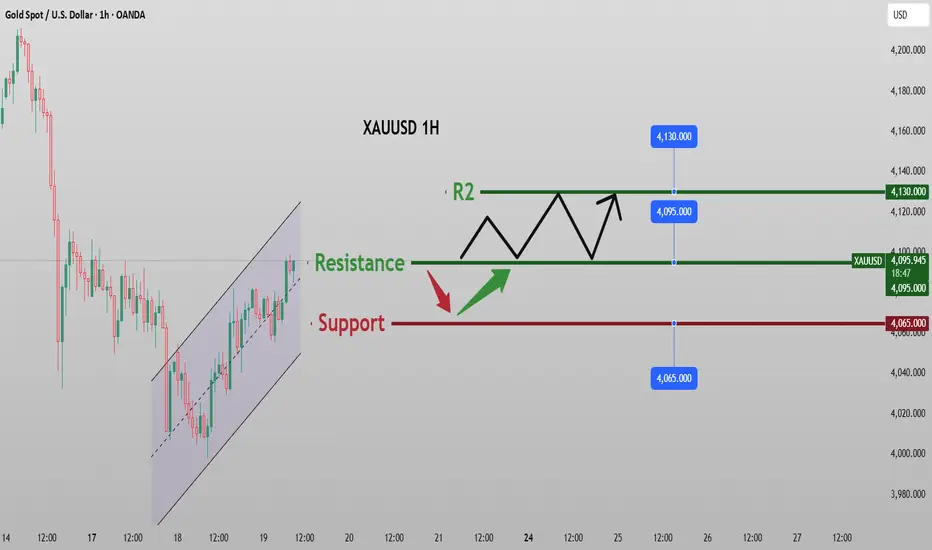
Prices are trending upwards. Continue to break through.The hourly chart for gold shows that after a sustained price increase, it rose again to around 4156 in the Asian session, approaching a key trend resistance level. Due to the recent market consolidation and lack of momentum after the continuous rise, a pullback occurred as expected during the European session, reaching a low of 4109, close to the 38.2% Fibonacci retracement level of Monday's gains. Currently, the price has rebounded but failed to break through the Asian session high, and the overall trend remains consolidating.
The 1-hour moving averages have formed an upward golden cross and are diverging, indicating that gold bulls still have some upward potential. Even though safe-haven demand has eased, the price is holding firm around 4100, where a strong support level has formed.
In terms of trading strategy, it is recommended to pay close attention to the performance of the support area below. If the price stabilizes at 4109 and forms a double bottom, long positions can be considered, corresponding to the support of the 5-day and 10-day moving averages on the daily chart.
The upside resistance level to watch is the 4155-4160 area. If it can be broken through effectively, it may further test the 4200 level. In the short term, prices are expected to remain above 4100, indicating a continued strong market. However, if this level is breached, the market may shift to a weaker, more volatile trend, increasing the risk of short-term market corrections.
Trading Strategy:
Buy gold at 4110-4120, with a stop-loss below 4100, targeting 4150-4160; after a breakout, watch the 4200 level.
If gold breaks and holds above 4150 again, it may challenge the 4200 level. Is gold poised for a rally? I will adjust my strategy flexibly based on market fluctuations and update the information in the channel.

Central bank increases holdings on a regular basisGlobal central banks and investment demand form a long-term stabilizing force.
Central banks of various countries have been increasing their holdings of gold as a norm. The People's Bank of China has been continuously increasing its gold holdings for several consecutive months. In the first three quarters of 2025, global central banks' net gold purchases reached 902 tons. This strategic gold purchase has firmly established a long-term support for the gold price. The investment sector is also very active. In 2025, global gold ETFs saw a net increase of 473.1 tons. The inflow of funds in the third quarter reached a historical high, with a net inflow of 145.6 tons in September alone. Strong investment demand continues to push the gold price higher.
Gold trading strategy
buy:4120-4130
tp:4140-4150-4180
sl:4110

Awaiting data release. Short-term strategy.On Monday, gold consolidated above 4040, then maintained a slow upward trend throughout the European session, briefly surging above 4090 in the US session. Reaffirmed support for a December rate cut by two Federal Reserve officials provided momentum for a new round of gains, accelerating after breaking through the key 4100 level, reaching a high above 4130. The current correction appears to be over, and gold prices may be poised for a new upward trend.
On Tuesday, at the Asian open, gold prices retreated slightly from around 4133 to 4122 before rebounding, reaching a high of 4155 before pulling back. The short-term strategy is to buy on dips.
The 1-hour chart shows that the price has rebounded strongly and is generally trading above the MA10 moving average. The best short-term strategy is to go long around this moving average, with the best entry point around 4125-4135. It is important to note that the bullish defense should be set below 4120. If the price retraces below this level, it indicates that the market is not as strong as it seems. A further decline could test the 4105 area, which would present a second buying opportunity.
If a rebound begins around 4125, 4155-4160 will be a strong resistance level. A break above 4160 could accelerate the upward movement to 4180-4190.
Short-term trading strategy:
Buy gold on pullbacks to 4125-4130. As time progresses, if the European session doesn't see a pullback to this level, consider buying at 4130-4135, with a stop-loss below 4120. Profit targets are 4160-4170.
A crucial point to note is the large amount of data released today. Timely profit-taking is essential to avoid losses due to trend reversals caused by the data releases.

In-depth analysis of the core logic of going longThe macro policy and interest rate environment provide strong support. The dovish signals from within the Federal Reserve have been released intensively, and the probability of a rate cut in December has soared from 40% last week to 81%. The market's re-pricing of the easing policy has become the core driving force behind the sharp rise in gold prices. At the same time, US Treasury yields have fallen across the board, with the 10-year US Treasury yield dropping to 4.038%. The decline in real interest rates directly reduces the opportunity cost of holding gold. Meanwhile, the US dollar index has also retreated to 100.15. The negative correlation between gold and the US dollar has further expanded the upside potential of gold prices, providing a perfect fundamental environment for going long at the macro level.
The geopolitical and capital aspects have solidified the foundation for the upward trend. The situation between Russia and Ukraine has seen new developments, with Kiev sounding air-raid sirens, and the resurgence of geopolitical risks has driven safe-haven buying. Meanwhile, the conflict in the Middle East continues to escalate, and the shipping risks in the Strait of Hormuz have further enhanced the safe-haven attribute of gold. On the capital front, the holdings of the world's largest gold ETF (SPDR Gold Trust) have continued to increase, with institutions actively building positions. Coupled with a 47% year-on-year growth in global gold investment demand in the third quarter, the influx of capital has further strengthened the stability of the bullish trend. Additionally, global central banks have been continuously increasing their gold holdings, with the People's Bank of China having done so for 12 consecutive months, providing long-term strategic support for gold prices.
Gold trading strategy
buy:4090-4000
tp:4110-4130-4150
sl:4080
Gold continued its upward trend. Watch for key resistance levelsThe current 4-hour chart for gold shows that short-term moving averages are continuously overlapping and the trend is flat, indicating that the market's bullish and bearish forces are in a state of temporary equilibrium.
Price fluctuations are mainly confined to a large range of 4000-4130. Looking at the 1-hour chart, the previous Fibonacci retracement levels remain valid, with the key resistance level still at the psychological level of 4100. Therefore, a shorting strategy can be considered at this level.
If the price breaks through 4100, pay close attention to the 4130 level. This level is both a key resistance point from the previous period and a key resistance level of the daily trend line. Therefore, you can look for this level to enter a short position after the first resistance is broken.
Looking at the MACD indicator, no clear trend has emerged, which means that the direction of gold's price movement is still uncertain. We should pay attention to the divergence in the market going forward.
In terms of trading, it is recommended to focus on the adjustment and correction process of short-term technical indicators. Selling on rallies within the range is advisable. The first resistance level to watch is around 4100. If a significant breakout fails to occur, the price will likely return to range-bound trading.
Trading Strategy: Short positions can be initiated in batches around 4100-4110, with a stop-loss at 4120 and a profit target of 4070-4060.
If the price breaks through 4110 decisively, consider shorting again around 4135.

Watch for support and entry point for long positions: 4020.Negative news has been priced in; be wary of consumer data.
In the short term, from now until the next three months, gold is an overcrowded trade. Any information next week will be a risk for gold; only renewed hopes for an interest rate cut can boost prices. The meeting is scheduled for December 9-10, during which one or two additional data points may be released. Nevertheless, if expectations for a rate cut do not increase, gold prices are likely to remain stagnant.
The market expects investment demand to remain stagnant until the Fed clearly outlines its path. We need to be cautious whether a longer pause could catalyze a larger outflow of funds from the precious metals market.
After two rounds of pullbacks and sharp rises on Friday, gold prices consolidated slightly around 4065 at the close. Currently, there's no clear distinction between upward and downward momentum, and the market is likely to remain range-bound. A clear direction is unlikely in the first half of next week, and we'll have to wait for data releases before making new trades. One key level to watch next week is the area around 4030, which is the potential entry point for our entry strategy on the second day of next week.
On the hourly chart, gold is currently holding above 4020. If a pullback doesn't break this level next week, we can wait for a pullback to enter long positions. Similarly, if there's an initial rise, we'll still look at the resistance at 4100. Without a clear trend, we can focus on range trading for now. Market conditions are volatile, so please follow our real-time trading strategies.
Short-term trading strategy:
Buy around 4025-4030, stop loss below 4020, take profit at the 4080-4100 resistance level.

Negative factors continue to dominate the short-term trend. Negative factors dominate, suppressing the upward trend of gold prices.
Diminished expectations of interest rate cuts + Support from the US dollar: Currently, the probability of the Federal Reserve cutting interest rates in December is only 10%, and Morgan Stanley has even completely abandoned this expectation. As an interest-free asset, the fading expectations of interest rate cuts will significantly reduce the attractiveness of gold. At the same time, the US dollar index has formed a solid support at 100.3, and gold and the US dollar usually have a negative correlation. The strength of the US dollar will continue to put pressure on gold prices, which is the core factor suppressing the gold price next Monday.
-Decline in geopolitical risk demand: Recent cease-fire negotiations between Palestine and Israel have continued, and the conflict in Ukraine has also sent out signals of cooling. Previously, the risk-averse funds that bought gold due to concerns over geopolitical conflicts are gradually withdrawing. The decline in risk-averse demand has deprived gold of an important upward momentum. This trend is likely to continue until next Monday, further suppressing the gold price.
-Weak technical signals: On November 21, the international gold price has fallen below the key support level of 4050 US dollars, and is at the end of the triangular convergence range, showing a trend of continuously lower highs. The weak technical pattern will affect investor sentiment. Short-term there will be few large-scale buy orders to support the gold price, and even some investors may prematurely sell for risk aversion, further intensifying the downward pressure on the gold price.
Next week's gold strategy analysis
sell:4075-4065
tp:4055-4035-4000
sl:4085

ElDoradoFx – GOLD ANALYSIS (21/11/2025, ASIA SESSION)1. Market Overview
Gold remains inside a multi-day consolidation after rejecting the H1 descending trendline and repeatedly holding the $4,060–$4,072 demand zone.
The current structure shows a tight triangle compression where liquidity is building on both sides, suggesting a breakout is imminent during Asia–London transition.
Daily timeframe still maintains a bullish macro bias, but the intraday orderflow is mixed due to repeated rejections from the $4,083–$4,094 supply zone.
⸻
2. Technical Breakdown
🔵 D1 (Daily)
• Price continues to respect the D1 bullish structure, with swing low protection at $3,947–$3,908.
• Daily candle currently forming above D1 50% equilibrium (around $4,012).
• D1 demand: $4,000–$3,947 remains the key macro support zone.
• RSI recovering from mid-level; MACD histogram still negative but flattening → early signs of re-accumulation.
🟣 H1 (1-Hour)
• H1 structure is compressing between:
• Descending trendline resistance at $4,083–$4,090
• Demand block $4,061–$4,072
• BOS to upside requires clean break and 1H close above $4,083.
• BOS to downside requires break below $4,060.
• EMAs: Price currently between the EMA100 & EMA200, signalling indecision.
🟢 15M–5M (Intraday)
• 5M shows momentum shifting bullish after sweeping liquidity at $4,060.
• 15M triangle squeezing price for breakout.
• MACD histogram strongly recovering intraday; 5M confirmations already switched to long.
⸻
3. Fibonacci Analysis (Golden Zone)
Using most recent swing:
Swing High: $4,132
Swing Low: $4,041
🎯 Golden Zone (61.8%–78.6%)
➡️ $4,087 – $4,094
This aligns perfectly with H1 supply → high-probability reaction zone.
⸻
4. High-Probability Trade Scenarios
🟢 BUY SCENARIOS
➡️ Buy Setup #1 – Pullback Buy
• Entry Zone: $4,072 – $4,066
• Confirmation: 5M CHoCH + bullish MACD turn
• Targets:
• TP1: $4,083
• TP2: $4,094 (Golden Zone)
• TP3: $4,110
• Stop Loss: Below $4,060
• Reasoning: Strong demand + swept liquidity + trendline support.
➡️ Buy Breakout Setup
• Break Entry: Above $4,083
• Confirmation: 5M candle close + retest
• Targets: $4,094 → $4,110
• Invalidation: Rejection back under $4,078.
⸻
🔴 SELL SCENARIOS
➡️ Sell Setup #1 – Rejection of Golden Zone
• Entry Zone: $4,087 – $4,094
• Confirmation: 5M bearish engulfing + MACD shift
• Targets:
• TP1: $4,072
• TP2: $4,060
• TP3: $4,053
• Stop Loss: Above $4,100
• Reasoning: Major supply + trendline + 78.6% Fib alignment.
➡️ Sell Breakout Setup
• Break Entry: Below $4,060
• Targets: $4,053 → $4,043 → $4,032
• Invalidation: Back above $4,066.
⸻
5. Fundamental Watch
• Asia session: Low volatility expected until London.
• No major early macro news.
• Expect liquidity sweeps and algorithmic moves before establishing direction.
• Market anticipating US data later → choppiness likely.
⸻
6. Key Technical Levels
Resistance
• $4,083–$4,094 (Golden Zone + H1 supply)
• $4,110 (breakout target)
• $4,132 (swing high)
Support
• $4,072
• $4,066
• $4,060 (critical line)
• $4,053 / $4,043
• $4,000–$3,947 (D1 demand)
Breakout Triggers
• Bullish: Above $4,083
• Bearish: Below $4,060
⸻
7. Analyst Summary
Gold is at a decisive moment. The market is building pressure inside a narrowing structure while sitting on top of a defended demand zone. Intraday bias is bullish above $4,060, but macro supply remains heavy until $4,094 breaks cleanly.
Expect a breakout session as liquidity is primed on both sides.
⸻
🥇 ElDoradoFx PREMIUM 3.0 – PERFORMANCE 20/11/2025 🥇
🔥 Precision • Momentum • Profit
━━━━━━━━━━━━━━━
📊 XAU/USD – DAILY RESULTS
🟢 BUY +100 PIPS
🟢 BUY +50 PIPS
🟢 BUY +60 PIPS
🔻 SELL +210 PIPS
🟢 BUY +40 PIPS
🔻 SELL +40 PIPS
❌ SELL -30 PIPS (SL)
🔻 SELL +40 PIPS
🟢 BUY +220 PIPS
🟢 BUY +390 PIPS
━━━━━━━━━━━━━━━
▶️ NFP LIVE TRADING SESSION
🔻 SELL +250 PIPS
🔻 SELL +100 PIPS
🔻 SELL +170 PIPS
🔻 SELL +130 PIPS
━━━━━━━━━━━━━━━
💎 SWING TRADES – STILL RUNNING
📈 BUY → +2,850 PIPS
📈 BUY → +1,320 PIPS
━━━━━━━━━━━━━━━
💰 TOTAL PIPS GAIN: +1,770 PIPS
🎯 14 Signals → 13 Wins (1 SL)
🔥 Win Accuracy: 93%
━━━━━━━━━━━━━━━
Huge day for PREMIUM 3.0 — strong scalps, clean intra-day flows, live session domination & powerful swing positions still delivering!
Congrats if you profited — let’s keep pushing smart gains! 🚀💰
— ElDoradoFx PREMIUM 3.0 Team 🚀

The core logic for going long on goldPositive macro support: In mid-October, the initial jobless claims in the US rose to a two-month high, indicating a cooling in corporate hiring intentions. This weak employment data has pushed the probability of the Federal Reserve cutting interest rates in December back above 50%, which is beneficial for the interest-free asset, gold. At the same time, global central banks have continuously increased their gold holdings for 12 consecutive months. In the first three quarters, domestic gold ETF holdings increased by 160% year-on-year. The sustained trend of central bank gold purchases provides a solid underlying support for the gold price. Additionally, geopolitical uncertainties such as the tense relationship between China and Japan continue to inject safe-haven buying momentum into gold.
Low-absorption opportunities in a volatile pattern: Currently, gold is generally in a high-volatile range. The weekly line has not broken the key support level of 3980. After the previous drop from 4110, it did not form a sustained downward trend. The pullback has become a good opportunity for low absorption. Moreover, 4061 is in the middle position between the support level of 4045 and the resistance level of 4098. It not only has the space to rebound with the support below but also conforms to the core logic of low absorption and going long in a volatile market.
Gold trading strategy
buy:4035-4045
tp:4065-4075-4120
sl:4025

Supporting the precise long-positioning strategyCore economic data disappointed, confirming the economic slowdown.
The core retail sales in the US dropped by 0.3% month-on-month in October (expected to remain unchanged), marking the largest decline since March 2024. At the same time, industrial output dropped by 0.6% month-on-month in October (expected to decline by 0.1%), with both core consumption and production indicators showing synchronous weakness, far exceeding market expectations. Historical data shows that when core retail sales and industrial output decline simultaneously, the probability of the Federal Reserve initiating easing policies within 3 months increases from 58% to 72%. This directly boosts the probability of a December interest rate cut from 44.4% to 48.2%. The early brewing of easing expectations provides strong support for the gold price.
The dovish faction of the Federal Reserve has spoken out, and policy differences have widened.
Federal Reserve Governor Bowman (previously hawkish) stated on November 19 that "We need to closely monitor the impact of economic slowdown signals on inflation. If the economy continues to weaken, we can assess the timing of the interest rate cut in advance." The dovish faction unexpectedly expanded, breaking the previous "hawkish dominance" of the舆论 landscape. Market sensitivity to policy shifts has significantly increased, further weakening the suppression power of hawkish remarks.
Gold trading strategy
buy:4065-4075
tp:4085-4095-4130
sl:4055
Gold: Watch Resistance at 4070–4114 Ahead of NFPGold dropped below 4010 during yesterday’s late session but quickly rebounded afterward, and many traders should have captured that long opportunity.
For today’s session, the main focus remains on whether the 4000 psychological level can hold.
Key resistance levels to watch:
4070 (first resistance)
4082–4091 / 4097–4104
Major resistance at 4110–4114
The 4020–4000 zone may see repeated fluctuations, but in the short term it will continue to attract buying interest. Therefore, buying on dips still carries a relatively high probability of success.
If price breaks below 4000 again, pay close attention to:
3986–3966 zone
3932 support
These areas represent the origin of the recent rebound. Previously trapped short positions are likely to cover and reverse into longs once they get out, while trapped longs above 4200 may also add positions to lower their average cost—both forces combined could provide solid support for another rebound.
Once gold returns above 4100, caution is necessary:
Watch 4070 as the key support during any pullback
If this level holds and the upcoming NFP report does not pressure the bulls, the market may attempt another move toward 4200
However, if the data turns out bearish, multiple catalysts could empower the bears, leading to another downward move to retest the critical 3886 support level
Overall, the short-term outlook remains dominated by key support/resistance interactions, while the medium-term direction depends on whether 4000 holds and whether upcoming macro data can revive bullish sentiment.

Policy signals + Risk aversion ebbBearish suppression: Policy signals + Risk aversion ebb
Economic policy statements from the Fed continue to gain momentum
San Francisco Fed President Daly explicitly stated that "a rate cut in December is not guaranteed", while Cleveland Fed President emphasized that "high interest rates are needed to curb inflation". A series of officials released hawkish signals, causing the expectation of a rate cut to fluctuate repeatedly and suppressing the confidence of bulls.
The end of the US government shutdown weakened the demand for risk aversion
After the US government resumed operations, the two-party negotiations came to an end for the time being, and market risk appetite recovered. The risk premium of gold continued to wane. Coupled with the easing of the geopolitical situation in Venezuela (with Trump's team suggesting that dialogue might be possible), the inflow of short-term risk-averse funds slowed down, forming resistance for price growth.
Gold trading strategy
sell:4050-4060
tp:4030-4010
SL:4070

Room Remains for Rate Cut Expectation RecoveryMacroeconomic Policies & Economic Data: Room Remains for Rate Cut Expectation Recovery
1. Intensified Game of Policy Expectations, but Loosening Trend Unchanged
Recent hawkish signals from Fed officials have caused the probability of a 25-basis-point rate cut in December to plummet from 67% a week ago to 44.4%, yet the core driving logic has not undergone a fundamental reversal. The U.S. core PCE in October remained in a moderate range of 2.8%, while the University of Michigan’s November Consumer Sentiment Index dropped to 50.3 (the lowest since June 2022). Rising economic downside risks have reserved space for subsequent easing.
--------------------------------------------------------------------------------
2. U.S. Dollar and Treasury Yields Provide Marginal Support
The ICE U.S. Dollar Index fell to a one-week low of 99.55. A weaker dollar reduces the gold-purchasing cost for non-U.S. currency holders, directly stimulating global physical demand. Although the 10-year U.S. Treasury yield has rebounded above 4.5%, there is still room for a pullback from previous highs. Upward pressure on real interest rates is limited, failing to form sustained suppression on gold prices.
--------------------------------------------------------------------------------
3. Key Data to Be Released, Expectation Gaps Bring Opportunities
With the end of the U.S. government shutdown, backlogged key data such as the September nonfarm payrolls report will be gradually released. The market is eager to verify the true economic situation through data. If the data shows a combination of "weak employment + moderate inflation," it will directly drive the recovery of rate cut expectations and serve as a catalyst for the gold price rebound.
Gold trading strategy
buy:4060-4070
tp:4090-4100-4150
sl:4045

With Rate-Cut Expectations Shifting — How Should Gold Be Traded?Driven by a series of hawkish remarks from Federal Reserve officials, market expectations for a December rate cut plunged sharply—from over 60% at the start of the week to below 46%. Under the dual pressure of policy uncertainty and a temporary “data vacuum,” gold bulls were forced to pause. Prices slipped from above 4200 back below 4100, drifting further away from the all-time high at 4380.
This week, the market will face the first wave of backlogged economic data following the government’s reopening, with the most critical releases being September’s NFP and unemployment rate.
If the data shows weakening labor conditions, rate-cut expectations may strengthen again, creating a rebound opportunity for gold.
Conversely, if the data remains strong, bearish pressure may intensify and push prices toward levels below 3800.
Statements from the U.S. Secretary of the Army indicating readiness for military action against Venezuela temporarily gave gold bulls some breathing room, but further developments remain uncertain.
In the short term, gold bulls face the challenge of holding the 4000 level. In the long term, this may merely be a "breathing room" in a long bull market; gold's structural appeal — central bank accumulation, geopolitical uncertainty, and the global demand for reserve diversification — is far from being shaken by short-term fluctuations.
Technically, the 1H chart shows a potential for a rebound, with the first resistance around 4128 and the core resistance zone of 4145-4165.
Before the data release, the market's focus remains on the gap below 4010, which also coincides with the psychological level of 4000. This combination will provide some support for the price, and a rebound is likely if this area is reached. This presents a potential buying opportunity. Secondly, there is a potential shorting opportunity in the resistance zone above 4140.

The core driving factors of the short-term reboundRelease of demand for oversold rebound
Gold plummeted rapidly from the 4211 high to around 4032, with a decline of over 3% in just 1-2 trading days, setting a record for the largest single-day decline in recent times. After the short-term selling pressure was concentratedly released, there is a technical recovery demand. The 1-hour RSI indicator quickly rebounded from the oversold zone, and the bearish momentum weakened. Short-term funds entered the market to buy bottomed out, promoting a phased recovery of the price, forming the first wave of rebound momentum.
The expectation of interest rate cuts has not been completely reversed
Although the signals released by Fed officials were hawkish, causing the probability of a December interest rate cut to drop from 62% to below 50%, the market's long-term expectation for the Fed's easing cycle has not changed - the US debt scale is high (over 36 trillion US dollars), the fiscal deficit continues to expand, and combined with core inflation approaching the 2% target, the long-term interest rate cut logic still exists. Some funds still adhere to the "policy easing" main line, and they buy low after the price correction, providing funds support for the rebound.
Central bank gold purchases form a bottom support
The long-term support of global central bank gold purchases remains unchanged. In the third quarter of 2025, global central banks' net gold purchases were 220 tons, an increase of 10% year-on-year. The People's Bank of China has continuously increased its holdings for 12 consecutive months, and the 4000-4100 US dollar range has become the core "buy low" area for the official purchase. Strong physical demand has limited the downward space of gold prices, providing a safety cushion for the short-term rebound and preventing the price from continuing to fall in a single direction.
Gold has shown a "first rebound followed by decline" oscillating pattern in the short term. The core issue lies in the "short-term technical recovery" versus "long-term negative factors intensifying". During the rebound phase, it is crucial to closely monitor the resistance signals at the 4150-4180 range, as this is the core window for setting short positions; during the decline phase, it is necessary to pay attention to the effectiveness of the 4080 key support level, and if it is broken, one can increase positions accordingly.
In the operation, one needs to closely follow the policy signals of the Federal Reserve, changes in trading volume, and the progress of geopolitical situations, and flexibly adjust the stop-loss and take-profit positions. The core principle is "not to short ahead of time, not to blindly chase long positions", only entering the market after a clear signal of the shift between bulls and bears, and responding to market fluctuations with strict risk control discipline to achieve short-term stable gains.
Gold trading strategy
buy:4075-4085
tp:4100-4120-4200
sl:4060

The logic of the gold rallyAfter the data vacuum period, policy signals will become clear
The US government shutdown led to the absence of some economic data, forcing the Federal Reserve to temporarily maintain a "neutral stance". However, as the data is gradually completed, the policy path will become clearer. Historical experience shows that the policy expectation correction after the data vacuum period often leads to an increase in gold volatility. And the current 4085 correction level precisely provides a safe entry window for the policy-driven upward trend.
Next week's gold trading strategy
buy:4065-4075
tp:4085-4095-4130
sl:4055

The positive factors have not changed.The positive factors remain unchanged, and the resilience of support is prominent.
The demand for gold by central banks is rigid, and the physical support is strong.
The trend of central banks purchasing gold globally has continued to strengthen. In October 2025, the net gold purchase by central banks worldwide reached 78 tons, with growth of 15%. Among them, the People's Bank of China increased its holdings by 23 tons in a single month, continuing to increase for 13 consecutive months, and its official gold reserves rose to 2,327.46 tons. The Reserve Bank of India also increased its holdings by 12 tons simultaneously. The demand for "de-dollarization" by emerging market central banks remains the core driving force. According to the World Gold Council, currently, central bank gold purchases account for 35% of the global total gold demand. The supply side of physical gold is in a tight balance due to the slowdown in the growth rate of gold production (only 2% year-on-year). The range of 4,080 - 4,090 US dollars has become the key price for central banks to "buy at a low price", providing strong support.
The expectation of interest rate cuts has marginally strengthened, and the advantage of holding costs continues.
The Federal Reserve's interest rate meeting in November maintained the rate unchanged, but the meeting minutes clearly stated that "inflation is approaching the 2% target, and the cooling of the job market is in line with expectations". The probability of a 25 basis point interest rate cut in December from 60% rose to 68%. The core PCE of the United States in October was 2.3%, the lowest since 2021, and the actual interest rate further declined to 1.8%. The opportunity cost of holding gold has continued to decrease. At the same time, the scale of the Federal Reserve's balance sheet has decreased from 95 billion US dollars per month to 60 billion US dollars, and the liquidity environment has marginally relaxed, providing policy support for the upward movement of gold.
Next week's gold trading strategy
buy:4065-4075
tp:4085-4095-4130
sl:4055

Threefold certainty-driven, solid multi-head foundationCentral bank gold purchases form a "price bottom": The People's Bank of China has continuously increased its gold holdings for 12 consecutive months, with the latest reserve amount approaching 2,305 tons, and the cost of gold purchases falling within the range of 3,900 - 4,000 US dollars; global central banks' net gold purchases in the first three quarters of 2025 exceeded 800 tons, and 3,950 US dollars became the "supporting bottom" for central banks. Once it falls below this level, there is a high probability of triggering an increase in buying.
Geopolitical risks are regularly supporting the demand for safe-haven assets: The prolonged conflict in Ukraine and the escalating unrest in the Middle East have formed a multi-polar conflict network, highlighting the strategic allocation value of gold as an "ultimate defense asset". Historical data shows that during periods of ongoing geopolitical conflicts, although the volatility of gold increases, the correction range is limited, often serving as a safe haven for funds.
The broad direction of the Fed's loose policy has not changed: Although the probability of a December interest rate cut has dropped to 55%, and there are cautious voices within the Fed, the long-term loose logic remains unchanged - the government shutdown in the United States may lead to a 1.5% GDP decline in the fourth quarter, and under the pressure of weak economic conditions, the interest rate cut cycle in 2026 will continue. In a low-interest-rate environment, the attractiveness of gold as a non-interest-bearing asset continues to increase.
Today's gold trading strategy
buy:4165-4175
tp:4185-4200
sl:4155
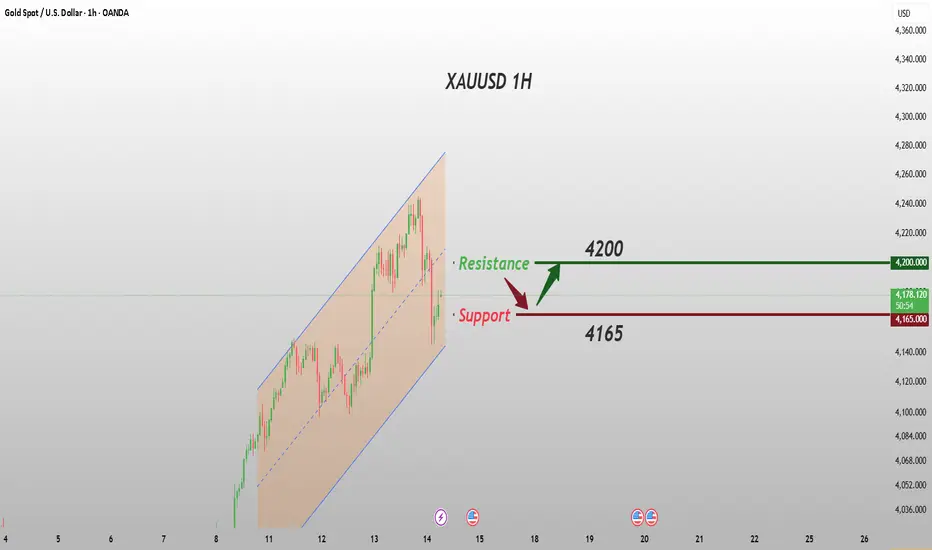
Gold: Watch Support Near 4168 and Resistance at 4252With strong rate-cut expectations combined with heightened geopolitical tensions, gold’s safe-haven appeal has been significantly reinforced, pushing prices back above the 4200 level. From a medium-to-long-term perspective, gold still has considerable upside potential, with some voices in the market even calling for a move toward 5000.
In the short term, the U.S. government is about to resume operations, and the delayed economic data will soon be released. The market widely expects these reports to confirm a slowdown in the U.S. economy. Meanwhile, the White House has cautioned that October’s employment and inflation data may not be published on time due to the disruption caused by the shutdown. This uncertainty has further intensified concerns about the economic outlook, providing continuous support for gold’s upward momentum.
However, it’s worth noting that the policies and data released after the government’s reopening remain uncertain. The market has already priced in a considerable portion of bullish expectations. If the actual results align with these expectations, the short-term upside could be limited; if they diverge, a corrective pullback would be likely. Therefore, proper risk management is essential to navigate potential volatility.
Technical Outlook:
On the daily chart, moving averages show a strong bullish alignment. The current uptrend is supported by the MA5 (around 4127), while the key support lies near the MA30 (around 4074). The MACD has formed a bullish crossover, and the price is moving between the Bollinger Bands’ middle line (4075) and upper band (4298).
This means that during the price consolidation around 4200, key supports to watch are 4150–4127 and the middle band near 4075. (Indicator levels may shift as volatility increases, so real-time monitoring is recommended.)
On the 1-hour chart, the main supports are 4168/4152/4138. As long as these levels hold, gold still has room to test 4223–4250 in the short term. With supportive news catalysts, a move toward 4300 cannot be ruled out.
Overall, next week’s market will likely see heightened volatility. Opportunity and risk coexist — those who manage position size and timing well could see their profits multiply, while those lacking discipline and risk awareness could face severe drawdowns or even liquidation.

The core support of the bullish trendLoose expectations dominate the macro logic: The probability of the Fed cutting interest rates in December has risen to 65%. Coupled with the possible weak economic data after the US government shutdown, the New York Fed's indication of possibly restarting asset purchases, the expectation of loose market liquidity continues to rise, significantly reducing the cost of holding gold, constituting the core driving force for the bulls.
Risk aversion and capital resonance: Global central banks continue to accumulate gold (net purchases of 800 tons in the first three quarters of 2025), and the repeated geopolitical conflicts (Russia-Ukraine, Middle East situation) drive the demand for risk aversion. At the same time, the SPDR gold ETF's holdings increase and the gold-to-silver ratio narrows, reflecting the continuous inflow of institutional funds into the precious metals sector, with a strong bullish atmosphere.
Today's gold trading strategy
buy:4190-4200
tp:4210-4230
sl:4180

ElDoradoFx – GOLD ANALYSIS (12/11/2025, US SESSION)🧭 Market Overview
Gold enters the US session trading around $4,129, holding above $4,110 after multiple rebounds during the London session. Volatility remains contained as traders await the US CPI release (13:30 UK) — a major catalyst for direction. The overall structure remains bullish but capped under the $4,138–$4,145 resistance zone, where sellers have defended since early Asia.
⸻
📉 Technical Breakdown
Daily (D1)
• Price maintains a bullish correction phase after bouncing from the $4,014–$4,020 demand zone.
• The 50EMA supports the uptrend structure, while RSI ~59 suggests room for continuation before overextension.
• A daily close above $4,138 may confirm bullish extension toward $4,160–$4,180, while failure below $4,098 reopens the path toward $4,050–$4,020.
1H (H1)
• Gold continues to trade within a narrowing ascending channel.
• Dynamic resistance aligns around $4,138–$4,145, coinciding with the 200EMA and recent liquidity wick.
• RSI consolidating near 55 and MACD histogram flattening — awaiting momentum breakout.
• The short-term equilibrium range is $4,110–$4,138, favoring dip buys unless a clean hourly close below $4,098 occurs.
15M–5M (Intraday)
• Price structure shows consecutive higher lows, maintaining bullish microtrend integrity.
• The Golden Zone retracement (4,122–4,110) aligns with the 61.8% Fibonacci and EMA confluence — a key support cluster for potential bullish reaction.
• RSI hovering near 50; MACD beginning to cross upward after consolidation — momentum shift likely post-CPI.
⸻
✨ Fibonacci Analysis (Last swing 4,095 → 4,138)
• 38.2% = 4,122
• 50.0% = 4,116
• 61.8% = 4,110
🎯 Golden Zone: 4,122 – 4,110
This zone remains the most efficient area for liquidity-based buy setups, provided market reaction confirms with bullish engulfing or CHoCH signals.
⸻
🎯 High-Probability Trade Scenarios
📈 BUY SCENARIO (Main Bias)
• Buy Zone: 4,122 – 4,110 (Golden Zone + 50EMA confluence)
• Targets: 4,138 → 4,160 → 4,175
• Stop Loss: Below 4,098
• Confirmation: Bullish engulfing or CHoCH on 5M–15M after liquidity sweep near 4,110.
• Comment: Momentum remains bullish above 4,110; any CPI downside reaction should be seen as retracement, not reversal, unless 4,098 breaks.
📉 SELL SCENARIO (Countertrend Liquidity Play)
• Sell Zone: 4,138 – 4,145 (Key liquidity area + 200EMA)
• Targets: 4,122 → 4,110 → 4,095
• Stop Loss: Above 4,152
• Confirmation: Bearish divergence on RSI or BOS below 4,124 on 15M timeframe.
• Comment: Valid only if CPI surprises to the upside, strengthening USD temporarily.
💥 Breakout Setup
• Trigger: Break & close above 4,145
• Retest: 4,138–4,140
• Targets: 4,160 → 4,175 → 4,190
• Stop Loss: Below 4,126
• Comment: A confirmed break above 4,145 would shift structure to fully bullish with renewed continuation toward the October highs.
⸻
🧠 Fundamental Watch
• US CPI report (13:30 UK) — expected to dictate volatility and direction for the remainder of the week.
• Consensus: A softer CPI print could weaken DXY and fuel gold upside above 4,145.
• DXY at 106.0 — holding flat; downside breakout below 105.8 would support bullish momentum on gold.
• Traders should expect fakeouts or volatility spikes 5–10 minutes before and after CPI release.
⸻
📌 Key Technical Levels
Type Levels Notes
Resistance 4,138 / 4,145 / 4,160 / 4,175 Major liquidity & supply area
Support 4,122 / 4,110 / 4,098 / 4,085 Intraday structure & Golden Zone
Golden Zone 4,122 – 4,110 Buy reaction area
Break Buy Trigger > 4,145 Bullish continuation confirmation
Break Sell Trigger < 4,098 Short-term reversal confirmation
⸻
🧾 Analyst Summary
Gold continues to respect its bullish structure, printing higher lows while consolidating below 4,145. The session’s directional move will depend heavily on CPI data. A confirmed break above 4,145 opens space toward 4,175–4,190, while rejection at that level may cause a short-lived retracement toward 4,110 before continuation.
⸻
📈 Final Bias Summary
Bias: 🔼 Bullish-to-neutral above 4,110
Invalidation: 🔽 Below 4,098
Volatility Trigger: US CPI (13:30 UK)
— ElDoradoFx PREMIUM 3.0 Team 🚀
⸻

Technical Analysis: Trend Inertia and Key Levels ResonanceStructural Support: The upward trend of gold price starting from 4000 has not changed. It forms a "higher low point + higher high point" step-like structure. Currently, the 4126 USD has stabilized at the support level transformed from the previous resistance (in the range of 4115-4120), and the pullback has not broken the 5-hour moving average, which conforms to the characteristic of "retracement to the moving average is support" in a strong trend; meanwhile, the small-level c-wave starting from 4086 has exceeded the 100% target level of 4120, and the short-term technical target points to the 123.6% position of 4148. The structure and target form resonance.
Momentum Signal: The 4-hour MACD continues to operate above the zero axis. Although the red bar has contracted, there is no "shortening of the red bar + new high price" top divergence. The DIFF line and DEA line maintain a bullish arrangement; RSI (14) rises to around 68, which is in the "unoverbought state of the strong range", and the rebound momentum has not been overdrawn. There is still upward space for the short term.
Key Price Levels: The lower 4115-4120 is the "resistance transformation support + 5-hour moving average" resonance zone, and 4100 is the trend life line; the upper 4148 is the target position of the small-level c-wave, and 4160 is the previous emotional high point suppression. A breakthrough will open up a larger upward space.
Today's gold trading strategy
buy:4110-4120
tp:4130-4140
sl:4095
