#XAUUSD(GOLD): +7350 Pips Swing Buy From A Safe Zone! Dear traders,
I hope you’re doing well.
Gold, after consolidating for a week or two, finally dropped significantly, indicating a strong bearish presence in the market. Currently, the bulls are still struggling to push the price higher. A possible scenario is to wait for the price to drop further to around $4650. This area looks promising and holds significant potential.
Good luck and trade safely!
Team Setupsfx_
Xauusd4h

Selena | XAUUSD · 30M – Bullish Structure Inside Rising ChannelFOREXCOM:XAUUSD PEPPERSTONE:XAUUSD
After the aggressive sell-side sweep, buyers regained control and pushed price back into a structured bullish channel. The current strong consolidation under 5,100 suggests accumulation before a potential expansion move. As long as price holds above the internal demand at 4,960–4,980, upside liquidity remains the primary objective.
Key Scenarios
✅ Bullish Case 🚀
• Hold above 5060
• 🎯 Target 1: 5,120
• 🎯 Target 2: 5,180
• 🎯 Target 3: 5,240+
❌ Bearish Case 📉
• Breakdown below 4,960
Current Levels to Watch
Resistance 🔴: 5,100–5,120
Support 🟢: 4,960–4,980
⚠️ Disclaimer: This analysis is for educational purposes only. Not financial advice.

GoldXAUUSD
- Ascending Triangle as an corrective pattern in Long Time Frame
- Fibonacci Level - 50.00%
- Completed " 12345 " Impulsive Waves and " ABC " Corrective Waves
- Double Top in Short Time Frame
- Sell Side Liquidity

A-Book vs B-Book: What Every Retail Trader Needs to KnowMost retail CFD traders have never even heard the terms “A-Book” and “B-Book,” yet almost all of them are directly affected by how these models work. Your broker’s choice between the two can change the prices you see, how your orders are filled, and even whether your stop loss gets hit. Let’s break it down so you know exactly what’s going on behind the scenes.
█ What is A-Book?
An A-Book broker routes your orders straight to external liquidity providers, such as banks, market makers, or directly to an exchange in the case of futures or spot markets. Your broker is essentially the middleman, passing your trade along and matching it with a real counterparty.
⚪ How they make money:
Spreads (the difference between the bid and ask prices).
Commissions on each trade.
Occasionally a small markup on the feed.
Because they don’t profit when you lose, an A-Book broker’s ideal client is a trader who trades frequently and consistently, your activity is their revenue stream.
█ What is B-Book?
A B-Book broker keeps your trades “in-house,” meaning they take the other side of your position. If you buy, they sell; if you sell, they buy, but all within their own system. Your trades don’t reach the real market at all.
⚪ How they make money:
Your losses are their profits.
They may still earn on spreads and commissions, but the main income is the net loss of their client base.

XAU/USD Price Outlook – Trade Setup📊 Technical Structure
Gold sharply rejected from the upper channel resistance near the $5,060 area and briefly broke below the ascending channel structure, triggering a fast selloff toward the $4,900 demand zone.
Price has now reacted strongly from the $4,936–$4,913 support zone, reclaiming short-term structure and attempting a recovery back toward the broken resistance area.
The current structure suggests a pullback-then-continuation scenario:
Short term: corrective rebound
Intraday bias: mildly bullish while above $4,913
Major resistance remains near $5,043–$5,066
As long as price holds above $4,913, buyers retain recovery control.
🎯 Trade Setup (Bullish Recovery Bias)
Entry Zone: $4,936 – $4,913
Stop Loss: $4,901
Take Profit 1: $4,980
Take Profit 2: $5,043
Extended Target: $5,066
Risk–Reward Ratio: Approx. 1:3.72
📌 Invalidation:
A sustained break below $4,900 would invalidate the recovery structure and expose $4,880 → $4,840 support region.
🌐 Macro Background
Gold rebounded after falling to a weekly low near $4,878 as traders position ahead of the US CPI report.
Strong NFP reduced expectations of a March Fed rate cut (USD supportive)
However, weak Jobless Claims signaled labor market softening (gold supportive)
Markets still expect at least two Fed cuts in 2026
Risk sentiment remains fragile, supporting safe-haven demand
Therefore, CPI will likely determine whether gold breaks $5,060 or returns below $4,900.
🔑 Key Technical Levels
Resistance Zone: $5,043 – $5,066
Intermediate Resistance: $4,980
Support Zone: $4,936 – $4,913
Breakdown Level: Below $4,900
Upside Structure Trigger: Above $5,043
📌 Trade Summary
Gold is attempting a rebound after a liquidity sweep below channel support.
Preferred strategy: Buy dips above $4,900 targeting a retest of $5,043–$5,066 resistance, while remaining cautious ahead of US CPI volatility.
⚠️ Disclaimer
This analysis is for reference only and does not constitute trading advice. Financial markets involve significant risk; proper risk and position management are essential.

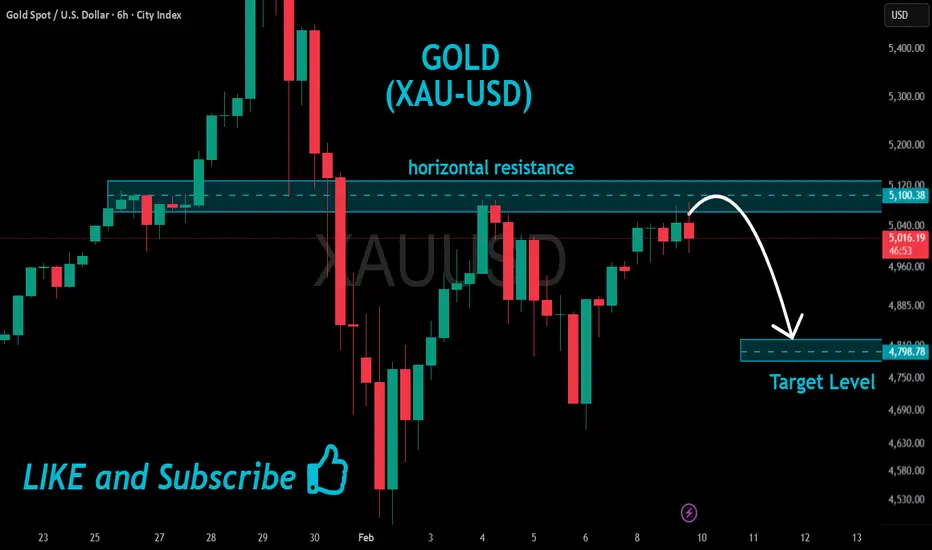
GOLD Short From Resistance!
HI,Traders !
#GOLD is once again
About to retest a horizontal
Resistance level of 5100.38
Which is a strong supply
Area from where a local
Bearish pullback is to
Be expected ! xauusd
Comment and subscribe to help us grow !
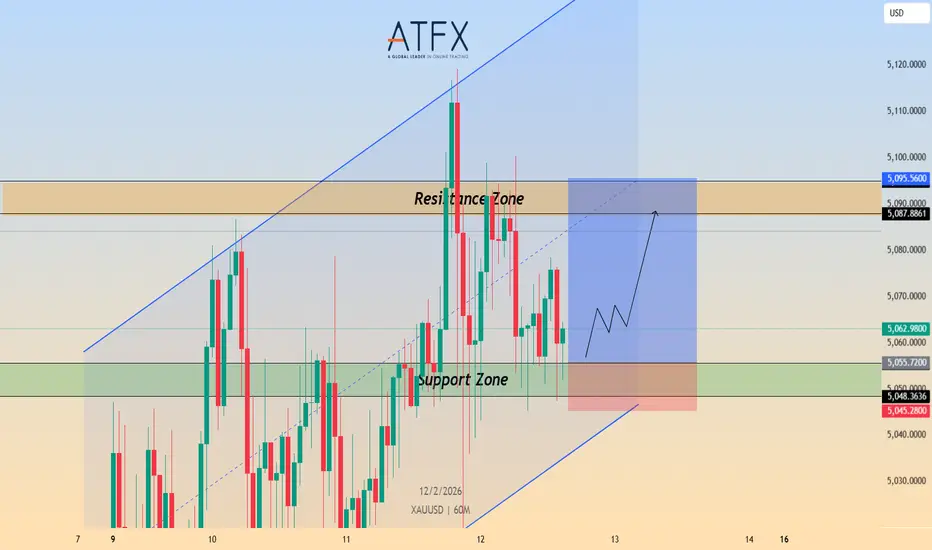
Gold Price Outlook – Trade Setup (XAU/USD)📊 Technical Structure
OANDA:XAUUSD Gold remains within a short-term ascending channel structure despite intraday weakness following strong US NFP data.
Price is currently holding above the key support zone (5,048–5,055) after a pullback from the resistance band near 5,087–5,095.
As long as the support zone remains intact, the broader short-term bias stays cautiously bullish, with scope for another attempt toward the upper resistance region.
However, failure to hold above 5,045 would expose the lower channel boundary.
🎯 Trade Setup (Bullish Bias)
Entry Zone: 5,048 – 5,055
Stop Loss: 5,045
Take Profit 1: 5,087
Take Profit 2: 5,095
Risk–Reward Ratio: Approx. 1:3.82
📌 Invalidation:
A sustained break below 5,045 would shift momentum bearish and invalidate the long setup.
🌐 Macro Background
Gold faces pressure after a stronger-than-expected US Nonfarm Payrolls report reduced expectations for a March Fed rate cut. Markets now price nearly a 95% probability of no change in March.
Despite this, the Federal Reserve is still expected to deliver two rate cuts later in 2026, limiting USD upside momentum.
Additionally, renewed concerns over Fed independence continue to cap aggressive USD strength.
Traders now await US CPI data and Weekly Jobless Claims for the next directional catalyst.
🔑 Key Technical Levels
Resistance Zone: 5,087 – 5,095
Support Zone: 5,048 – 5,055
Bearish Breakdown Level: Below 5,045
Upside Extension Target: 5,120
📌 Trade Summary
Gold remains structurally supported above 5,048 despite post-NFP volatility.
Preferred strategy: Buy dips above support, targeting a move back toward the resistance band, while staying cautious ahead of US inflation data.
⚠️ Disclaimer
This analysis is for reference only and does not constitute trading advice. Financial markets involve significant risk; proper risk and position management are essential.
GoldXAUUSD
- Break of Structure
- Demand Zone
- Fibonacci Level - 61.80% / 78.60%
- Bullish Channel as an corrective pattern in Short Time Frame
- Change of Characteristics

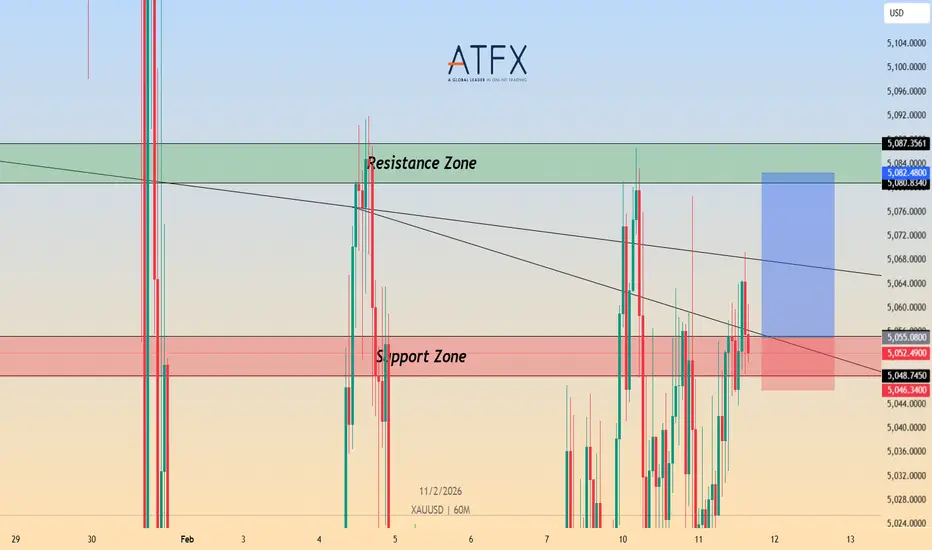
Gold Price Outlook – Trade Setup (XAU/USD)📊 Technical Structure
OANDA:XAUUSD Gold remains in a short-term bullish recovery structure on the 1-hour timeframe, holding above the key support zone around 5,048–5,055. Recent price action shows higher lows forming after a pullback, indicating buyers are still defending dips. As long as price stays above this support zone, the technical bias favors a push toward the upper resistance band near 5,080–5,090.
🎯 Trade Setup (Bullish Bias)
Entry Zone: 5,048 – 5,055
Stop Loss: 5,046
Take Profit 1: 5,080
Take Profit 2: 5,087
Risk–Reward Ratio: Approx. 1 : 3.14
📌 Invalidation:
A sustained break and hourly close below 5,046 would invalidate the bullish setup.
🌐 Macro Background
Gold is supported by ongoing US Dollar weakness, driven by expectations of further Federal Reserve rate cuts and renewed concerns over the Fed’s independence. Softer US retail sales data and lingering labor market uncertainty continue to weigh on the USD. While some Fed officials struck a cautious tone, markets remain focused on the upcoming US Nonfarm Payrolls (NFP) report, keeping gold bids intact but limiting aggressive upside positioning ahead of the data.
🔑 Key Technical Levels
Resistance Zone: 5,080 – 5,090
Support Zone: 5,048 – 5,055
Bullish Invalidation: Below 5,046
📌 Trade Summary
Gold maintains a bullish bias above the 5,050 region. As long as price holds above support, the preferred strategy remains buying pullbacks, targeting a move back toward the upper resistance zone ahead of key US data.
⚠️ Disclaimer
This analysis is for reference only and does not constitute trading advice. Financial markets involve significant risk; proper risk and position management are essential.
Selena | XAUUSD – 30M | Intraday Recovery From DemandFOREXCOM:XAUUSD PEPPERSTONE:XAUUSD
After a strong bearish impulse, XAUUSD reached a major intraday demand zone and printed a sharp rejection. Price is now attempting a corrective recovery, but upside remains capped by a descending trendline and supply zone around 4,900–4,930. The move currently looks like a pullback within a broader corrective phase.
Key Scenarios
✅ Bullish Case 🚀 (Intraday)
Holding above 4,760–4,780 support
🎯 Target 1: 4,900
🎯 Target 2: 4,930–4,960 (trendline + supply zone)
❌ Bearish Case 📉 (Failure Scenario)
Breakdown below 4,760
🎯 Downside target: 4,640–4,600 demand zone retest
Current Levels to Watch
Resistance 🔴: 4,900 – 4,960
Support 🟢: 4,760 → 4,640
⚠️ Disclaimer: This analysis is for educational purposes only. It is not financial advice.

GOLD(XAUUSD): Price is in AB=CD Pattern! What's next?Dear Traders,
Following a price rally to $5600, a clearer indication of future price movement emerged. However, the price corrected itself after dropping to the unexpected $4400 level. Since then, it’s resumed natural price movement and currently forms an AB pattern. This pattern is on the verge of developing into a CD pattern, potentially lifting the price from $4967 to $5400 in the next move.
Consider entering when the price experiences a smaller correction. Given the current market’s significant volatility, strict risk management is recommended. If you enjoy our work, please like and comment for more insights.
Team SetupsFX_

gold on buy unless h4 fails closing above 5078#XAUUSD price still bullish unless next H4 fails closing above the rectangle then another fall will occur.
Buy below 5038 2 times breakout, target 5078, 5194 long, SL 5016.
If prices fails to close above 5078,86 on next H4 then price will drop once more. H1 breakout below 5021 will reach 5000, 4980 again.

GoldXAUUSD
- Completed " 12345 " Impulsive Waves and " A " Corrective Wave
- Change of Characteristics
- Fair Value Gap
- Bullish Channel as an corrective pattern in Short Time Frame
- RSI - Divergence

Selena | XAUUSD · 30M – Market Structure Shift & Intraday ExpanPEPPERSTONE:XAUUSD FOREXCOM:XAUUSD
Market Overview
After a strong impulsive drop, XAUUSD rebounded sharply from demand and reclaimed multiple intraday highs, indicating short-term bullish intent. The market is now consolidating just below resistance, suggesting either a breakout continuation toward HTF supply or a pullback for re-accumulation.
Key Scenarios
✅ Bullish Case 🚀 →
• Acceptance above the mitigation zone opens upside expansion
• 🎯 Target 1: 5,040
• 🎯 Target 2: 5,240
• 🎯 Target 3: 5,360
❌ Bearish Case 📉 →
• Rejection from resistance may trigger a corrective pullback
• 🎯 Downside Target 1: 4,880
• 🎯 Downside Target 2: 4,760
Current Levels to Watch
Resistance 🔴: 5,040 – 5,240
Support 🟢: 4,880 – 4,760
⚠️ Disclaimer: This analysis is for educational purposes only. It is not financial advice.

GoldXAUUSD
- Completed " 12345 " Impulsive Waves and " ABC " Corrective Waves
- Break of Structure
- Fibonacci Level - 78.60%
- Fair Value Gap
- Sell Side Liquidity

Gold 4H🧠 Market Structure
Price is currently moving in a sideways consolidation after a strong bearish move followed by a recovery.
EMA 9 & EMA 15 are flat and tight → indicating low momentum & upcoming volatility expansion.
Market is trading inside a mid-range zone, not at premium or discount extremes.
🔴 Supply / FVG Zone
5239 – 5400
Major imbalance area
Previous aggressive selling pressure
High probability liquidity reaction zone
📌 Expect:
Liquidity grab
Fake breakout possibility
Strong volatility if tapped
🟢 Resistance
5000 Psychological Level
EMA cluster acting as dynamic resistance
Break & hold above required for bullish continuation
⚪ Demand Zone
4650 – 4700
Institutional reaction zone
Potential bullish mitigation area
Liquidity resting below
🟥 Major Support
4400
Structure invalidation level
Break = bearish continuation scenario
📈 Bullish Scenario
If price:
Closes strongly above 5000
Holds above EMA cluster
Shows increased volume
Targets:
5239 FVG
Possible continuation toward 5500 – 5590 liquidity zone
📉 Bearish Scenario
If price:
Rejects from 5000 resistance
Fails to hold EMA support
Breaks demand zone
Targets:
4650 liquidity sweep
Possible continuation toward 4400 support
⚠️ Market Conditions (Fundamental Drivers)
Recent gold volatility driven by:
Extreme precious-metal price swings and investor uncertainty
Analysts increasing bullish gold forecasts due to global instability
Strong central bank demand & bullish long-term projections toward $6100–$6300
High geopolitical tensions & policy uncertainty fueling safe-haven demand
🧾 Summary
Market currently in compression phase
Major move expected after breakout
Mid-range trading risky — wait for zone reactions
Bias remains macro bullish but technically neutral

Eliana | XAUUSD – 30M | Range Reaction & Conditional ReversalPEPPERSTONE:XAUUSD OANDA:XAUUSD
After a sharp sell-off, XAUUSD found demand and bounced, indicating short-term buyer interest. Price is currently consolidating below trendline resistance and within a defined range. This creates a decision zone: either a bullish breakout above trendline resistance or a rejection leading to another sell-off toward lower liquidity.
Key Scenarios
✅ Bullish Case 🚀
Hold above 4,650–4,680 demand
Break & close above descending trendline
🎯 Target 1: 4,950
🎯 Target 2: 5,050–5,100 (range high / supply)
❌ Bearish Case 📉
Rejection from trendline resistance
Loss of 4,650 support
🎯 Target 1: 4,500
🎯 Target 2: 4,400 (liquidity sweep zone)
Current Levels to Watch
Resistance 🔴: 4,950 – 5,100
Support 🟢: 4,650 – 4,680
⚠️ Disclaimer: This analysis is for educational purposes only. It is not financial advice.

Eliana | XAUUSD – 15M – Intraday Market StructureOANDA:XAUUSD PEPPERSTONE:XAUUSD
After the sharp sell-off, XAUUSD formed a solid base near the 4600 liquidity zone, followed by a structured recovery. Price pushed into supply and got rejected, pulling back toward demand while still holding higher lows. As long as the demand zone holds, upside continuation toward higher resistance remains valid. A breakdown below demand would expose deeper liquidity before any continuation.
Key Scenarios
✅ Bullish Case 🚀 →
Holding above 4800–4850 keeps buyers in control.
🎯 Target 1: 5050
🎯 Target 2: 5140
🎯 Target 3: 5200+
❌ Bearish Case 📉 →
Failure to hold 4800 opens sell-side liquidity.
🎯 Downside Target 1: 4600
🎯 Downside Target 2: 4400
Current Levels to Watch
Resistance 🔴: 5050 – 5140
Support 🟢: 4850 – 4800 / 4600
⚠️ Disclaimer: This analysis is for educational purposes only. Not financial advice.

Dense data. Focus on the fluctuation range.On Friday, gold staged a V-shaped reversal, strengthening due to bargain buying and a weaker dollar, ultimately closing up 4%. Next week will be a crucial week this month, with a flurry of data releases and speeches from Federal Reserve officials.
After the market experienced a sharp decline, it entered a period of wide-ranging fluctuations this week, and this volatile trend is expected to continue for some time. However, it's important to note that the short-term high of 5600 and low of 4400 are unlikely to be breached; the market will likely fluctuate between the secondary high and low points. However, there will be a lot of data next week, which will likely intensify the market correction.
From the 4-hour chart, gold is currently facing short-term resistance around 5020-5030, while the key support level is around 4800. Gold is likely to continue fluctuating within this range next week until a new driving event or data event breaks this equilibrium and establishes a new trend.
However, regardless of whether a new market trend begins, the overall bullish pattern for gold remains unchanged. Looking at the daily chart, gold's lows are rising, ultimately forming a converging pattern upwards.
In terms of trading strategy, continue to focus on the overall range, prioritizing conservative trading with strict stop-loss orders to prevent sudden market changes from causing account losses.

XAUUSD 4H — Smart Money Breakout, Imbalance & Liquidity RoadmapThis XAUUSD analysis is built on structure, liquidity and smart money logic, not on guesswork.
After a long phase of accumulation, Gold printed a valid breakout and confirmed BOS, shifting the overall market narrative to the bullish side.
Price then created a higher high (HH) and respected previous structure, showing that institutions are in control of the flow.
During this move, the market left behind clear imbalances (FVGs) and order blocks (OB) — these are not random zones, they are areas where large orders were executed and price moved aggressively.
Markets rarely leave these inefficiencies unfilled, which is why they act as magnets for future price delivery.
The lower structure also shows a strong higher low (HL) with sell-side liquidity (SSS) already taken, confirming that weak sellers have been removed from the market.
This gives strength to the bullish continuation narrative.
The roadmap drawn on the chart highlights how price may react: • Price may revisit the imbalance + OB for mitigation
• After rebalancing inefficiency, continuation toward ATH and higher liquidity becomes possible
• Each pullback is not weakness — it is fuel for the next expansion
This is how smart money trades: They create breakouts, leave inefficiencies, return to them for rebalancing, and then continue in the true direction.
This analysis is not a signal — it is a story of how price is being engineered.
🧠 Final Thought
If you understand liquidity, imbalance and structure, you stop chasing price —
you start letting price come to you.
👉 Do you agree with this bullish roadmap, or do you see a different liquidity draw?
Comment your view below — let’s read the market together.

XAUUSD — Smart Money Reload Before Continuation📊 Gold Bullish Continuation | Liquidity, Imbalance & Order Flow in Play
Gold has already shown its hand.
After a strong bullish expansion, price delivered a deep corrective move into higher-timeframe value, clearing internal liquidity and mitigating smart money orders. This drop was not random — it was engineered to rebalance order flow before continuation.
🔹 Multiple BOS confirmations on the left confirm a healthy bullish structure.
🔹 The impulsive sell-off acted as liquidity sweep + discount delivery, tapping into a higher-timeframe Order Block.
🔹 From that OB, price reacted aggressively, showing strong bullish intent and displacement.
🔹 Currently, price is trading inside a balanced range (BISI ↔ SIBI) — a classic reload zone for smart money.
This zone represents fair value, where institutions often accumulate positions before targeting external liquidity.
As long as price holds above the BISI demand, the expectation remains: ➡️ Continuation toward previous highs (CRT High)
➡️ Expansion into premium liquidity
➡️ Potential for new highs once imbalance is fully resolved
⚠️ Any short-term pullbacks into this zone should be viewed as opportunities, not weakness — unless structure is violated.
📌 Smart money doesn’t chase price.
They wait for balance — then expand.
💬 Let’s Discuss
Do you see a deeper mitigation first, or direct continuation from here?
👇 Drop your bias in the comments
🔁 Share if this aligns with your Gold outlook
✍️ — Jayartolentiono90
Smart Money | Liquidity | Order Flow
Gold-focused analysis
🚫 No signals — only structure & logic
⭐ Follow for consistent SMC insights

GOLD(XAUUSD): New Potential Zone For Swing And Intraday Buyers! Gold fell below our previous analysis’s expectations rendering it invalid. Consequently, we’ve identified two potential zones for buyers. One is safer while the other is riskier. You can choose either or both depending on your trading strategy.
Like and comment for more! We appreciate your support and hope it continues.
Team Setupsfx_

GoldXAUUSD
- Completed " 12345 " Impulsive Waves and " AB " Corrective Waves
- Break of Structure
- RSI - Divergence
- Fibonacci Level - 61.80%
- Bearish Channel as an corrective pattern in Short Time Frame
