#XAUUSD(GOLD): +1200 Pips Selling Opportunity! Dear Traders,
Gold has repeatedly retested the 5101 region but has been rejected. We believe the price has exhausted and bearish volume has increased in the market. To enter, we need a clear reversal signal and a retest of a key support level.
Currently, our only target is a swing trade. This analysis can also be used for intraday trading. Your stop loss will depend on your risk management.
Good luck and feel free to like and comment for more.
Team Setupsfx_
Xauusdanalysis

Gold — Gap Up, New ATH at 5107… Then Reality Kicks InYesterday, once again, Gold opened the week with an upside gap and during the Asian session printed a new all-time high at 5107.
What followed was telling.
For almost 12 hours, price went nowhere, trapped in a tight range between 5050 and 5100 — classic behavior of a market absorbing orders after an extended move.
🔎 What Changed Near the U.S. Close
Toward the New York close, price finally broke the range to the downside.
- support gave way
- selling accelerated
- the opening gap below 5000 was filled
This wasn’t panic selling — it was clean, technical liquidation.
As expected, short-term traders stepped in quickly after the gap was closed, and at the time of writing, Gold is rebounding and trading around 5070.
❓ The Big Question: Was That the Correction?
In my Sunday analysis, I mentioned that a strong correction would eventually come.
So the natural question now is:
👉 Was this the correction… or just the beginning?
My answer: this was not the correction.
What we saw looks more like:
➡️ the first clear sign of profit-taking, not a full reset of positioning.
🔎 Going Forward: How I See It
Structurally, Gold is still bullish — and a new ATH is not out of the question.
However, the behavior is changing:
- upside start showing cracks
- ranges are forming near highs
- breaks down are followed by acceleration
That’s how tops begin to form, not how trends usually continue smoothly.
📌 Trading Stance
Personally, I will treat this rebound not as a buy, but as a potential selling opportunity, if price shows renewed weakness again.
✅ Conclusion
Structure: still bullish
Momentum: losing efficiency
Behavior: early signs of reversal starting to appear

Gold Roadmap | Short-termAs Gold( OANDA:XAUUSD ) blasts through the $5,100 barrier on January 26, 2026, captivating investors worldwide, the surge reflects a perfect storm of global uncertainties and economic shifts.
Key Fundamental Reasons:
Geopolitical Tensions: Rising tensions in the Middle East due to US actions over the past few days, as well as President Trump's threat to impose 100% tariffs on Canada
Central Bank Buying: Continued accumulation by central banks, including China's $4B acquisition of a miner, to diversify reserves amid economic risks.
Weakening US Dollar( TVC:DXY ): Dollar's decline against currencies like the yen, fueled by intervention risks, making gold more attractive.
Interest Rate Expectations: Anticipated Fed rate cuts (at least two quarter-point reductions) reduce the opportunity cost of holding non-yielding gold.
Economic Uncertainty: Fears of slowdowns, inflation persistence, and potential U.S. government shutdowns drive investors to gold as a store of value.
Let’s take a look at the technical setup for gold on the 1-hour timeframe. Stay with me!
To start, as I’ve mentioned in previous ideas, assets hitting all-time highs make technical analysis challenging due to the lack of historical data. Therefore, my goal is to identify key zones that can assist in trading gold. Recently, gold has risen significantly due to fundamental factors and policymakers’ statements.
Gold has created a new gap($5,003.70-$4,987.54) at the start of this week, indicating what might be considered a gap party (a playful note) due to multiple price jumps.
In the past nine days, Gold appears to have formed an ascending Channel, and within that channel, there is a smaller ascending Channel that can serve as support and resistance levels.
From an Elliott Wave perspective, it seems that gold is currently completing the microwave 4 of the main wave 5, and this main wave 5 appears to be extended.
I expect that gold will start to rise again from the lower line of the small ascending Channel and move toward the Potential Reversal Zone(PRZ) . After reaching that zone, we might see a pullback, depending on news and geopolitical developments.
What do you think about gold’s bullish trend? How far can it go before a correction begins?
I’d love to hear your thoughts on gold. How long do you think it can maintain this bullish trend?
💡 Please respect each other's opinions and express agreement or disagreement politely.
📌 Gold Analyze (XAUUSD), 1-hour time frame.
🛑 Always set a Stop Loss(SL) for every position you open.
✅ This is just my idea; I’d love to see your thoughts too!
🔥 If you find it helpful, please BOOST this post and share it with your friends.

XAUUSD – ATH Extension Confirmed, Buy Pullbacks Into 5,100+Gold continues to trade in a strong ATH expansion phase, not a blow-off move. The latest impulsive rally confirms that buyers remain in control, while pullbacks are being absorbed quickly and efficiently.
On the macro side, USD weakness persists, safe-haven flows remain active, and the market still prices only modest Fed easing — a combination that continues to support gold at elevated levels.
At this stage, ATHs are no longer resistance — they are areas of acceptance.
Structure & Price Action
Bullish structure remains intact with clear Higher Highs – Higher Lows.
No bearish CHoCH has formed despite the sharp upside extension.
Current consolidation near the highs suggests continuation, not exhaustion.
Pullbacks are corrective and aligned with the ascending trendline and demand zones.
Key insight:
ATH is being defended by structure → trend continuation remains the primary bias.
Trading Plan – MMF Style
Primary Scenario – Buy the Pullback
Focus on patience, not chasing price.
BUY Zone 1: 4,984 – 4,970
(Former resistance turned demand + short-term rebalancing)
BUY Zone 2: 4,928 – 4,910
(Trendline confluence + deeper liquidity absorption)
➡️ Only execute BUYs after clear bullish reaction and structure confirmation.
➡️ Avoid FOMO at the highs.
Upside Targets (ATH Extension):
TP1: 5,085
TP2: 5,120+ (extension if momentum sustains)
Alternative Scenario
If price holds above 5,085 without a meaningful pullback, wait for a break & retest before looking for continuation BUYs.
Invalidation
A confirmed H1 close below 4,910 would weaken the current bullish structure and require reassessment.
Summary
Gold remains in a controlled ATH expansion, supported by both structure and macro flow. The edge is not predicting the top, but buying pullbacks into demand while the trend is intact.
As long as structure holds, higher prices remain the path of least resistance.

Selena | XAUUSD | 1H – Bullish Market Structure With Channel FOREXCOM:XAUUSD PEPPERSTONE:XAUUSD
After consolidating at lower levels, Gold broke structure and entered a sustained bullish phase. Each pullback has been corrective and followed by renewed buying pressure, confirming trend strength. Current price is holding above internal support zones, indicating continuation potential toward higher liquidity.
Key Scenarios
✅ Bullish Case 🚀 → As long as price holds above internal demand and channel support, continuation toward external highs remains valid.
🎯 Target 1: 5050 – 5080
🎯 Target 2: 5120 – 5200
❌ Bearish Case 📉 → A decisive break and close below channel support would invalidate the bullish structure and open a deeper corrective phase.
Current Levels to Watch
Resistance 🔴: 5050 – 5200
Support 🟢: 4920 – 4850
⚠️ Disclaimer: This analysis is for educational purposes only. It is not financial advice. Please do your own research before trading.

XAUUSD – Brian | H3 Technical Analysis
Gold has officially broken above the 5,000 level for the first time, confirming a major structural shift on higher timeframes. The breakout reinforces the broader bullish narrative, with price now trading firmly in expansion mode rather than consolidation.
The move above 5,000 reflects sustained safe-haven demand amid elevated global uncertainty. While short-term volatility remains possible, the broader environment continues to favour gold as a defensive asset, supporting upside continuation scenarios.
Market Structure & Trend Context (H3)
On the H3 timeframe, XAUUSD remains well-contained within a rising price channel, with structure defined by higher highs and higher lows. The recent impulsive leg confirms continuation within the dominant trend rather than a terminal move.
Key structural observations from the chart:
Price is holding above the ascending trendline, which has acted as dynamic support throughout the advance.
A clean impulsive push above 5,000 followed by shallow pullbacks suggests strong buyer acceptance at higher prices.
The broader Elliott structure remains constructive, with price progressing through higher-wave extensions rather than showing signs of distribution.
Key Technical Zones to Monitor
Several important technical areas stand out:
5,000 – trendline retest zone: A potential area for price to stabilise if a technical pullback develops.
Strong liquidity zone around 4,787: A deeper support area where buy-side liquidity is concentrated, aligned with prior structure.
FVG zone below current price: Represents unfinished business in case volatility increases.
Upper resistance / extension zone near 5,315 (Fibonacci 1.618): A key upside reaction area where price may pause or consolidate before further expansion.
As long as price remains above the trendline and key liquidity supports, the bullish structure remains intact.
Liquidity & Forward Outlook
The breakout above 5,000 opens a new liquidity regime. With limited historical resistance overhead, price is now driven more by liquidity expansion and momentum than by traditional supply zones.
Short-term pullbacks should be viewed in the context of trend continuation rather than reversal, unless there is a clear breakdown in structure. Acceptance above 5,000 would further strengthen the case for continued upside toward higher Fibonacci extensions.
Trading Bias
Primary bias: Bullish continuation while structure holds
Key areas of interest:
Trendline / 5,000 retest zone
4,787 liquidity support
5,315 extension resistance
Preferred timeframe for confirmation: H1–H4
Strong trends rarely move in a straight line. Patience and alignment with structure remain critical in this phase of the market.
Refer to the accompanying chart for a detailed view of trend structure, liquidity zones, and Fibonacci extensions.
Follow the TradingView channel to get early access to structural updates and join the discussion.

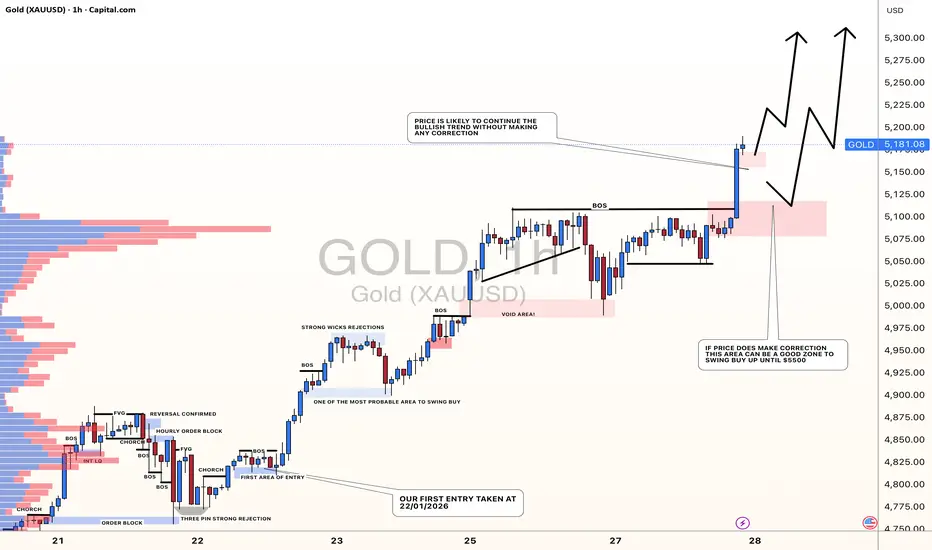
GOLD: Detailed View, Is Price Heading Towards $5500?Gold overview!
After the price built up, we're seeing a strong bullish move. Our earlier analysis today didn't quite work out, but this one points to two key areas where the price might turn around. The first zone is probably the better entry, since the market will open with a gap up and fill it before moving on. A profit target of $5500 looks pretty good.
If you like what we do, please hit like and leave a comment on this idea. And follow us to get updates on new ideas like this one.
Team Setupsfx_
XAUUSD – H1 Gold remains structurally XAUUSD – H1 Gold remains structurally bullish near all-time highs| Lana ✨
Gold is extending its bullish momentum for a second consecutive session and continues to trade near all-time highs. Price action remains constructive, with the market holding above key structure while deciding between continuation or a deeper pullback into value.
📈 Market Structure & Trend Context
The short-term and medium-term structure remains bullish, with price respecting the ascending channel.
The recent push above previous highs confirms strong demand, but current price action also shows signs of consolidation near ATH.
This behavior is typical after an impulsive rally, where the market pauses to build acceptance or rebalance liquidity before the next directional move.
As long as price holds above the rising structure, the bullish thesis remains valid.
🔍 Key Technical Zones to Watch
ATH Reaction Zone: 5080 – 5110
This is a sensitive area where price may consolidate, fake out, or briefly reject before choosing direction.
Primary Pullback / Buy Zone: 5000 – 5020
A key structural level aligned with prior resistance-turned-support and the midline of the bullish channel.
Secondary Support (Deeper Pullback): 4920 – 4950
A stronger value area if volatility increases or liquidity is swept below the channel.
Upside Expansion Zone: 5180 – 5200+
If price accepts above ATH, this becomes the next upside objective within the channel.
🎯 Trading Scenarios (H1 Structure-Based)
Scenario 1 – Continuation Above ATH:
If price consolidates above 5080–5110 and shows acceptance, gold may extend toward 5180–5200. This scenario favors patience and confirmation rather than chasing immediate breakouts.
Scenario 2 – Pullback Into Structure (Preferred):
A pullback toward 5000–5020 would allow the market to rebalance liquidity and offer a higher-quality continuation setup. Holding this zone keeps the bullish structure intact.
Scenario 3 – Deeper Correction:
If price loses the primary support, the 4920–4950 zone becomes the next key area to watch for buyer response and trend defense.
🌍 Macro Context (Brief)
Gold continues to benefit from heightened geopolitical risks and ongoing trade uncertainty, reinforcing its role as a safe-haven asset.
At the same time, market attention is shifting toward the outcome of the two-day FOMC policy meeting on Wednesday, which may introduce volatility and short-term repricing.
This backdrop supports gold structurally, while also increasing the likelihood of sharp intraday swings around key levels.
🧠 Lana’s View
Gold remains bullish, but near ATH levels, discipline matters more than conviction.
Lana prefers buying pullbacks into structure, letting price confirm, and avoiding emotional trades during headline-driven volatility.
✨ Respect the structure, stay patient near the highs, and let the market come to your levels.

Gold — New ATH Above 5200. Momentum Strong, Risk Even StrongerYesterday, once again, Gold printed a new all-time high. Fortunately, despite being short earlier in the session — and having the trade running at one point with ~400 pips profit — I chose to close it at break-even after the reversal from just below 5050.
That decision was inspired...
After the sharp bounce from that local low, Gold started to consolidate below the 5100 ATH and, in its now familiar “very nice” fashion, it broke higher overnight — while I was sleeping.
That breakout triggered another acceleration leg, and at the time of writing, price is trading above 5220, marking yet another ATH.
🔎 Technical Context
From a technical perspective, yesterday was important:
Price broke above the resistance of the channel that had defined the range since mid-August and now, Gold is trading near the upper boundary / resistance of the rising channel that started in mid-January
At this moment, 5250 is the level acting as immediate resistance, and that’s where I’ll be watching closely for:
👉 price reaction
👉 loss of momentum
👉 signs of reversal or rejection
⚠️ Why I’m Not Buying Here
Missing the buy on the 5100 breakout changes everything.
From my point of view, there is no buy opportunity now, and the reason is simple and practical:
If we look at the last 10 days, there were two separate occasions where Gold dropped more than 1,000 pips in a very short time.
And since I’m speculating, not investing, I cannot afford — nor am I willing — to sit through that kind of drawdown.
✅ Conclusion
Trend: hugely bullish
Momentum: extreme
Risk: very high both on short and long trades
At these levels, chasing longs offers poor risk control, short is grossly against the trend.
I’ll wait for price behavior near 5250, and until the market gives a structured opportunity, staying flat is my approach.

Riding the XAUUSD Gold MONSTER Trade | What’s Next?In this video, we continue managing our XAUUSD Gold MONSTER trade 🥇💪. We’ve been seeing consistent success with every position we’ve opened recently 📈, and we break down our potential next move. Price is printing clear higher highs and higher lows on the 30-minute chart ⏱️📊, and we’re looking to capitalize on the next swing high and retracement.

XAUUSD (H1) – Liam Plan (Jan 27) Trend XAUUSD (H1) – Liam Plan (Jan 27)
Trend-following environment | Liquidity first, patience pays
Quick summary
Gold is still trending higher inside a clean rising channel, but price is now approaching a weak high / liquidity pocket where stop-runs are likely.
Macro backdrop adds fuel for volatility: reports suggest the US is pressuring Ukraine toward territorial concessions as part of peace talks — this kind of uncertainty often keeps safe-haven demand supported, but it can also create fast spikes + fake breaks.
➡️ Today’s rule: follow the uptrend, but only buy at liquidity test points. No chasing highs.
1) Macro context (why spikes are likely)
If markets start pricing a forced compromise in the Ukraine conflict:
risk sentiment can swing quickly,
headlines can trigger instant pumps, then sharp retraces.
✅ Safe approach: let price hit your zones first, then trade the reaction — not the headline.
2) Technical view (H1 – based on your chart)
Price is respecting an ascending channel and building liquidity around key levels.
Key levels (from the chart):
✅ Support / buy liquidity zone: 4,995 – 5,000
✅ Flip / reaction zone: 5,047
✅ Upper resistance / supply: 5,142
✅ Weak High / liquidity target: 5,192.6
✅ Extension target (1.618): 5,240.8
Bias stays bullish while inside the channel, but near 5,192–5,240 we should expect liquidity sweep → pullback behavior.
3) Trading scenarios (Liam style: trade the level)
A) BUY scenarios (priority – trend continuation)
A1. BUY the pullback into the flip zone (cleanest R:R)
✅ Buy: 5,045 – 5,050 (around 5,047)
Condition: hold + bullish reaction (HL / rejection / MSS on M15)
SL (guide): below 5,030 (or below the reaction low)
TP1: 5,085 – 5,100
TP2: 5,142
TP3: 5,192.6
Logic: This is the best “trend-following” entry — buy support, sell into liquidity above.
A2. BUY deep liquidity sweep (only if volatility hits)
✅ Buy: 4,995 – 5,000
Condition: sweep + strong reclaim (fast rejection / displacement up)
SL: below 4,980
TP: 5,047 → 5,142
Logic: This is the strongest liquidity test zone on your chart — ideal for a bounce if price flushes.
B) SELL scenarios (secondary – reaction scalps only)
B1. SELL the weak high sweep (tactical scalp)
✅ If price runs 5,192.6 and shows rejection:
Sell: 5,190 – 5,200
SL: above the sweep high
TP: 5,142 → 5,085
Logic: Weak highs often get swept first. Great for quick mean reversion back into the channel.
B2. SELL extension (highest-risk, but best location)
✅ Sell zone: 5,235 – 5,245 (around 5,240.8)
Only with clear weakness on M15–H1
TP: 5,192 → 5,142
Logic: 1.618 extension is a common exhaustion pocket — don’t short early, short the reaction.
4) Key notes
Don’t trade mid-range between 5,085–5,142 unless you’re scalping with tight rules.
Expect false breakouts near 5,192 and 5,240 during headlines.
Best execution today = buy support, take profits into liquidity.
Question:
Are you buying the 5,047 pullback, or waiting for the 5,192 sweep to sell the reaction?
— Liam

Gold Technical Analysis | Support Bounce & Target StrategyXAUUSD M30 Chart Analysis
1. Market Structure & Range
The market is currently in a clear range (boxed in red).
Price is moving sideways between support and resistance.
This indicates market indecision, and traders are waiting for a breakout.
2. Support Level (Key Zone)
The yellow zone is the support level.
This area has been tested multiple times, showing strong buy interest.
The chart shows repeated bounces from this support zone.
📌 Support Zone: around 5,050 – 5,070
3. Entry, Stop Loss & Target
This setup is based on range trading + support bounce strategy.
✅ Entry Point: 5,069.456
🛑 Stop Loss: 5,050.343
🎯 Target Point: 5,160.702
➡️ This gives a high reward-to-risk ratio, ideal for a swing trade.
4. Trading Strategy Used
A) Range Trading Strategy
Buy near support.
Sell near resistance.
B) Price Action Strategy
Support is validated by multiple wicks and rebounds.
Strong bullish reaction at the support zone.
C) Trend Reversal / Bounce Strategy
Price has tested support and is expected to bounce upward.
The drawn curve indicates the expected bounce and rise.
D) Risk Management
Tight stop loss below support.
Clear target at previous high/resistance.
🔥 Summary
The chart shows a strong support level inside a range.
The best setup is to buy at support with a tight stop loss and target the upper resistance.
📈 Trade Idea:
Buy at 5,069 → Stop 5,050 → Target 5,160

XAUUSD: Bullish Push to 5200?As the previous analysis worked exactly as predicted, FX:XAUUSD is eyeing a bullish breakout on the 1-hour chart , with price forming higher highs and higher lows within an upward channel after rebounding from support, converging with a potential entry zone that could ignite upside momentum if buyers defend against short-term pullbacks. This setup suggests a continuation opportunity amid the ongoing uptrend, targeting higher resistance levels with more than 1:3.5 risk-reward .🔥
Entry between 4980–5000 for a long position. Target at 5200 . Set a stop loss at a 4-hour close below 4950 , yielding a risk-reward ratio of more than 1:3.5 . Monitor for confirmation via a bullish candle close above entry with rising volume, leveraging gold's momentum in the channel.🌟
Fundamentally , gold is trading around $4,983 in early January 2026, with key US Dollar events next week potentially weakening USD if data disappoints, favoring gold upside. On January 5 at 8:30 AM ET, the Employment Situation report (Non-Farm Payrolls forecast 150K, Unemployment Rate 4.4%) could pressure USD on soft hiring; January 6 features ISM Services PMI at 10:00 AM ET (forecast 52.5), where a miss signals slowdown; January 7 brings Consumer Credit (Nov) at 3:00 PM ET (forecast $15.5B), with weaker borrowing indicating economic caution. Overall, labor and service sector weakness could boost gold's safe-haven appeal. 💡
📝 Trade Setup
🎯 Entry (Long):
4980 – 5000
(Entry from current price is valid with proper risk & position sizing.)
🎯 Target:
• 5200
❌ Stop Loss:
• 4H close below 4950
⚖️ Risk-to-Reward:
• > 1:3.5
💡 Your view?
Does gold extend this trend toward 5200, or do you expect another consolidation before the next impulse higher? 👇

GOLD Bullish Continuation Intact Buy Pullbacks Within the TrendMarket Context (M30)
Gold continues to trade within a strong bullish continuation phase, holding firmly inside a well-defined ascending channel. Recent pullbacks are technical retracements for liquidity rebalancing, not signs of distribution or trend exhaustion.
On the macro side, persistent USD weakness, sustained safe-haven demand, and only modest Fed easing expectations keep the broader backdrop supportive for gold. This combination allows upside momentum to remain controlled and constructive rather than emotional.
➡️ Overall bias: Bullish – prioritize BUY setups aligned with the main trend.
Structure & Price Action
M30 structure remains intact with clear Higher Highs and Higher Lows.
Price continues to respect previous demand and key levels, confirming active buyer participation.
No bearish CHoCH has been confirmed.
The current leg is expanding toward higher Fibonacci extensions, reinforcing trend continuation.
Key insight:
👉 As long as structure holds, pullbacks represent opportunity — not risk.
Trading Plan – MMF Style
Primary Scenario – Trend-Following BUY
Focus on patience and execution at discounted levels, not chasing price at extensions.
BUY Zone 1: 5,185 – 5,170
(Short-term demand + channel support)
BUY Zone 2: 5,106 – 5,085
(Key level confluence + trendline support)
➡️ Execute BUYs only after clear bullish reaction and structure confirmation.
➡️ Avoid FOMO at extended highs.
Upside Targets:
TP1: 5,250
TP2: 5,309 (Next ATH extension zone)
Alternative Scenario
If price holds firmly above 5,250 without a meaningful pullback, wait for a break & retest before looking for continuation BUYs.
Invalidation
A confirmed M30 close below 5,044 would weaken the current bullish structure and require reassessment.
Summary
Gold remains in a controlled bullish expansion, driven by structure and macro flow. The edge is not calling the top, but buying pullbacks within demand while the trend remains intact. As long as structure holds, higher prices remain the path of least resistance.

Gold Tests Buy-Side Liquidity — Rotation or Continuation?OANDA:XAUUSD | Daily Smart Money Plan – H1
Gold remains within a well-defined bullish structure after a strong multi-session expansion. Price is now trading deep in premium, hovering just below the recent highs around 5,110–5,116, where external buy-side liquidity has already been engineered and partially tapped.
Today’s price action is unfolding against a hot macro backdrop:
Markets are reacting to renewed Fed rate-path uncertainty, unstable U.S. yields, and ongoing geopolitical risk, all of which continue to fuel safe-haven interest in gold. While headlines can amplify volatility, Smart Money execution on H1 suggests distribution and rebalancing, not aggressive continuation.
Rather than accelerating higher, price is compressing near highs — a classic signal that institutions may be selling strength before guiding price back into value.
Market Structure & Liquidity Context
Higher-timeframe bias remains bullish
Prior BOS confirms trend strength
Recent CHoCH signals transition from impulse → rotation
External buy-side liquidity has been tested above 5,100
Clear discount draw rests below at H1 demand + imbalance
Market logic favors premium delivery → discount mitigation
➡️ News creates volatility, but liquidity defines direction
Key Trading Scenarios
🔴 Sell Reaction at Premium (Primary Scenario)
5,108 – 5,116
SL: 5,125
Confluence:
External liquidity near recent highs
Premium pricing in mature bullish leg
Weak follow-through after liquidity grab
Rejection or lack of acceptance here favors a corrective rotation.
🟢 Buy Reaction at Discount (Scenario A)
4,995 – 4,980
SL: 4,970
Prior H1 support + order block
Liquidity buy zone shown on chart
Ideal area for bullish continuation after confirmation
🟢 Buy Reaction at Deeper Discount (Scenario B)
4,950 – 4,948 (FVG)
SL: 4,940
Unmitigated imbalance
Deeper liquidity sweep if premium fully unwinds
High-probability Smart Money reload zone
Invalidation
Sustained H1 acceptance above 5,125 invalidates the corrective thesis and opens continuation toward higher expansion targets.
Expectation & Bias
This is not a breakout-chasing environment
Liquidity comes before direction
Acceptance = continuation
Rejection = rotation
Execution > Prediction
💬 Will Gold accept value above 5,110 on Fed-driven volatility — or return to discount for rebalancing first?

GOLD (XAU/USD) – FINAL GRAND CYCLE ANALYSIS🟡 GOLD (XAU/USD) – FINAL GRAND CYCLE ANALYSIS
"The Rise of Real Money in a Failing Fiat World"
Elliott Waves | Fibonacci | Smart Money | Macro Fundamentals | Market Structure
📆 Date: October 12, 2025
📈 Current Price: ~$4,017/oz
🕰️ Timeframe: 1950s – 2060+
🔍 Focus: Multi-decade forecast grounded in wave theory and fundamental macro shifts
🌐 SUPER CYCLE STRUCTURE – GOLD'S MONETARY EVOLUTION
🔵 Wave I (1971–1980): The Rebirth of Gold
Gold surged from ~$35 to ~$850 after the collapse of the Bretton Woods system.
Nixon ended USD-to-gold convertibility, exposing the world to pure fiat for the first time.
Geopolitical shocks like the OPEC oil embargo and soaring inflation shattered trust in paper money.
Gold reasserted itself as a monetary anchor , not just a commodity.
🔴 Wave II (1980–1999): The Great Rejection
A 19-year bear market saw gold bleed down to ~$250.
Volcker’s rate hikes tamed inflation; fiat regained trust temporarily.
The dollar surged, stocks soared, and central banks sold gold reserves.
This corrective wave reflected confidence in debt-based growth and fiat stability — a long, deceptive calm.
🟢 Wave III (1999–~2045?): The Real Money Renaissance
This is the main secular bull market wave , subdivided into five impulsive macro waves.
Gold is now in Wave iii of III — the most explosive, powerful phase — and will likely reprice in a way that reflects systemic risk, not just inflation.
📈 MACRO & MICRO STRUCTURE – CURRENT WAVE BREAKDOWN
🟢 Macro Wave I (1999–2011): The First Awakening
Gold rose from $250 to ~$1,920.
Triggered by the dot-com crash, 9/11, 2008 crisis, and early QE programs.
This was the smart money accumulation phase , when institutions quietly began hedging systemic risk.
🔴 Macro Wave II (2011–2015): The Disbelief Phase
Gold corrected 45% to ~$1,050.
Fed tapering, rising dollar, and low CPI caused a temporary return to confidence in fiat.
This reset investor sentiment and created institutional demand zones.
🟢 Macro Wave III (2015–~2026): The Fiat Reckoning (Now Unfolding)
Subdivided into five micro-waves:
Wave i (2015–2020): Broke out of 4-year base; fueled by Brexit, rate cuts, and China accumulation.
Wave ii (2020–2022): ABC pullback post-COVID; reloaded from key SMC demand zones.
Wave iii (2022–Now): We're here. Most vertical and extended move yet. Price currently at ~$4,000; next targets are $6,552, $22,744, and $78,940 , all aligning with Fibonacci extensions (2.618, 3.618, 4.618).
Wave iv (projected 2026–2031): Likely major correction after parabolic move.
Wave v (projected 2031–2045): Final blow-off top in Supercycle III.
🧠 FUNDAMENTAL DRIVERS – BY WAVE
🔹 Wave I Fundamentals (1999–2011):
Post-dot-com capital rotation.
9/11 and geopolitical tension.
2008 GFC and collapse of banking trust.
Introduction of QE and zero interest rates.
Gold ETFs (like GLD) launched, enabling broader exposure.
🔸 Wave II Fundamentals (2011–2015):
QE fatigue: “It didn’t cause inflation.”
USD strength.
Confidence returned to stocks.
Retail dumped gold — but central banks quietly accumulated .
🔹 Wave III Fundamentals (2015–2026):
$30+ trillion in global QE during COVID.
Global real rates deeply negative.
Energy crisis and supply chain fragility.
War-driven risk premiums (Russia-Ukraine, Middle East, China-Taiwan).
De-dollarization: BRICS accumulation, gold in cross-border settlements.
Institutional shift toward real assets as fiat credibility wanes.
🔸 Wave IV (Projected 2026–2031):
A likely correction tied to:
CBDC adoption and capital controls.
Temporary resurgence in tech or USD-based confidence.
Reforms that appear to restore fiscal sanity.
But this will be the last opportunity to enter before the endgame move.
🔹 Wave V (2031–2045+):
Fiat collapse becomes mainstream.
USD potentially dethroned.
Gold-backed CBDCs or DeFi hybrids launched.
Mass exodus from fiat into real money.
Final revaluation of gold to reflect not inflation, but lost confidence in the entire financial system.
📐 FIBONACCI EXTENSIONS – PRICE TARGETS WITH WAVE ALIGNMENT
🟢 Wave I topped at 1.618 Fib ($1,887) — aligned with 2011 ATH.
🟢 Wave III (in progress):
2.618 Fib: $6,552 (expected peak of wave iii).
3.618 Fib: $22,744 (potential macro Wave III top).
4.618 Fib: $78,940 (if confidence fully collapses).
🟢 Wave V (projected): May extend toward $100,000–$250,000+ under systemic collapse or gold-backed reset conditions.
All targets line up perfectly with logarithmic channel projections , Elliott wave extensions , and long-term order flow structure .
🧠 SMART MONEY CONCEPTS & PRICE ACTION CONFIRMATION
✅ BoS (Breaks of Structure) at each wave change validated bullish continuation (2016, 2020, 2023).
✅ Order Blocks and liquidity grabs created institutional entry zones — especially at 2018–2019 lows and 2022 dips.
✅ Demand zones respected across key Fibonacci retracements (0.382 and 0.618).
✅ Current wave iii is a textbook price discovery phase with minimal resistance.
This entire market structure is institutionally driven , not retail fueled — a true stealth bull.
📊 MARKET CYCLE PSYCHOLOGY OVERLAY
1999–2004: Disbelief – “Gold is dead.”
2005–2011: Awareness – “Gold might work.”
2011–2015: Denial – “It’s just a bubble.”
2016–2020: Hope – “Maybe gold’s not done.”
2022–2026: Euphoria – “Gold will never go down.”
2026–2033: Fear → Capitulation – Wave IV
2033–2045: Mania – “Gold to the moon!” — Wave V blow-off.
🚨 FINAL SYNTHESIS
We are witnessing the greatest revaluation of monetary value in modern history . Gold is transitioning from:
A hedge against inflation → to
A hedge against central banks → to
A hedge against the entire fiat system.
📌 Final Position Summary:
🔄 Current Location: Wave iii of III of Supercycle III
🎯 Immediate Target: $6,552 (2.618 Fib)
💡 Medium-Term: $22,744 (3.618 Fib)
🔥 Parabolic Scenario: $78,940 (4.618 Fib)
💀 Systemic Reset Target: $100,000–$250,000+
🧠 Conclusion:
This is not just a chart. This is a map of the collapse of fiat trust and the ascendance of sound money . Gold is no longer just an asset — it’s insurance on the system.
🌊 "Those who understand the waves will ride them. Those who don’t will be swallowed by the tide." - FIBCOS
📘 Disclaimer: This is a structural, educational market outlook. Not financial advice. Please do your own due diligence and risk management.
#XAUUSD #Gold #GoldAnalysis #ElliottWave #Fibonacci #SmartMoneyConcepts #PriceAction #TechnicalAnalysis #MarketStructure #Commodities #InflationHedge #MacroEconomics #CentralBanks #BRICS #MonetaryReset

GOLD (XAUUSD) – Bullish Pullback → Continuation SetupKey Zone (Important)
Demand / Buy zone: 5,080 – 5,057
Previous structure support
Channel mid-lower area
Strong reaction zone (good R:R)
🎯 Target
Upside target: 5,122 – 5,130
Channel top resistance
Logical TP for continuation
🧠 Trade Idea (Bias)
Bias: Bullish continuation
Ideal plan:
Wait for reaction / confirmation in the buy zone
Bullish candle / rejection = entry confirmation
Invalidation: Clean break & close below 5,050
⚠️ Caution
Don’t FOMO buy at highs
Let price come to the zone — patience pays in gold 🟡
🏁 Summary
Trend bullish 📈
Pullback healthy
Buy low in structure → Target channel high

XAUUSD Keep moving upwardRecent escalation of US sanctions against Iran has reignited risk aversion in the market, driving gold prices higher at the open and continuing to rise in early trading. Prices climbed from around $4986, quickly breaking through the $5000 mark, briefly touching around $5093 in the morning, coinciding with the short entry point suggested earlier. The price subsequently retreated as expected, reaching a low of around $5052, a pullback of over 40 points, but did not provide an opportunity for long positions. During the European session, gold prices rallied again, reaching a high of $5110 before slightly retreating.
Watch for opportunities to go long after the price stabilizes during the US session. The overall strategy remains to maintain a slightly bullish bias within a range, with entry points chosen within key support and resistance zones.

Gold at 5K: The Trend Is Up… But a 3K–5K Drop Feels InevitableLately, Gold is on everyone’s lips, and for good reason: price is printing new all-time highs almost daily, and we are now trading around the 5,000 zone.
And even though I’m not blind — I’m absolutely not calling for an overall trend reversal — in my view, a correction of 3,000 to 5,000 pips is not only possible, but unavoidable at some point.
The only real problem is simple:
✅ When does that correction start?
✅ And from where exactly does it begin?
That’s what I’m trying to identify in this analysis: the timing and the location.
The Bigger Structure: Consolidation → Breakout → Channel
Looking at the chart, after reaching an ATH at the end of April 2025, Gold entered a symmetrical triangle consolidation phase that lasted until the end of August.
That consolidation acted as a continuation pattern, and once price broke out, we got a strong expansion leg that ended with the ATH from the end of October, near 4,400.
The correction that followed was strong — but honestly, also normal considering the magnitude of the move.
That pullback stabilized around the 3,900 zone, which later became the lower boundary of what turned into an ascending channel that Gold has respected since then.
The Key Detail: The Median Line Has Been the Real Resistance till January
One important detail here:
Until the beginning of 2026, the lower channel boundary offered consistent support.
However, the real resistance inside this structure has not been the upper channel line.
Instead, it has been the median line of the channel.
So rather than trading the channel “edge to edge,” Gold has spent a lot of time reacting to the median line as a decision level, behaving as resistance.
The Current Situation: Acceleration Above the Median Line
At the start of this year, price was back around 4,300, sitting directly on the channel support.
From there, Gold rallied aggressively.
In only three trading weeks, price climbed roughly 7,000 pips, and last week we saw a breakout above the median line, signaling acceleration.
That’s the key word here:
📌 Acceleration
When price breaks above the median line of an ascending channel, it often implies the market is trying to “stretch” toward the upper boundary before the next meaningful cooling phase.
So based on structure alone, it becomes reasonable to expect continuation toward the upper channel boundary, which currently sits around 5,150.
What History Inside This Channel Tells Us
Now, if we judge today’s situation using the prior behavior inside this same structure, we can see something very consistent:
Back in October, once Gold reached the upper boundary, it dropped violently — roughly 5,000 pips.
And after price touched support, every time Gold approached the median line again, it met sell pressure, and another correction followed.
This is also normal channel behavior:
✅ Median line acts as resistance when price is below it
✅ Median line can act as support when price is above it
✅ Strong moves toward the upper boundary often attract profit-taking
A New Piece of Context: JP10Y vs Gold Correlation
Now, there’s something worth mentioning here.
Even though I knew about it, I haven’t used this tool intensively before, but I believe it matters in this specific moment.
Yesterday, thanks to a TradingView Editors’ Pick , I found an article discussing the correlation between Japan 10-Year Bonds (JP10Y) and the price of Gold.
Looking at that comparison, three observations stood out:
- End of March (last year): bond interest dropped, and Gold followed
- October: bond interest was stable, and we got a correction
- March: there was a delay of around 4 days between the bonds starting to fall and Gold’s drop
Now, looking at the current JP10Y chart, we can see that interest has started to fall again.
What I Expect From This Bond Context (Without Overstating It)
I’m not expecting a strong fall like the one in March.
But I do expect something closer to what we saw in October:
➡️ a cooling / stabilization, meaning less upside pressure for Gold.
Putting Everything Together (The Full Logic)
So if we combine the structural view + the bond context + the recent volatility, we get a clean framework:
Gold is in a parabolic rise, and a correction is inevitable.
Since price broke above the channel median line last week, we can reasonably expect a test of the channel resistance around 5,150.
That would mean roughly another 1,000 pips upside, considering Gold is trading around 5,030 in off-market conditions — suggesting another potential upside gap at the Asia open.
JP10Y interest started to drop, and we could reasonably expect a stabilization scenario similar to October.
Recent corrections have been in the range of 7% to 12%, which at a 5,000 Gold price translates into:
~3,500 pips (7%)
~5,000 pips (10%)
~6,000 pips (12%)
My Conclusion
✅ Gold is bullish overall — no question about that.
✅ Gold is also bullish short-term — price can reasonably push into 5,150.
But…
📌 Besides intraday scalping, buying at these levels is not worth the risk (in my opinion).
What I Will Do
- Intraday buying can still be possible, but only with low volume
- I will pay extremely close attention to the upper channel resistance (if we reach that level)
- If I see strong reversal signs, I will sell
- And if I catch a good entry, I would genuinely want to hold a short trade for around 3,000 pips if not even more.
Have a nice Sunday!
Mihai Iacob

Gold ready to fallGold is consolidating below a strong resistance zone. Price failed to break higher and is showing weakness, with a possible pullback expected to fill the gap and retest the support area around 4989. Bias remains bearish below resistance unless a clear breakout occurs.

GOLD UPDATED: FINAL GRAND CYCLE ANALYSIS – $5,131 Hit, NEXT?hey everyone — quick update on the GOLD Grand Supercycle Chart ( 2026 edition ).
We've been riding this beast hard, and it's delivering exactly as mapped. We smashed through that first big fib target at $5,131 ( nailed it perfectly today ), printed a fresh all-time high around $5,190 on the 3W, and now... yeah, we're seeing the classic pullback kicking in. This looks like the transition from the end of the 3rd minor wave into the 4th — a healthy, needed breather before the final 5th leg of this minor cycle.
Short-term roadmap right now: Expecting a correction down toward the $3,600–$3,500 zone (marked in red on the chart as that 3-to-4 wave dip). Could be sharp, could grind, but it's the shake-out most people miss or panic-sell. Support clusters there line up with prior structure, fib retraces, and the longer-term channel floor.
Once that 4th wave bottoms, boom — 3rd wave of the minor cycle fires up, targeting ~$9,419 ( 3.618% extension cluster — clean alignment).
After that? The chart tells the rest of the story: Micro 4th wave correction (probably multi-month, classic profit-taking / "gold is done again" vibes).
Then Micro 5th pushes the envelope higher potentially topping near $22,744 (3.618%) , feeding into the Macro Wave 3 climax.
Bigger picture stays unchanged: Macro Wave 3 potentially topping near $22,744 (3.618%), then deep Wave 4 shakeout, followed by the monster Wave 5 blow-off into $78,940+ (or way higher in full fiat-reset chaos — $100k–$250k not off the table if trust fully evaporates).
This isn't hype — it's the same Elliott + fib + PA structure that's respected every major turn since the '70s. We're deep in the "price discovery" phase of Macro Wave 3, where third waves get parabolic and make doubters look silly.
Smart money's been accumulating for years; now retail's piling in, central banks keep buying physical, and the fiat narrative keeps cracking. Dips like the one coming are the last real gifts before the next leg rips.
Plan: Watch for confirmation of the $3,500–$3,600 bottom (higher lows, volume dry-up, reversal candles).
Scale in on weakness if you're positioned — this correction is setup for the next impulse.
Don't fight the trend; third waves extend, corrections get ugly but end.
Stay sharp, manage risk, and let's see if we print $9k+ sooner than most think.
Drop your thoughts below — you calling this dip to $3,500 or shallower? Positions?
What a time to be watching gold... the system's hedge is waking up for real.
Disclaimer: Not financial advice — just sharing the chart structure and my read. Do your own homework, trade your plan.

XAUUSD - London Session Context, Pre New York (Jan 27)Good morning traders,
We saw a pullback into the 5000 zone just before market close last night, which held as support.
Asia session:
Price built support around the 5033 area on H1 and pushed higher, forming the Asia high near 5085.
Currently during London session:
Price broke above the Asia high, tested the 5100 level, then rejected and fell back below.
Currently trading around the 5080 area.
What I’m watching now:
• As long as price stays below the 5085–5096 zone, a move toward the 5065 support is likely.
A break below there opens the door to the 5040–5033 area.
• A clean break and close above 5096 would shift focus higher, toward 5115 and potentially 5125.
Let price come to the levels. Patience and confirmation first.

XAU/USD: Bearish Trend Confirmation and Structural DistributionGold (XAU/USD) has reached a critical turning point on the 15-minute timeframe. After an aggressive bullish expansion, the price has encountered a high-interest institutional supply zone near the 5,110 - 5,120 range. The current technical landscape suggests that the market is transitioning from a period of accumulation into a clear distribution phase.
Technical Breakdown:
Supply Zone Rejection: The upper purple box represents a major resistance barrier where buyers have failed to sustain higher prices. This rejection has resulted in a "Lower High" formation, indicating that sell-side pressure is mounting.
Trendline Breakdown: The recent price action has decisively breached the ascending blue trendline. This shift marks a "Change of Character" (ChoCh), suggesting that the previous bullish momentum has been exhausted and a new bearish cycle is beginning.
Forecasted Trajectory: As indicated by the black forecast path, we anticipate a corrective move that targets internal liquidity. A series of impulsive waves toward the downside is expected as the market seeks to rebalance the recent move.
Key Targets:
Primary Objective: 4,912 – This level aligns with a significant structural demand zone (lower purple box) and serves as a major liquidity pool.
Secondary Objective: Potential expansion toward the 4,880 level if bearish volatility intensifies.
Risk Management: The bearish outlook remains valid as long as the price holds below the 5,154 resistance peak. A move above this level would negate the current reversal thesis and signal a potential bullish continuation.
Trading Strategy: This setup favors a "Sell the Rally" approach. Traders should look for bearish confirmation—such as an engulfing candle or a pin bar—near the broken trendline or previous minor resistance levels before targeting the deeper liquidity zones below.
