GOLD EXPLOSION: XAUUSD READY TO ACCELERATE!📰 BASIC SUMMARY (FA): PRESSURE ON USD AND SAFE HAVEN DEMAND
Gold is receiving strong support thanks to:
FED DOVISH: Recent comments from FED Governors (Waller, Williams) and information about Kevin Hassett potentially taking the position of FED Chairman (supporting strong rate cuts) are boosting expectations for rate cuts, weakening the US Dollar (USD).
GEOPOLITICS/ECONOMICS: News about conflicts in the Black Sea and weakening Chinese manufacturing data (PMI decline) reinforce Gold's safe haven role, pushing prices to a 6-week high.
📈 TECHNICAL ANALYSIS (TA): MAINTAINING UPWARD STRUCTURE
The 2H chart shows Gold in a clear UPWARD trend (with multiple BOS). The optimal strategy is to wait for price adjustments to the key demand zone:
Action: ENTRY (BUY)
Price Range: $4,185 – $4,192 (Breakout/Demand zone established. Wait for confirmation here.)
STOP LOSS (SL): Below $4,160.9 (Invalidates upward structure if price breaks.)
TARGET 1 (TP): $4,244.8 (Nearest resistance.)
TARGET 2 (TP): $4,270.1 – $4,276.1 (Main growth target.)
Strategy: Patiently wait for a Pullback to the $4,185 – $4,192 zone to enter a LONG position following the trend.
⚠️ IMPORTANT ECONOMIC CALENDAR:
Pay attention to the US ISM Manufacturing PMI data and other macro reports this week to assess USD momentum.
#XAUUSD #GOLD #GoldAnalysis #FED #Dovish #Uptrend #MarketStructure #TradingView #Forex
Xauusdanalysis

XAUUSD | Daily Idea | 1_Dec_20254h is bearish ( Mitigated to POI and takes a huge amount of Liquidity
15m is bullish swing ( there is one clean POI it will only work if there Liquidity build on pullback phase)
15m internal bearish to facilitate 15m swing pullback

XAU/USD — Market Blueprint > Bullish Road Ahead📊 Asset:
XAU/USD – “Gold vs U.S. Dollar”
Metals Market Opportunity Blueprint — Swing Trade Outlook
📈 Plan:
Bullish Bias (Swing Trade Setup) ✨
Gold continues to hold strong above major structural support, reflecting continued demand during USD volatility and broader risk hedging.
🎯 Entry Zone:
Any active market level based on your strategy
(Traders may enter on dips, breakouts, or momentum confirmation. Adapt to your preferred model.)
🛑 Stop Loss (Risk Control):
This is my SL: 4140.00
Dear Ladies & Gentlemen (Thief OG’s), kindly adjust your stop loss according to your strategy, account size, and personal risk management.
⚠️ Note: I am not recommending you use only my SL. Always manage your own risk—your money, your rules.
🎯 Target (Take Profit):
Primary Target: 4350.00
Price is approaching a major resistance zone, entering overbought conditions, and potential liquidity traps may form.
Be alert and secure profits when the market gives them.
⚠️ Note: Dear Ladies & Gentlemen (Thief OG’s), I am not recommending you use only my TP. Your exit depends on your own rules and risk appetite.
📡 Correlated Pairs to Watch (USD & Metals Market)
Tracking related instruments helps confirm direction, detect fakeouts, and build higher-conviction entries.
1️⃣ DXY (U.S. Dollar Index)
Gold moves opposite the dollar
Falling DXY = bullish support for XAU/USD
Watch for divergence between DXY strength and gold price action
2️⃣ XAG/USD (Silver)
Silver often moves ahead of gold in momentum shifts
Strong silver breakout = supportive signal for gold continuation
3️⃣ USD/JPY
Risk sentiment + yield fluctuations influence gold
Weak USD/JPY sometimes signals softer USD → bullish for gold
4️⃣ US10Y (U.S. 10-Year Treasury Yield)
Gold rises when bond yields drop
Falling yields = reduced opportunity cost → boosts gold attractiveness
5️⃣ SPX / NASDAQ
Equities sell-offs often push liquidity into gold
Risk-off flows = bullish gold environment
🔍 Key Market Notes:
Gold remains a preferred hedge while markets digest macro uncertainty
Overbought structure near resistance—tight management recommended
Liquidity zones ahead may trigger fake breakouts before true moves
Bullish continuation remains valid above key swing support

XAUUSD: Buy on a pullback to 4190After last Friday’s strong and continuous rally, gold remains firmly in a bullish formation. However, it’s important not to overlook the potential risk of a corrective pullback.
On the 4-hour chart, prices are approaching the previous highs, and gold is currently trading near an upper-wick zone, suggesting increasing selling pressure. At this stage, chasing the upside is no longer an optimal strategy, as the risk of a near-term retracement continues to rise.
A more prudent approach would be to wait for a pullback before re-entering long positions.
From the 1-hour chart, the nearest meaningful support lies in the $4,200–$4,190 zone, which represents both a psychological round-number level and an area close to previous swing highs. If the $4,200–$4,190 support range holds, it would provide an opportunity to resume long positions in alignment with the broader uptrend.
Trading Plan:
Buy: $4,200–$4,190 zone
Take Profit 1: $4,230
Take Profit 2: $4,250
Stop-loss: Adjust based on individual capital and risk tolerance

XAUUSD – LANA PRIORITIZES BUYING ACCORDING TO SWING WAVES AT...XAUUSD – LANA PRIORITIZES BUYING ACCORDING TO SWING WAVES AT THE BEGINNING OF THE WEEK
Fundamental Analysis
The Fed has just announced it will end the QT (quantitative tightening) program from December 1st, accompanied by a target federal interest rate of 3.75–4%.
When the Fed stops QT, the pace of balance sheet reduction slows down, meaning the pressure to withdraw liquidity from the market decreases, which is usually a positive factor for risky assets and gold.
Mechanism:
QE: balance sheet expands, injecting liquidity into the market.
QT: balance sheet contracts, withdrawing liquidity.
The temporary halt of QT leads the market to expect the Fed is being softer with monetary policy, thereby supporting the medium-term upward trend of gold.
In this context, Lana perceives that gold at the beginning of the week still has room to rise, but there will be fluctuations around important liquidity zones.
Technical Analysis
On the H4 chart, the price structure is following an upward Elliott wave, with clear waves (1)–(2)–(3)–(4)–(5). The current upward wave has not yet shown a major reversal signal.
The Swing zone 4190–4195 below is the nearest important bottom, acting as the main short-term support. This is also where Lana prioritizes watching for swing wave buying.
Above, two notable Liquidity zones:
4250–4260: near liquidity zone, potential for fake break/adjustment.
4365–4370: further liquidity zone, coinciding with the old peak, likely a strong profit-taking area if the price continues to expand the upward wave.
Lana's preferred scenario: gold may slightly adjust to the swing zone 4190–4195, then continue to expand the wave to test the upper liquidity zones in turn. However, right at the Liquidity zone, the market is very prone to stop sweeps, fake breaks, so Lana does not encourage chasing Buy at these zones.
Price Zones to Watch
Main Support (Swing & Buy Zone): 4190 – 4195
Resistance / Liquidity Zones: 4250 – 4260
4365 – 4370
Trading Scenario
Buy 4190 – 4195
SL: 4185
TP: 4250 – 4260 – 4365 – 4370

Gold Bulls Profit — Continue Buying Today, Next Target 4300Boom! Boom! Boom!
We made great profits last week, and with this week’s series of economic data plus international developments, the market should offer even better opportunities—meaning more chances for us to make money.
Gold has pulled back from around 4156 to the 4140 area. From a technical perspective, there should still be a chance for a second attempt upward. However, the 4250–4278 zone is a previously formed resistance area and won’t be fully absorbed in just one move, so another pullback is likely. Therefore, we won’t chase long positions for now. The main long opportunities remain below 4220, especially in the 4210–4180 range. As long as the price stabilizes there, that will be the best buying opportunity.
So today’s trading plan is:
Sell above 4250, buy below 4220.
The broader trend remains bullish, with a target toward 4300.

XAU/USD Price Outlook – Trade Setup📊 Technical Structure
FOREXCOM:XAUUSD Gold (XAU/USD) pulls back toward the 4,220–4,210 support zone after briefly testing the 4,256–4,266 resistance zone, while the broader bullish structure remains intact. Price continues to respect the rising trendline, and buyers are expected to re-enter on dips as long as support holds.
The chart presents a bullish continuation structure:
Support zone: 4,220 – 4,210
Resistance zone / target area: 4,256 – 4,266
While price stays above 4,210, corrective moves into support are likely to attract buying interest, with upside potential toward 4,256–4,266. A 4H close below 4,206 would invalidate the bullish structure and expose the 4,190 region.
🎯 Trade Setup
Idea: Buy dips into support, targeting a move toward the 4,256–4,266 resistance zone.
Entry: 4,220 – 4,210
Stop Loss: 4,206
Take Profit 1: 4,256
Take Profit 2: 4,266
Risk–Reward Ratio: ≈ 1 : 2.52
Bias stays constructively bullish while price holds above 4,220–4,210 on a closing basis.
A break below 4,206 would signal weakening momentum and invalidate the bullish idea.
🌐 Macro Background
According to FXStreet, gold extends gains above $4,200 as expectations for a December Fed rate cut continue to build. Markets now price in an 87% probability of easing at the December 9–10 FOMC meeting, significantly higher than the previous week.
Fed & USD drivers:
Weaker US economic data and dovish remarks from policymakers boost rate-cut bets.
Lower interest rates reduce the opportunity cost of holding gold, supporting upward momentum.
ISM Manufacturing PMI due later today may influence USD volatility—stronger data could weigh on gold temporarily.
Geopolitical factors:
Progress in US–Ukraine peace discussions may limit safe-haven demand.
Trump’s special envoy traveling to Moscow this week keeps geopolitical risk in focus, though the tone remains cautiously optimistic.
Overall, the macro backdrop continues to favor upside for gold while dips remain well-supported.
🔑 Key Technical Levels
Resistance zone: 4,256 – 4,266
Support zone: 4,220 – 4,210
Invalidation level (bulls): 4,206
📌 Trade Summary
XAU/USD maintains a bullish continuation structure above the 4,220–4,210 support area. As long as this zone holds, the setup favours buying dips and targeting 4,256–4,266. Fed rate cut expectations and geopolitical developments continue to provide underlying support for gold, though US data may introduce short-term volatility.
⚠️ Disclaimer
This analysis is for reference only and does not constitute trading advice. Trading involves significant risk, and proper risk management is essential.

Gold Bulls Triumph — Watch Resistance Near 4250 IntradayBoosted by weekend geopolitical tensions, gold opened higher today, although the upside has been relatively limited. In terms of data, the key economic releases are concentrated from Wednesday to Friday, while today and tomorrow will be driven mainly by sentiment. Market focus should remain on the progress of the Russia–Ukraine peace talks. If negotiations move smoothly, it could temporarily suppress bullish momentum in gold, though rising rate-cut expectations may offset part of the impact. Ultimately, this week’s direction still depends on Wednesday’s data and the major releases that follow.
Technically, the daily chart continues to show a bullish structure. However, as prices approach the 4250 level, selling pressure is likely to increase. Without significant news catalysts, gold may continue to consolidate within the 4170–4250 range, waiting for data-driven momentum to break out.
For intraday levels, key support lies in the 4186–4178 zone, while resistance sits at 4240–4258. If gold directly surges into the 4250–4260 region, pay attention to the 4216–4208 support zone during any pullback triggered by profit-taking.
Overall, the trading approach remains unchanged — buy on dips continues to be the primary strategy.

ElDoradoFx – GOLD SESSIONS ANALYSIS (01/12/2025, ASIA SESSION)
1. Market Overview
Gold continues trending bullish after reclaiming 4,212–4,202 support and extending through 4,220–4,230 breakout zone. Price is currently consolidating near recent highs, showing controlled momentum — typical pre-session positioning before liquidity expansion in London. No macro weakness unless structure loses support.
⸻
2. Technical Breakdown
D1
• Macro bullish intact
• Price holding above daily EMA stack
• RSI mid-high range → continued strength
• Next structural expansion possible towards 4,250+
H1
• Strong bullish push after BOS at 4,215
• Price retesting channel support with higher-lows protected
• EMA alignment bullish (fast > medium > slow)
• As long as 4,212 holds — continuation is favoured
15M–5M
• Micro retracement forming Asian accumulation
• Short-term structure bullish while maintaining HL formation
• MACD positive side recovery → trend continuation probable
• Pullbacks into support = potential re-entries
⸻
3. Fibonacci Analysis (Golden Zone)
Swing Reference: 4,202 → 4,230
Level Price
38.2% 4,221
50% 4,216
61.8% 4,212
📌 Golden Re-Entry Zone: 4,221 – 4,212
⸻
4. High-Probability Trade Scenarios
📈 BUY Scenario (Primary Bias)
Re-test Entries: 4,221 / 4,216 / 4,212 liquidity sweep
🎯 Targets: 4,232 → 4,245 → 4,257 → 4,275+
🛑 SL below: 4,202
📈 BUY Breakout Setup
Trigger: Clean break & hold above 4,232
🎯 Targets: 4,245 → 4,257 → 4,281
🛑 SL: 4,219 break-back
⸻
📉 SELL Scenario (Countertrend Only)
Sell Zone: 4,232–4,245 rejection only
🎯 Targets: 4,221 → 4,216 → 4,212
🛑 SL: Above 4,250
📉 SELL Breakout Setup
Trigger: Break below 4,212
🎯 Targets: 4,202 → 4,194 → 4,185
🛑 SL: 4,223
⸻
5. Fundamental Watch
• No major news in Asia — controlled range expected
• London + NY likely to generate breakout expansion
• Higher volatility expected once volume enters
• Watch DXY — weakness fuels upside continuation
⸻
6. Key Technical Levels
Support: 4,221 / 4,216 / 4,212 / 4,202
Resistance: 4,232 / 4,245 / 4,257 / 4,275+
Breakout Buy Trigger: > 4,232
Breakout Sell Trigger: < 4,212
⸻
7. Analyst Summary
Market remains bullish above 4,212.
Best re-entry = pullback into Golden Zone → continuation to 4,245+.
Breakout above 4,232 unlocks next leg of strength.
Only consider sells from 4,232–4,245 rejection or if 4,212 fails.
⸻
8. Final Bias
Bullish until 4,212 breaks.
📌 Smart money favour continuation — structure clean, momentum sustained.
⸻
— ElDoradoFx PREMIUM 3.0 Team 🚀
⸻

XAUUSD Bullish Continuation Setup - Targeting $4400 FOREXCOM:XAUUSD
XAUUSD is currently trading within a clear ascending channel on the 4-hour chart, indicating a strong short-to-medium-term uptrend. After a recent correction, the price found solid support on the lower channel boundary (around Nov 25th) and has since broken above a key diagonal resistance line.
We are anticipating a bullish continuation move, following the path of the projected arrow.
Trade Plan: I'm looking for a classic breakout and retest setup to confirm the upward movement.
Expected Entry: I'll be looking to enter on a pullback that retests the broken diagonal trendline and the key support zone around $4,123 - $4,157. This offers a high-probability entry point near the channel support.
Target: The primary target is the top of the ascending channel and the previous high, set at $4,381.73 / $4,400.00.
Invalidation Zone (Stop Loss): My trade is invalidated if the price closes below the swing low at 4,031.61, as this would signal a breakdown of the entire bullish channel structure.
Current Status: The price is currently consolidating near 4,218.00. Watching for the anticipated retest before entering the long position!
Remember: Always manage your risk.

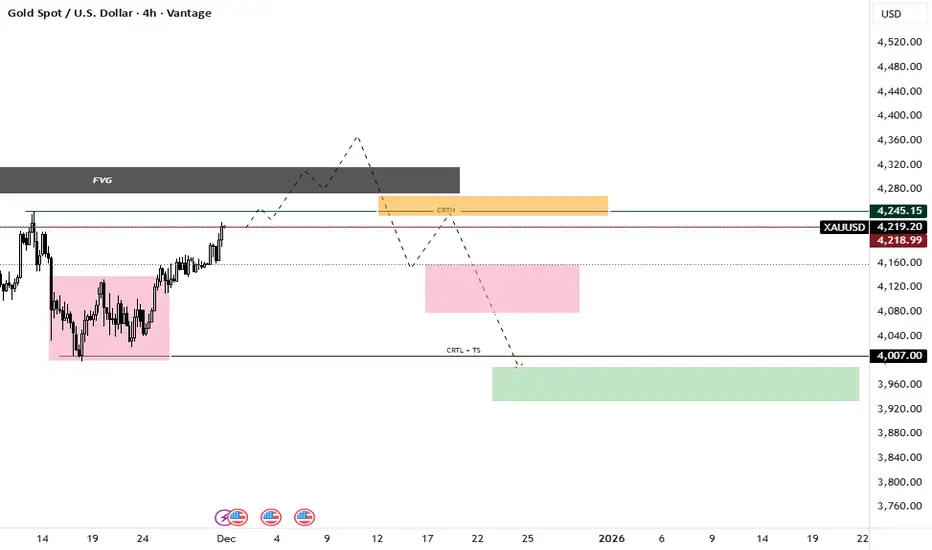
XAUUSD: Decoding the Smart Money Sell Model (MMSM) with CRTThe Narrative: Order in the Chaos Many see this chart as random noise, but through the lens of Candle Range Theory (CRT), we are witnessing a structured institutional narrative. We are currently tracking a classic Market Maker Sell Model (MMSM), where price is engineered to trap retail traders before the true delivery unfolds.
Technical Breakdown:
The Trap (Manipulation Phase): The current price action suggests we are in the manipulation phase. Price is drawing up into the FVG (Fair Value Gap) and the CRTH (Candle Range Theory High). This area acts as a magnet to induce early buyers and purge stops resting above recent highs. This is the "Purge" phase of the CRT cycle.
The Structure (MMSM): As seen in the Smart Money Sell Model, we are looking for the "Smart Money Reversal" (SMR) at these premium levels. We are waiting for price to purge the liquidity at the CRTH, mitigate, and then shift structure to the downside.
The Draw on Liquidity (DOL): Price moves because of liquidity, not just fundamentals. The ultimate target for this setup is the CRTL (Candle Range Theory Low) marked as TS (Turtle Soup). This represents the Sell-Side Liquidity (SSL) that Smart Money intends to harvest during the Expansion phase.
The Execution Plan:
We are not chasing the green candles; we are waiting for the story to complete.
Watch for the Purge: A sweep of the CRTH/FVG area.
Await Confirmation: A "Thick Candle" break or a closure back below Equilibrium (EQ) to confirm the manipulation is over.
Target: The expansion down to the CRTL + TS level.
“The market exists to transfer wealth from the impatient to the patient.”
Disclaimer: This analysis is based on Candle Range Theory and Smart Money Concepts for educational purposes. Always manage your risk.
Greetings,
MrYounity
XAU/USD Bullish Continuation Setup Toward 4,223 After Liquidity 1. Market Structure
The chart highlights a COCH (Change of Character) followed by a BOS (Break of Structure), signaling a shift from bearish to bullish structure.
Several smaller coch points confirm internal bullish structure building.
2. Liquidity & POI Zones
There is a clear liquidity sweep near the PDL (Previous Day Low), where price dipped into a demand zone to collect orders.
An Extreme POI (Point of Interest) sits below current price — this acted as the strong reaction zone for the bullish move.
PDH (Previous Day High) is marked as an early short-term target/liquidity area.
3. Expected Move
The projection (zig-zag line) indicates bullish continuation after a pullback into the POI zone.
The target is marked around 4,223.629, matching the red horizontal resistance line.
The EMA (9) serves as dynamic support, showing price respecting the bullish trend.
4. Probability Outlook
As long as price stays above the trendline and POI, the bias remains bullish.
A break below the POI would invalidate the setup and open the lower liquidity region again.

Gold Intraday Range With Highlighted Reaction ZoneThe chart shows price moving into a marked zone after a steady intraday climb.
A lower reference level is outlined, while the upper shaded area represents the region where recent movement is being observed. This layout helps visualize how price is currently interacting within its short-term structure.

XAUUSD Analysis todayHello traders, this is a complete multiple timeframe analysis of this pair. We see could find significant trading opportunities as per analysis upon price action confirmation we may take this trade. Smash the like button if you find value in this analysis and drop a comment if you have any questions or let me know which pair to cover in my next analysis.

XAUUSD BUYI expect Gold to push to the upside from Price action shown on the chart. Gold breakout and expecting pullback and rally toward above Fair value gap and Supply zone above.

Consolidate the upward trend. Buy on dips.Gold prices have fluctuated wildly, causing losses for many investors. The frustration and helplessness of investing can be summarized as bad luck. Not knowing when to take profits, hesitating for a short time resulted in losses, and there was no way to grasp the bullish or bearish trend of the market. It is hoped that Quaid's analysis and trading strategies can help those learning how to trade, how to control risk, and how to judge market trends.
Okay, back to market trading. Gold closed strongly this week, settling at $4219 on Friday and successfully holding above the key $4200 level. Early in the week, trading was relatively quiet due to the Thanksgiving holiday, with gold prices briefly dipping to $4142, but then rebounding quickly, accumulating a 3.8% gain for the week, forming a clear upward breakout.
Gold's strength was mainly supported by three factors. On the policy front, expectations of a Fed rate cut have strengthened, with CME data showing the probability of a December rate cut rising to 86.9%. A weaker dollar reduces the opportunity cost of gold. On the demand side, global central banks continue their aggressive gold purchases, with net purchases reaching a record 902 tons in the first three quarters. Goldman Sachs predicts that monthly purchases will average 80 tons in the future, providing long-term support. Geopolitical risks and ETF inflows have further stimulated demand for safe-haven assets, creating a synergistic effect of simultaneous increases in holdings by central banks and private capital.
Technically, the trend has strengthened. After breaking through $4200, gold prices face resistance at $4260 and $4285. Short-term moving averages are in a bullish alignment, with initial support at $4170 and strong support at $4150, limiting downside potential. The long-term uptrend line remains intact.
Trading Strategy:
Buy around $4190-$4195, targeting $4230-$4240. After a breakout, watch for $4160-$4180.
I will adjust strategies flexibly based on market fluctuations and update them on the channel.

XAUUSD SHORT TRADE?🟡 XAUUSD SELL SUMMARY
Price is inside strong supply 4215–4243.
Expect a liquidity grab up to 4235–4243, then rejection.
Sell after confirmation (wick rejections / bearish candle).
Targets:
TP1: 4160
TP2: 4140
Stop Loss: above 4250.
Structure suggests a pullback after this extended move up.

Gold Intraday Plan | Bullish Bias ,Watching Reaction ZonesGold continued its upward momentum after breaking out of the recent consolidation range, closing the session around 4215. The moving averages (MA50 & MA200) remain well below current price action, confirming strong bullish momentum and may act as dynamic support on any intraday dips.
The immediate resistance sits at 4232 — a clean break and sustained hold above this level would open the path toward 4274.
If 4,232 holds as resistance, watch the First Reaction Zone for a potential bounce.
Failure of this zone could trigger a deeper pullback into the Support Zone, where buyers may attempt to step back in.
The overall bias remains bullish, and dips continue to offer potential buying opportunities as long as price holds above the key support structure and maintains higher-timeframe trend alignment.
📌Key levels to watch:
Resistance:
4232
4274
4322
Support:
4185
4168
4141
4102
🔍Fundamental focus:
This week is loaded with key U.S. data that could drive volatility in gold.
We have ISM Manufacturing PMI, JOLTS, ADP jobs data, GDP revisions, unemployment claims, ISM Services PMI, and Friday’s PCE inflation numbers.
With so many high-impact releases stacked together, markets may react sharply to any sign of weakening labour conditions or shifts in inflation momentum — both of which directly influence Fed expectations.

GOLD H4 Buying Trade idea From the Support LevelHello Traders
In This Chart GOLD HOURLY Forex Forecast By FOREX PLANET
today Gold analysis 👆
🟢This Chart includes_ (GOLD market update)
🟢What is The Next Opportunity on GOLD Market
🟢how to Enter to the Valid Entry With Assurance Profit
This CHART is For Trader's that Want to Improve Their Technical Analysis Skills and Their Trading By Understanding How To Analyze The Market Using Multiple Timeframes and Understanding The Bigger Picture on the Charts

GOLD Buying Trade idea From the Support LevelHello Traders
In This Chart GOLD HOURLY Forex Forecast By FOREX PLANET
today Gold analysis 👆
🟢This Chart includes_ (GOLD market update)
🟢What is The Next Opportunity on GOLD Market
🟢how to Enter to the Valid Entry With Assurance Profit
This CHART is For Trader's that Want to Improve Their Technical Analysis Skills and Their Trading By Understanding How To Analyze The Market Using Multiple Timeframes and Understanding The Bigger Picture on the Charts

GOLD ( XAUUSD ) Buying Trade idea From the Support LevelHello Traders
In This Chart GOLD HOURLY Forex Forecast By FOREX PLANET
today Gold analysis 👆
🟢This Chart includes_ (GOLD market update)
🟢What is The Next Opportunity on GOLD Market
🟢how to Enter to the Valid Entry With Assurance Profit
This CHART is For Trader's that Want to Improve Their Technical Analysis Skills and Their Trading By Understanding How To Analyze The Market Using Multiple Timeframes and Understanding The Bigger Picture on the Charts

XAUUSD: Gold Wave HarmonyXAUUSD: Gold Wave Harmony
According to its wave structure, gold is completing a correction phase and preparing to form a new impulse. The chart shows a transition from sideways movement to a more dynamic wave, which could set the direction for the near term.
Main scenario: after the correction ends, a downward impulse sequence is expected to develop. Alternative scenario: if the market consolidates above recent highs, it could continue to rise, delaying the start of a new downward wave.
Idea for traders: watch for confirmation of the structure on lower timeframes and enter only after clear reversal signals appear.
Risk management: use clear stop levels and adjust the plan as new impulses emerge.
Friends, more wave analysis is available in our profile.
Subscribe to stay up to date with wave analysis!

GOLD EXPLOSION: READY TO CONQUER NEW HEIGHTS?I. HOT NEWS 💥
Gold is experiencing its 4th consecutive monthly increase, reaching $4,192.78/oz (closing on 11/28) thanks to significant changes from the Fed.
Interest Rate Reversal: Recent statements from the Fed Governor have increased the probability of a rate cut in December 2025 to 89% (up from 50% last week).
Gold Connection: A low-interest-rate environment is a paradise for Gold, propelling it to become a safe-haven asset. The fundamental momentum is EXTREMELY STRONG.
II. TECHNICAL ANALYSIS 📊
The price is approaching a critical supply zone. The current strategy is Buy on Dip with higher targets.
Short-term Resistance Target (PDI):
Price Range: $4,210 – $4,235
Strategy: Short-term resistance, requires a decisive Breakout to continue the upward momentum.
Ultimate Target (FVG):
Price Range: $4,260 – $4,330
Strategy: The next potential profit-taking target for Smart Money. Main Long target.
Strong Demand Zone (OB - Order Block):
Price Range: $4,046 – $4,064
Strategy: Strategic support (Demand Zone). A safe buying area if the price corrects deeply.
III. CONCLUSION & RISKS 🎯
Market Sentiment: Strongly BULLISH thanks to momentum from the Fed.
Focus: Monitor price action around $4,235. If surpassed, $4,330 is not far off.
Warning: Always manage risk (SL) tightly. Do not trade without Price Action confirmation!
#XAUUSD #GOLD #FOREX #FedDovish #RateCuts #SMC #OrderBlock #FVG #BullishTrend #TradingView
