Leg down before a proper push to new ATHFor me the ideal buy area lies between 4,137 – 4,144, aligning with a retest of the broken trendline and structure zone, which could now act as support. A stop-loss below 4,120 protects against a false breakout or liquidity sweep into the previous order block (OB). The target is set ATH 4400, which corresponds to a significant resistance and psychological round number. Volume spikes on the breakout support bullish continuation, suggesting buyers are in control. A pullback into the highlighted zone before resuming the upward move would offer the best risk-to-reward entry opportunity. Time will tell how it goes.
Xauusdanalysis
Gold Maintains Uptrend, Watch for Pullback to Buy with Cash Flow🔍 Context & Market Structure
After a strong upward impulse from a low liquidity area, the price has broken the downtrend structure and formed a bullish BoS on H1.
Currently, gold is accumulating above the Support Zone at 4,183 USD after creating a new peak and leaving a FVG just below the current price .
Above is the Liquidity Zone $$$ around 4,232 USD – a concentration of sell-side stop losses and buy-side profit-taking orders, likely to create a “final push” that attracts liquidity.
=> Overall: the main trend remains bullish , prioritising waiting for a pullback to discount levels to buy with the trend rather than chasing orders at high levels.
💎 Key Technical Zones
Liquidity Zone $$$: around 4,232 USD – upper liquidity area, prone to profit-taking reactions.
Current FVG: price gap area just below the current price (around 4.20x) – expected to “fill the gap” before continuing.
Support Zone 1: 4,183 USD – nearest support, confluence with the area where the upward impulse began to slow.
Support Zone 2: 4,140 USD – stronger support, aligning with the old structure.
Liquidity Clear: 4,101 USD – lower liquidity area, if swept, it would be a very attractive discount for swing buyers.
📈 Proposed Trading Scenarios
1️⃣ Main Scenario – Buy with the trend at FVG / 4,183 USD
Priority to wait for the price to:
Either fill the FVG around 4.20x and show a rejection candle,
Or clearly retest Support 4,183 USD with a bullish reversal signal on M15–H1.
When a confirmation signal appears:
→ Consider buying (BUY) around 4.19x – 4.18x .
Stoploss: below 4,175 USD (below the nearest low and support).
TP reference:
TP1: 4,210 USD
TP2: 4,232 USD (Liquidity Zone $$$)
TP3: trailing if the price breaks through 4,232 and maintains the bullish structure.
2️⃣ Alternative Scenario – Deeper Pullback Before Continuing Upward
If the price clearly breaks 4,183 USD and closes an H1 candle below:
→ Avoid buying hastily, wait for the price to continue adjusting to Support 4,140 USD or even Liquidity Clear 4,101 USD .
At these zones, if there appears:
strong rejection candles,
or small reversal structures (bullish ChoCH on M15),
→ Then consider buying at a discount with better RR, targeting a return to 4,183 → 4,210 → 4,232 USD.
3️⃣ Short-term Sell Scenario (for experienced scalpers only)
If the price hits Liquidity Zone 4,232 USD but shows strong rejection (long wick, high sell volume):
→ Consider short-term sell scalp back to the 4.20x – 4,183 USD area.
This is a counter-trend trade, so:
keep the volume small,
short TP,
tight SL above the newly formed peak.
⚠️ Risk Management Notes
Do not FOMO buy when the price is testing near the 4.23x area – this is a prone-to-sell area.
Prioritise waiting for a pullback to FVG / Support for a better entry point and RR.
Always adjust volume according to actual SL, avoid over-leverage during strong market volatility.
“Buy the dip in liquidity zones, do not chase orders at the peak – that's how to go with the big money flow.”

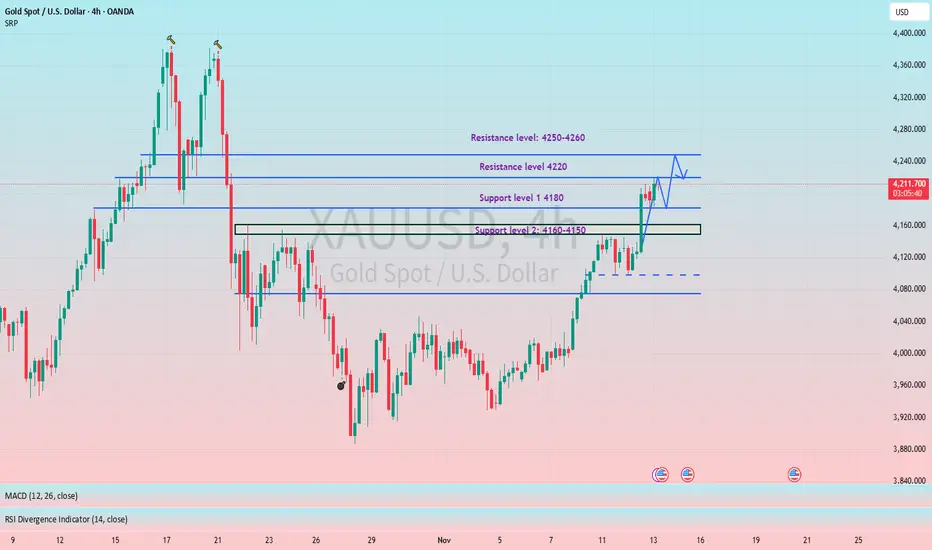
Gold Holds 4200, Bulls Eye 4250Gold showed a fluctuating upward trend today, successfully standing firm above the critical 4200 level, with strong bullish momentum. Supported by multiple positive factors, there remains room for further upside, though potential volatility risks should be guarded against.
From the daily chart structure, Gold has steadily broken through the key integer level of 4200 and successfully stood above the 61.8% Fibonacci retracement level of the recent pullback range, presenting a favorable technical pattern. On the indicator front, both RSI and MACD remain in positive territory, indicating sufficient short-term upward momentum.
Key support levels below are concentrated around 4180 and 4100. If these critical levels can be held, the subsequent upward trend is expected to continue; a breakdown below them may trigger technical selling, dragging gold prices toward 4075 or even the psychological threshold of 4000.
If gold can continue to hold firmly above 4200, the next target range is expected to be 4250, with further potential to test 4300.
Trading Strategy:
Buy 4170 - 4180
SL 4160
TP 4210 - 4220 - 4230
Sell 4230 - 4240
SL 4250
TP 4210 - 4220 - 4190

Golden Trap: Massive XAU/USD Sell OpportunityGold (XAU/USD) recently hit resistance near 4180–4200, a zone aligned with previous structural highs and a key Fib retracement zone (38.2%) from the recent swing top. The price has lost bullish momentum after a sharp rally, showing rejection wicks and fading volume. The multi-color ribbon EMA suggests early signs of a bearish crossover — indicating potential for a deeper correction.
Bearish Confluences:
Rejection at Fib Cluster (4180–4200) — aligns with both the local swing high and the 38.2% retracement level.
EMA Ribbon Curling Down — shorter EMAs are turning bearish, suggesting momentum exhaustion.
Bearish Market Structure Shift — lower highs forming after a parabolic rise, often preceding deeper retracements.
Overextended RSI / Momentum Divergence — previous highs not supported by equal strength on indicators.
Psychological Round Number Pressure (4200 zone) — historically a strong reaction level for gold.
🎯 Fibonacci Downside Targets (retracement from swing low to swing high):
Target 1 (38.2%) → $4,114 — Minor support, potential short-term bounce zone.
Target 2 (61.8%) → $4,072 — Golden ratio target and major structural support.
Target 3 (100%) → $4,005 — Full retracement zone and confluence with previous breakout
ElDoradoFx – GOLD ANALYSIS (13/11/2025, LONDON SESSION)1. Market Overview
Gold enters the London session trading around $4,209–$4,211, maintaining strong bullish momentum following an impulsive rally from $4,180 demand. Price is currently compressing below the key liquidity region $4,219–$4,223, forming a bullish continuation structure. As long as $4,195–$4,188 holds, gold maintains a bullish bias with potential for a London breakout.
⸻
2. Technical Breakdown
🔹 Daily (D1)
• Price continues the recovery after the November pullback, trading strongly above the 20EMA & 50EMA.
• RSI ~64 shows strong bullish control.
• Next major daily resistance remains $4,260–$4,300.
• A daily close above $4,219 increases probability of continuation toward $4,260+.
🔹 H1
• Structural BOS at $4,205 → $4,219 confirms bullish continuation.
• Price consolidates inside a tight range under resistance $4,219–$4,223.
• Support zones: $4,204–$4,195 and $4,188.
• RSI above 50 → bullish structure stays intact.
🔹 15M–5M
• Higher lows forming at $4,198 / $4,202.
• Price coiling inside ascending structure → typical pre-breakout compression.
• If gold dips, buyers expected to defend $4,204–$4,195 (Golden Zone).
⸻
3. Fibonacci Analysis (Swing 4,180 → 4,219)
Level Price
38.2% 4,204
50.0% 4,199
61.8% 4,195
🎯 Golden Zone: 4,204 – 4,195
(The main rebuy zone if London retraces)
⸻
4. High-Probability Trade Scenarios
📈 BUY SCENARIO (Primary Bias)
Buy Zone: 4,204 – 4,195 (Golden Zone + HL structure)
🎯 Targets: 4,219 → 4,230 → 4,245
🛑 SL: Below 4,188
✔️ Confirmation: 5M–15M CHoCH or bullish engulfing from Golden Zone.
⸻
📉 SELL SCENARIO (Countertrend)
Sell Zone: 4,219 – 4,223 (weak high + liquidity sweep zone)
🎯 Targets: 4,210 → 4,202 → 4,195
🛑 SL: Above 4,230
✔️ Confirmation: Bearish rejection + RSI divergence.
⸻
💥 BUY BREAKOUT SETUP
Trigger: Break & H1 close above 4,223
Retest Zone: 4,219–4,220
🎯 Targets: 4,235 → 4,245 → 4,260
🛑 SL: Below 4,210
⸻
💥 SELL BREAKOUT SETUP
Trigger: Break & close below 4,188
Retest Zone: 4,188–4,194
🎯 Targets: 4,180 → 4,168 → 4,150
🛑 SL: Above 4,202
⸻
5. Fundamental Watch
• London quiet until US midday data.
• US PPI and job numbers may trigger volatility in the New York session.
• Dollar remains soft, supporting bullish continuation unless structure flips below 4,188.
⸻
6. Key Technical Levels
Resistance Levels
• 4,219
• 4,223
• 4,235
• 4,245
Support Levels
• 4,204
• 4,195
• 4,188
• 4,180
Golden Zone
➡️ 4,204 – 4,195
Breakout Triggers
• Bullish: > 4,223
• Bearish: < 4,188
⸻
7. Analyst Summary
Gold remains in a clear bullish structure, but price is currently hitting resistance at 4,219–4,223, where liquidity is stacked. A dip into the Golden Zone (4,204–4,195) is healthy before a continuation. If London holds above 4,195, breakout toward 4,245–4,260 is likely.
A full bearish shift only occurs with a break below 4,188.
⸻
8. Final Bias Summary
📊 Bias: Bullish above 4,195
🔻 Invalidation: Bearish shift below 4,188
🎯 Focus: Watch Golden Zone reaction or a breakout above 4,223
⸻
— ElDoradoFx PREMIUM 3.0 Team 🚀

The bullish trend remains unchanged; we remain bullish on gold.#XAUUSD OANDA:XAUUSD TVC:GOLD
The daily chart is above the MA5 moving average, indicating that the bullish trend remains unchanged. However, we do not chase the price at high levels. Our core strategy is to wait for a pullback to support before going long. From the hourly chart, gold is fluctuating within the 4220-4180 range in the short term. If gold retraces to the short-term support of 4190-4180 during the European session, it is advisable to continue to go long on gold, with key support at 4160-4150. If the price rebounds to the previous high of 4250-4260, then yesterday's strategy remains valid.
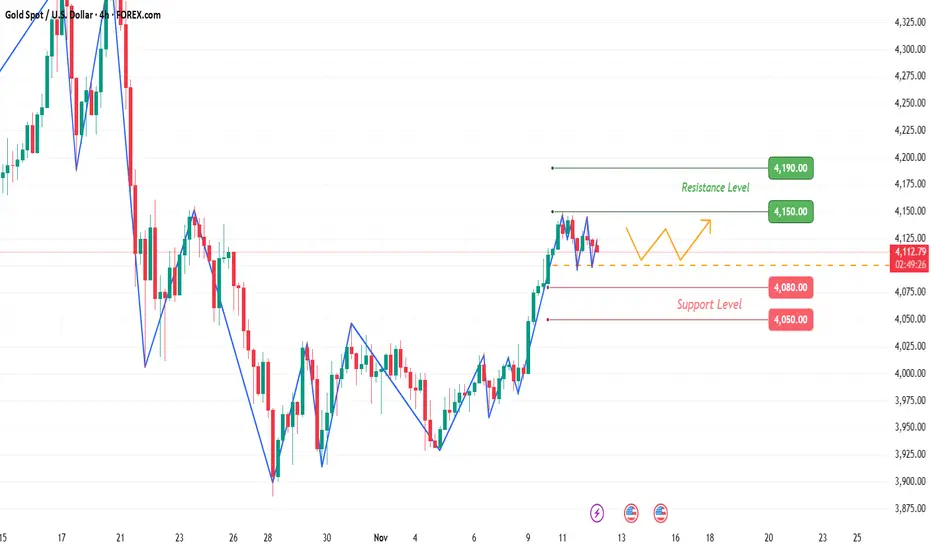
Gold Hits 4150 Resistance: Healthy Correction or Reversal?1. What Happened in the Last 24 Hours
Gold delivered an impressive bullish surge of over 1000 pips, reaching the 4150 resistance zone — precisely the level mentioned in yesterday’s analysis. The move was nearly one-directional, with only a brief intraday retracement after crossing above 4100.
2. Market Context
Such a strong advance often leads to short-term exhaustion, and that’s exactly what we’re seeing now. After touching the 4150 resistance, the price has started to pull back, which appears to be a normal correction rather than a trend reversal.
3. Technical Outlook
The first key support for bulls lies near 4075, followed by the 4050 zone, which is now an important structural level. As long as these supports remain intact, the uptrend remains healthy and the probability of another bullish leg is high.
4. Trading Plan
I remain bullish on Gold and plan to buy dips toward 4075–4050 zones. A sustained hold above these levels could open the way for a retest of 4200 resistance in the next sessions.
If the price falls below 4050 with strong momentum, I’ll reassess the bias — but for now, the path of least resistance is still up.
5. Conclusion
Yesterday’s explosive rally confirmed the bullish structure, and today’s pullback looks like a healthy correction within an ongoing trend. As long as 4050–4075 holds, buying dips remains the smart play. 🚀

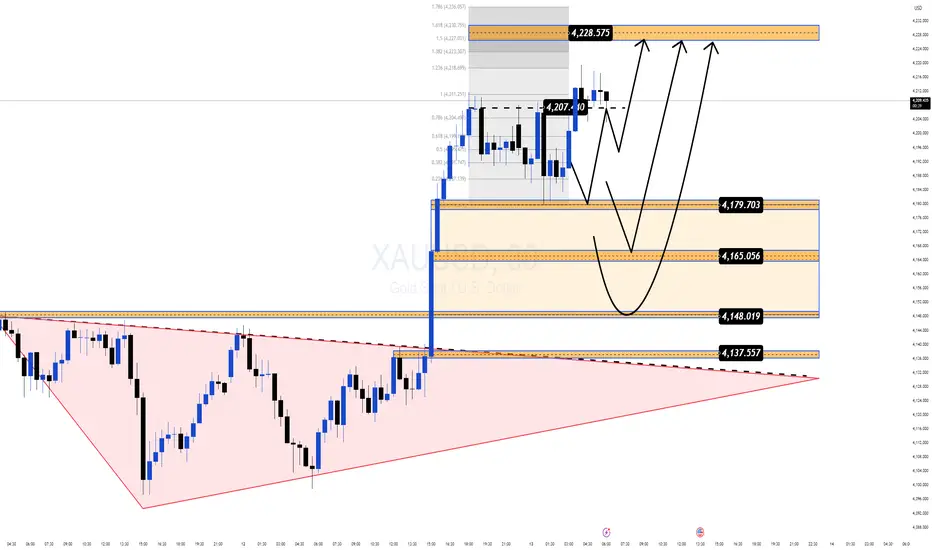
Gold Hits a 3 Week High but the Real Move Might Still Be LoadingGold just tapped $4,213 — the highest level in three weeks, powered by growing expectations of a dovish Fed and optimism around the potential reopening of the US government.
But the real story isn’t the headline spike — it’s the structure forming right beneath it.
📌 Why this zone matters right now
Price is pulling back into $4,179–$4,165, a clean Demand zone aligning with Fibo + breakout structure.
Buyers remain firmly in control despite a mild USD recovery.
The market swept liquidity around $4,207, hinting at accumulation before the next expansion.
The broader pattern resembles a falling-wedge breakout, often appearing before strong upside continuation phases.
🎯 Most Probable Scenario (Mind Insight)
Gold is in a “compression before expansion” phase.
Once this squeeze resolves, momentum is likely to continue in the direction that’s already dominant — and right now, that’s the bulls.
🔶 MMF BUY Zone
$4,179 → $4,165
Looking for a shallow pullback before the next leg.
🔼 Bullish Targets
• $4,207 (liquidity tap)
• $4,228 (Fibo 1.618)
• $4,236 (Fibo 1.786 — major reaction zone)
🧠 Key Takeaway
As long as Gold holds above $4,165, the bullish structure remains intact and the upside expansion toward the upper Fibo cluster stays in play.
Gold Momentum Extreme – Shorting Is High-Risk Despite Resistance1. What Happened Yesterday
Despite a weak start to the day that looked like the beginning of a deeper correction after Monday’s strong rally, Gold once again defended the 4100 interim support. Bulls quickly stepped in, and the market delivered yet another 1,000-pip bullish session — a pattern Gold has normalized these days.
2. Current Market Context
At the time of writing, price is hovering around the 4200 resistance zone, and the upside momentum remains extremely strong. Yes, after a 2,000-pip rise in just three days, a correction seems not only possible but probable.
However, we must also remember that last month Gold rallied 4,000 pips in a single week without any meaningful pullback — making short-term timing very tricky.
3. Technical Outlook
Key support levels to watch:
- 4150 – first intraday support
- 4100 – strong structural level
- 4050 – major swing support and line in the sand for bulls
Resistance levels:
- 4200 – current zone being tested
- 4280 – next clear target
- 4400 – all-time-high resistance
The structure remains bullish, but stretched.
4. Trading Plan
For swing traders, this is a difficult location to initiate new positions in either direction.
I personally prefer to buy only if Gold pulls back under 4100, where the risk-reward becomes more reasonable.
As for short trades, the combination of strong momentum and last month’s parabolic behavior makes them very high risk, even in strong resistance.
5. Conclusion
Gold remains in a powerful uptrend, and although a correction is likely, timing it is extremely challenging. Until we see a deeper pullback, I remain patient and only consider buys from lower support zones, preferably below 4100. 🚀

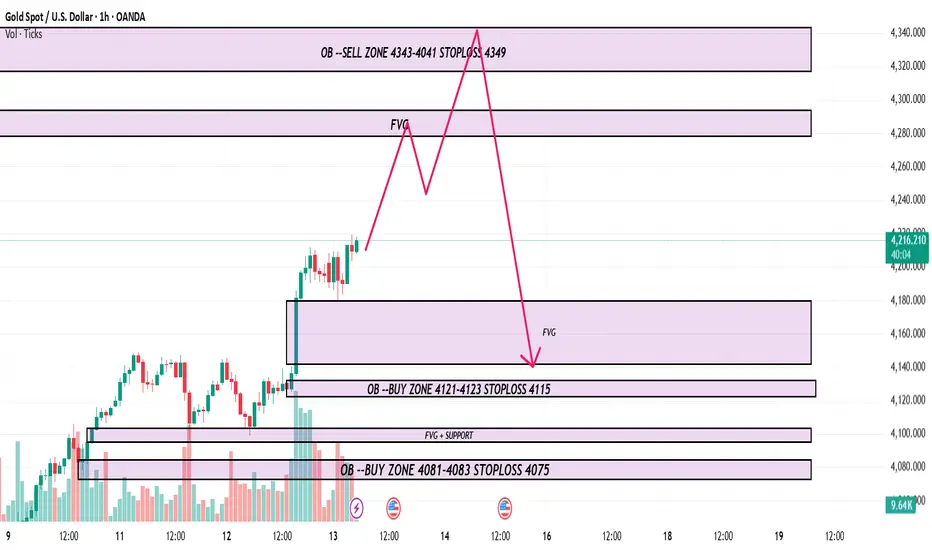
XAU/USD – Key Levels Ahead of U.S. Data🌐 MARKET CONTEXT
Gold is trading in a pivotal moment as safe-haven demand remains elevated while the Federal Reserve’s future policy path becomes less certain. The recent report noted that gold prices reached over $4,213/oz on November 13, 2025.
Trading Economics
Meanwhile, broader macro commentary highlights that escalating global uncertainty is sustaining gold’s safe-haven appeal.
World Bank Blogs
Sentiment currently:
Risk-on for gold when geopolitical/fiscal concerns intensify or real yields fall.
Risk-off for gold if the USD strengthens or the Fed signals fewer rate cuts than expected.
For the upcoming London → New York sessions: expect heightened sensitivity to U.S. inflation/job data and strong reactions near structural zones. The bias today remains conditionally bullish, but we must remain alert for bearish reversal if price fails at key supply zones.
📉 TECHNICAL ANALYSIS (SMC + Liquidity Structure)
The price is showing signs of consolidation near major structural zones — this suggests a build-up of liquidity rather than a clean breakout.
Key structure to watch:
If support zones hold and we see a Change of Character (CHoCH) (i.e., lower-low becomes higher‐low) → bullish continuation.
If price reaches a major supply zone and shows a sweep or fake breakout then rejection → potential Break of Structure (BOS) to the downside.
Liquidity zones:
Demand clusters around the 4,081–4,083 and deeper around 3,990–3,988 represent potential absorption/accumulation areas.
Supply is concentrated near 4,080–4,078 (and the newly defined higher sell zone) — watch for liquidity hunt above and returning drop.
Confirmation cues: look for wicked candles, liquidity sweeps, mitigation bars, or M5/M15 structure break before entry.
🔑 KEY PRICE ZONES
4,343 – 4,041 ▶️ Sell Zone – High-range supply cluster where short-bias may apply.
4,121 – 4,123 ▶️ Buy Zone – Structural demand zone for medium-term long setups.
4,081 – 4,083 ▶️ Buy Zone – Intraday demand / reversal potential.
3,990 – 3,988 ▶️ Buy Zone (deep support) – High reward if touched with confirmation.
Stop-loss levels:
Sell stop-loss: 4,349
Buy stop-loss (4,121 zone): 4,115
Buy stop-loss (4,081 zone): 4,075
Buy stop-loss (3,990 zone): 3,982
⚙️ TRADE SETUPS
✅ BUY SCENARIO 1 – STRUCTURAL DEMAND (MID)
Entry: 4,121 – 4,123
Stop-loss: 4,115
TP1: ~4,150 TP2: ~4,190 TP3: Open
Logic: Price returns to demand zone → confirmation required (sweep + rejection) → structural long.
✅ BUY SCENARIO 2 – INTRADAY REACTION DEMAND
Entry: 4,081 – 4,083
Stop-loss: 4,075
TP1: ~4,105 TP2: ~4,140 TP3: Open
Logic: Pull-back into middle zone -> quick reaction long for London session.
⚠️ SELL SCENARIO – SUPPLY REJECTION
Entry: 4,343 – 4,041
Stop-loss: 4,349
TP1: ~4,000 TP2: ~3,950 TP3: ~3,900
Logic: Price into upper supply zone → watch for rejection pattern or liquidity sweep above → short trigger.
🧠 NOTES / SESSION PLAN
Focus on buy setups in London session from 4,081 zone and deeper 3,990 zone.
Shift to sell setup if price moves into 4,343–4,041 and shows rejection during New York session.
Avoid entering immediately before major U.S. economic releases; look for confirmation (M5/M15) after news.
Risk-management: each trade max ~2% account risk; adjust size accordingly. Trail stop once TP1 achieved.
Expect choppy price action and fake moves; patience and structure confirmation are key.
🏁 CONCLUSION
Today’s plan: Bias leans bullish conditionally, with multiple buy zones at 4,121–4,123, 4,081–4,083, and 3,990–3,988 offering structured opportunities. However, a strong sell trigger remains valid at the supply zone 4,343–4,041, if rejection occurs. Trade should be guided by confirmation, strict risk control, and alignment with SMC structure.
XAUUSD – REFERENCE SCENARIO FOR NOVEMBER 13 – MONITORING ...💛 XAUUSD – REFERENCE SCENARIO FOR NOVEMBER 13 – MONITORING ELLIOTT WAVE 5 🎯
🌤 Overview
Hello everyone 💬
Gold is currently trading around the 4210 region, indicating that the upward momentum has slowed after two strong days of gains.
According to Elliott Wave, wave 5 may not have ended yet, and this area is becoming a strong resistance level – where prices could accumulate or adjust at any moment.
Besides technical factors, political news from the U.S. administration is causing significant USD volatility, leading to a wide fluctuation range for gold in the short term. Therefore, today it is crucial to prioritize risk management and monitor price reactions in the 4210–4260 region.
💹 Technical Analysis
📈 On the H4 chart, gold is approaching the resistance zone of 4210–4260, which also coincides with the 0.236 Fibonacci level and the previous FVG area.
🟣 A bearish view (ABC correction) will be confirmed if the price breaks below 4180 – targeting an adjustment to 4120–4050.
🔹 A bullish view remains valid if the H4 candle closes above 4212, in which case the trend may extend to 4250–4280.
🎯 Reference Trading Plan
💖 BUY Scenario (on breakout)
Entry: 4230–4232 | SL: 4225
TP: 4165 – 4190 – 4250
💢 SELL Scenario (reaction at resistance)
Entry: 4265–4267 | SL: 4273
TP: 4249 – 4215 – 4200
⚠️ Important Notes
Closely monitor reactions at the levels: 4246 – 4212 – 4260 – 4280.
USD is highly volatile due to political factors, which may cause rapid fluctuations in gold.
🌷 Gold is in a critical transition zone – Elliott wave 5 may soon conclude or expand further 💛
Be patient for clear confirmation, as even a small deviation at this stage can change the entire price structure.
If you find this useful, please 💛 like – 💬 comment – 🔔 follow LanaM2 to stay updated with daily gold insights ✨

XAU/USD OUTLOOK – TODAY 11/13/25The U.S. House has approved the reopening of the government, now awaiting President Trump's signature. This means U.S. economic data will gradually be released again, promising a week of strong and unpredictable volatility.
Technically, gold maintains an upward trend after breaking the H4 sideways boundary, but signs of overbought conditions and H4 peak divergence are emerging.
In smaller frames (M30 – H1), light divergence is also starting to appear, so BUY positions need to select favorable zones and avoid FOMO. SELL should only be short reactive trades.
🎯 Daily Scenario
Morning
Expect sideways movement ~30 points within the 4180 – 4212 range
You can WATCH FOR TRADING WITHIN THIS RANGE
if the price breaks through 4212, consider waiting for a retest back to 4205 to buy up.
Afternoon
Wait for gold to adjust to reasonable BUY zones:
4160 – 4162
4152 – 4148
4123 – 4120
If there is a strong adjustment:
Beautiful BUY at 4070 – 4040 (deep support zone).
🎯 Target increase:
4280 – 4285
4300 – 4305
🎯 Reactive SELL:
4255, 428X, 430X
(SL 10 – TP 10)
⚠️ Important Note
The overall trend remains uptrend, but attention is needed:
H4 shows signs of overbought + peak divergence.
M30 – H1 shows light divergence, indicating the market may have a short adjustment before continuing to rise.
BUY should only be entered at beautiful support zones, if you see a bad candle → close short and exit quickly.
SELL is only reactive at strong resistance zones, do not hold long.

Gold Price Outlook – Trade Setup (XAU/USD)📊 Technical Structure
OANDA:XAUUSD Gold (XAU/USD) extended its bullish run, reaching a new three-week high around $4,213, before encountering selling pressure near the Resistance Zone ($4,210–$4,216). The metal is now consolidating, with intraday support forming near $4,183–$4,188, aligning with the previous breakout level.
The short-term structure suggests a potential corrective dip before another push higher, as long as support holds above $4,181. A retest of the $4,212–$4,216 zone remains the primary upside target, while failure to sustain above support could expose the $4,170 area.
🎯 Trade Setup
Idea: Buy on dip near support, targeting retest of recent highs.
Entry: $4,188 – $4,183
Stop Loss: $4,181
Take Profit 1: $4,211
Take Profit 2: $4,216
Risk–Reward Ratio: ≈ 1 : 4.23
A close below $4,180 would invalidate the bullish setup, suggesting deeper retracement toward $4,170–$4,165.
🌐 Macro Background
Gold remains well-supported amid dovish Fed expectations and lingering economic concerns, despite a stronger risk appetite following the U.S. government reopening.
FXStreet’s Haresh Menghani commented that “Gold hits a three-week top as dovish Fed bets offset U.S. government reopening optimism.” 【FXStreet】
Fed Policy Outlook: Markets are pricing in roughly a 60% chance of a 25-basis-point Fed rate cut in December, as weak job data and soft inflation expectations weigh on the U.S. Dollar.
Labor Market Signs: Revelio Labs reported 9,100 job losses in October, with government payrolls down by 22,200, while the Chicago Fed noted a slight uptick in unemployment — reinforcing the view that economic momentum is fading.
Government Reopening: The U.S. Senate’s approval of a funding bill ended the longest government shutdown in history, sparking risk-on sentiment in equities. While this reduces safe-haven demand, the weaker macro backdrop keeps gold resilient.
Fed Commentary: Atlanta Fed President Raphael Bostic acknowledged that the job market remains balanced but warned against easing too slowly, emphasizing limited inflation risk — a stance the market interprets as mildly dovish.
In short, while risk sentiment caps near-term upside, monetary easing bets and weak macro data continue to underpin gold’s medium-term strength.
🔑 Key Technical Levels
Resistance: $4,211 – $4,216
Support: $4,183 – $4,188
Psychological Level: $4,200
📌 Trade Summary
Gold remains bullish above $4,183, with the bias favouring a buy-on-dip approach. As long as support holds, the metal is likely to rebound toward $4,211–$4,216, following its breakout momentum from earlier this week. The underlying macro tone continues to favour buyers in the medium term.
⚠️ Disclaimer
This analysis is for reference only and does not constitute trading advice. Trading involves significant risk, and proper risk management is essential.

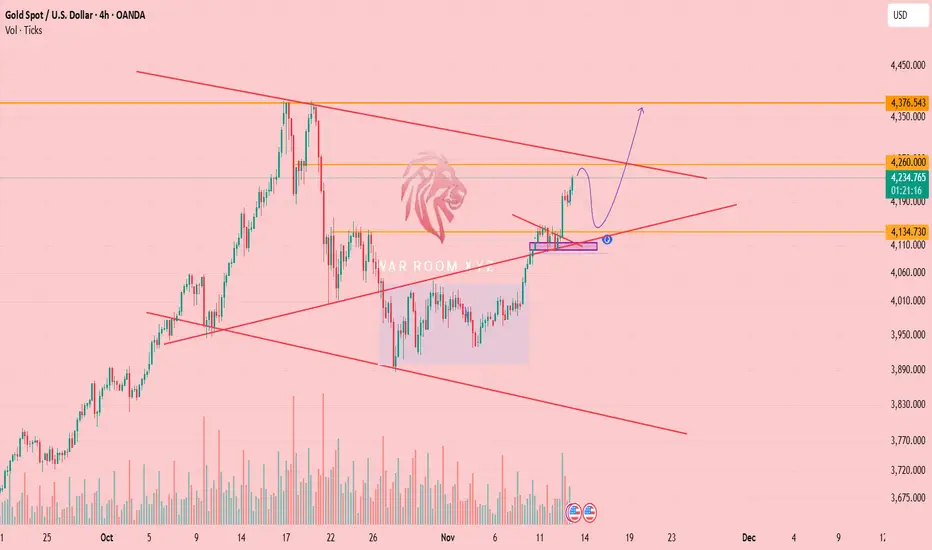
XAUUSD: Bullish Continuation Setup from Order BlocksKey Observations and Analysis
Strong Impulsive Move: The chart shows a significant, sharp upward move (a "pump") indicated by a large green candle that broke out of the prior consolidation area (the lower "D / OB" zone). This move highlights strong buying pressure and momentum.
Daily Order Block (D / OB): The large gray box labeled "D / OB" represents a potential Daily Order Block or a significant demand zone where institutional selling previously occurred before the current rally. The market rallied strongly from this area, confirming it as a potential accumulation zone or demand zone.
Current Consolidation and 1H/OB: Following the initial impulsive move, the price has entered a period of smaller consolidation/pullback. The smaller shaded area labeled "1H / OB" represents a 1-Hour Order Block. This area is often viewed as the key demand zone that initiated the last segment of the strong push up.
Bullish Scenario: The analysis suggests a bullish continuation is likely. The green arrow indicates the anticipated price action:
A pullback or retracement (the 'W' shape) into the 1H / OB zone. This pullback often "retests" or "mitigates" the demand in the order block.
A reversal and continuation of the uptrend, targeting the recent high around $4,220.00 and potentially higher.
Structure: The current price action (above the D/OB and consolidating) suggests the trend is bullish and the market is preparing for the next leg up after a shallow retracement.
Conclusion
The chart displays a clear bullish continuation setup. Traders utilizing this model would look for long (buy) entries within or just above the 1H / OB area, targeting the previous swing high as a minimum objective. The analysis is predicated on the idea that the strong impulsive move will be followed by a minor correction before resuming the primary uptrend.

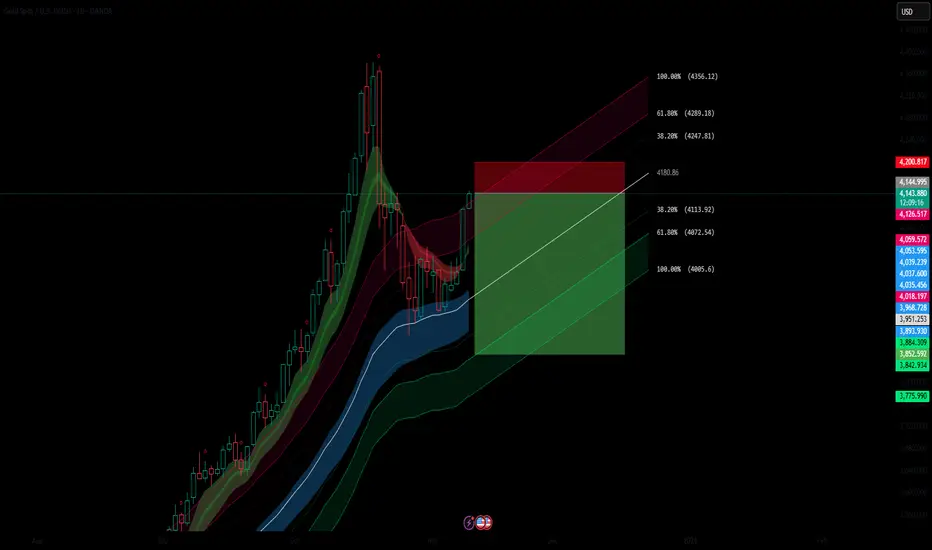
XAUUSD Daily Chart Analysis: Potential Reversal from Premium FVGKey Observations & SMC Components
Strong Bullish Trend: The price experienced a significant rally leading up to the high on October 20th.
Break of Structure (BOS): The price recently broke above a previous swing high, marked as BOS (Break of Structure). This indicates a continuation of the short-term bullish momentum or a shift from bearish to bullish on lower timeframes.
Inefficiency/Fair Value Gap (D / FVG): The shaded gray area is identified as a D / FVG (Daily / Fair Value Gap). This area represents an imbalance in the market, often targeted for a price reaction or fill. Since the price is currently trading above the previous consolidation (near the high of the recent range), this FVG is considered to be in a Premium area.
Current Price Action: The price has moved into the lower part of the FVG.
Liquidity Grab/Equal Lows (X): The level marked X represents a prior swing high that was swept by the subsequent move, which then led to the BOS. It may also represent an area of liquidity (e.g., stops placed below that swing high) that was recently taken.
Projected Move (Arrow): The black arrow suggests a potential short trade from within the FVG, targeting the area indicated by the dotted line below the most recent swing high. This target likely represents a liquidity void or the internal liquidity of the most recent up move (perhaps an equal low or an old FVG/Imbalance on a lower timeframe).
Interpretation and Potential Scenario
The analysis suggests a trader is looking for a reaction/reversal from the Daily Fair Value Gap (FVG) in the Premium area.
Entry Trigger: The trader would likely look for a bearish confirmation (e.g., a change of character/market structure shift on a lower timeframe like H4 or H1) once the price is fully within or near the top of the FVG.
Target: The projected target (dotted line) suggests a move to correct the recent impulsive up-leg, potentially aiming for an internal liquidity point or the recent higher low before a potential continuation of the broader bullish trend, or even a deeper retracement.
In summary, the chart outlines a high-probability SMC short setup based on a retracement into a Premium FVG.

GOLD: Look For Bullish Breakout From The +FVGIn this Weekly Market Forecast, we will analyze the Gold (XAUUSD) for the week of Nov. 10-14th.
Gold has been consolidating in a +FVG since last week... and it is still holding! Wait for price to break the high of the consolidation and then look for long setups.
Be mindful that price may sweep the sell side LQ before it moves higher.
Enjoy!
May profits be upon you.
Leave any questions or comments in the comment section.
I appreciate any feedback from my viewers!
Like and/or subscribe if you want more accurate analysis.
Thank you so much!
Disclaimer:
I do not provide personal investment advice and I am not a qualified licensed investment advisor.
All information found here, including any ideas, opinions, views, predictions, forecasts, commentaries, suggestions, expressed or implied herein, are for informational, entertainment or educational purposes only and should not be construed as personal investment advice. While the information provided is believed to be accurate, it may include errors or inaccuracies.
I will not and cannot be held liable for any actions you take as a result of anything you read here.
Conduct your own due diligence, or consult a licensed financial advisor or broker before making any and all investment decisions. Any investments, trades, speculations, or decisions made on the basis of any information found on this channel, expressed or implied herein, are committed at your own risk, financial or otherwise.

GOLD H1 – Awaiting CPI Data for Next Big Move🟡 XAUUSD – Intraday Smart Money Plan | by Ryan_TitanTrader (12/11)
📈 Market Context
Gold remains in a controlled retracement phase after a strong impulsive leg last week. The market is now consolidating within a defined 1H range, showing clear reactions near short-term EMAs as traders await today’s U.S. CPI release, a key driver of intraday volatility.
• A higher-than-expected CPI could reignite USD strength and push gold toward the discount zone.
• A softer CPI print may trigger a renewed push into the premium zone, inviting liquidity grabs above 4200.
Institutional flows remain balanced between short-term profit-taking and position building ahead of the inflation print, suggesting engineered liquidity sweeps before the real move unfolds.
🔎 Technical Analysis (1H / SMC Style)
• Structure: Market structure is still bullish but showing distribution signs at the top of the range.
• Premium Zone: 4201–4199 aligns with unmitigated supply — a prime area for potential sell-side reaction if CPI sparks a bullish liquidity sweep.
• Discount Zone: 4083–4081 overlaps with the 0.618 Fibonacci retracement and sits just above EMA100 — an ideal re-accumulation area for institutional buys.
• Liquidity: Equal lows near 4080 and equal highs near 4200 make both sides vulnerable to engineered stop-hunts before direction is confirmed.
🔴 Sell Setup (Premium Reaction Zone)
• Entry: 4,201 – 4,199
• Stop-Loss: 4,210
• Take-Profit Targets:
→ 4,140 (first liquidity pocket)
→ 4,102 (mid-range equilibrium)
→ 4,083 (discount zone confluence)
📌 Only valid if CPI causes a liquidity sweep into premium, followed by M5–M15 bearish BOS confirmation.
🟢 Buy Setup (Discount Reaction Zone)
• Entry: 4,081 – 4,083
• Stop-Loss: 4,074
• Take-Profit Targets:
→ 4,102
→ 4,140
→ 4,199
📌 Only valid if price sweeps 4080 liquidity and reclaims structure with bullish BOS on M15 timeframe.
⚠️ Risk Management Notes
• Wait for CPI-induced volatility before executing any setup.
• Avoid mid-range trades between 4100–4140 — this is equilibrium noise.
• Reduce size pre-news; volatility spikes can trigger premature stops.
• Scale partials at each liquidity pocket and trail stop-losses accordingly.
✅ Summary
Gold is consolidating ahead of CPI, with dual liquidity zones clearly defined:
• Sell zone: 4201–4199 (premium reaction area)
• Buy zone: 4083–4081 (discount re-entry area)
The market is likely to hunt one side of liquidity before revealing true intent. Traders should remain patient, trade from extremes, and align entries with confirmed structure shifts.
FOLLOW @Ryan_TitanTrader for real-time SMC updates ⚡

XAUUSD: Liquidity Sweep Incoming? Short Setup Identified! Timeframe: 15-Minute (15M)
Asset: Gold Spot / U.S. Dollar (XAUUSD)
Gold has reached a critical decision point. After a sharp move into the recent Fair Value Gap (FVG), the market structure is signaling a potential continuation of the bearish move to hunt for lower-level liquidity.
We are currently seeing rejection at the lower boundary of the FVG, suggesting institutional pressure is likely stepping in to defend this area. The failure to trade convincingly above the FVG's equilibrium offers a strong conviction for a short-term reversal.
THE PLAN:
Entry/Bias: Maintaining a SHORT bias as long as price action respects the FVG high.
Target: The primary objective is the (CRTL) zone around $4,180.26. This level represents significant prior support and an area where retail stops are likely resting—a perfect liquidity grab.
Invalidation: A decisive close (candle body) above the FVG would invalidate this setup and suggest a move higher is pending.
Keep a close eye on price interaction with $4,197.90. This looks like a high-probability opportunity to participate in a liquidity sweep.
What are your thoughts? Drop a comment and let me know if you are long or short Gold this week!
Trade smart, not hard.
Greetings,
MrYounity

Gold continuation patternHere's exactly my idea, confirm it before you enter a trade! daily and 3H timeframe gaps. recommended to hit that gap only before it retraces back to 3600-3700 or above zone again.
Wait for that entry buy zone again. Or if you want to short this idea. look on 3H swept.
Chart is on daily. we might see 4180-4200, that's my short zone!
If you're having a good thoughts comment yours. this is a free community. Been dealing this moves. It's my base fibonacci level 1.61 above/retrace! before the price continues higher.
Follow for more. Watch only my zones entry buy/sell , Long/short! choose wisely.
To invest in my idea direct/private me here! with 70-30 split profit!

ElDoradoFx – GOLD ANALYSIS (13/11/2025, ASIA SESSION)1. Market Overview
Gold enters the Asia session trading around $4,194–$4,200, extending the strong bullish continuation from yesterday’s impulsive rally that broke multiple intraday structures. Price is now pressing into a fresh short-term supply zone at $4,198–$4,211, after an aggressive upside move from the $4,125 liquidity zone.
Momentum remains bullish but overstretched, and Asia is likely to create a pullback before continuation.
⸻
2. Technical Breakdown
🔹 Daily (D1)
• Bullish continuation with a strong daily candle closing above previous BOS.
• Price is approaching the broader descending trendline but still has room to extend to $4,250–$4,300 if momentum persists.
• RSI ~63 showing bullish strength but nearing overbought conditions.
• Higher-timeframe support sits at $4,014–$3,910.
🔹 H1
• Strong breakout from the intraday downtrend structure.
• Price is consolidating under $4,200–$4,211 which aligns with previous liquidity & RSI(70) levels.
• EMAs fully aligned for bullish continuation (10/20/50 EMA stack).
• Pullback into $4,172–$4,150 is healthy before another leg up.
🔹 15M–5M
• 15M shows repeated equal highs + weak high around $4,198–$4,211, indicating liquidity above.
• 5M shows early exhaustion and decreasing MACD momentum.
• Structure supports a pullback first, then continuation.
⸻
3. Fibonacci Analysis
Swing used: $4,125 → $4,211 (latest impulsive leg)
• 38.2% = $4,178
• 50.0% = $4,167
• 61.8% = $4,156
🎯 Golden Zone: $4,178 – $4,156
This aligns perfectly with 15M demand + EMAs — ideal bullish continuation zone.
⸻
4. High-Probability Trade Scenarios
📈 BUY SCENARIO (Primary Bias – Continuation)
Buy Zone:
• $4,178 – $4,156 (Golden Zone + EMA stack + bullish CHoCH area)
Targets:
• TP1: $4,200
• TP2: $4,211 (Weak High)
• TP3: $4,230–$4,245
• TP4: $4,260+ (Next H1 liquidity range)
Stop Loss:
• Below $4,150
Confirmation:
• Bullish engulfing on 5M–15M
• BOS / CHoCH from Golden Zone
• MACD flips green from zero line
⸻
📉 SELL SCENARIO (Countertrend Only)
Sell Zone:
• $4,198 – $4,211 (Major liquidity + supply + Weak High)
Targets:
• TP1: $4,185
• TP2: $4,178
• TP3: $4,167
Stop Loss:
• Above $4,220–$4,225
Confirmation:
• Sharp rejection w/ long upper wick
• Divergence forming at highs
• 5M BOS below $4,188
⸻
💥 Breakout BUY Setup
Trigger:
• Break & 15M close above $4,211
Retest Zone:
• $4,200–$4,205
Targets:
• $4,230 → $4,245 → $4,260+
Stop Loss:
• Below $4,190
⸻
5. Fundamental Watch
• Asia typically low volatility, expecting pullback before London drives direction.
• Market still reacting to CPI aftermath and Fed expectations of rate pause.
• DXY holding weak levels helps gold maintain bullish momentum.
• No major Asia news; focus will shift to London session liquidity.
⸻
6. Key Technical Levels
Resistance
• 4,198
• 4,211 (Weak High / Liquidity)
• 4,230
• 4,245
Support
• 4,178
• 4,167
• 4,156
• 4,125
Golden Zone
$4,178 – $4,156
Breakout Triggers
• Bullish: >4,211
• Bearish: <4,150
⸻
7. Analyst Summary
Gold remains bullish after a strong impulsive leg from $4,125. Price is now consolidating under a major liquidity level at $4,211. Asia is likely to retrace into the Golden Zone before continuing higher into $4,230–$4,260.
Only look for sells at the top of the range or on confirmed reversal signals.
⸻
8. Final Bias Summary
📊 Bias: Strongly bullish above $4,167
🔻 Invalidation: Bearish only below $4,150
🎯 Focus: Buy the pullback into Golden Zone for continuation.
⸻
🥇 ElDoradoFx PREMIUM 3.0 – PERFORMANCE 12/11/2025 🥇
📅 Consistent intraday gains + powerful swing continuation.
━━━━━━━━━━━━━━━
🪙 XAU/USD (GOLD) Results
🟢 BUY +20 PIPS
🟢 BUY +30 PIPS
🟢 BUY +40 PIPS
❌ SELL -40 PIPS (SL)
🟢 BUY +210 PIPS
🟢 SELL +15 PIPS
🟢 BUY +210 PIPS
---
📈 SWING TRADE UPDATE (From 05/11)
🟩 Floating Profit: +2,400 PIPS
Swing trend remains intact with strong momentum.
━━━━━━━━━━━━━━━
💰 TOTAL DAILY GAIN: +485 PIPS
📊 7 Trades → 6 Wins (1 SL)
🎯 Accuracy: 86%
━━━━━━━━━━━━━━━
🔥 Another profitable day with clean executions and strong directional confidence.
👏 Congratulations if you profited! ✅✅✅🚀🚀🚀
— ElDoradoFx PREMIUM 3.0 Team 💼📈

Gold at a Turning Point — The Final Breath of Wave (ii)?Following our previous Gold analyses, where we perfectly anticipated the major drop, it now appears that the corrective wave (ii) is nearing completion.
Although a small push higher could still occur, the current price zone is extremely risky for long positions, and it’s time to start looking for sell setups instead. 📉
Based on the Elliott Wave structure and Fibonacci projections, once this correction ends, the market is likely to enter wave (iii) to the downside — typically the strongest and most aggressive part of the entire sequence.
At this stage, patience and disciplined risk management are key, as the main bearish trend may soon reclaim full control of the market. ⚔️
-----------------------------------------------------------------------------------------------
🚀 Who am I?
I'm Mahdi, a prop firm trader with 7+ years of experience in technical analysis, mainly focusing on Smart Money Concepts and Elliott Wave theory.
I specialize in delivering high-quality trading signals, market insights, and educational content tailored for serious traders and investors.
📊 My Tools: SMC, Elliott Wave, Fibonacci, Liquidity Grabs, Order Blocks
💼 Prop Challenge Passed: Yes | Funded Account: In Progress
🔗 Follow for consistent updates and trading insights.

Gold: The broader bullish trend remains unchangedGold held the key 4100 level today, indicating that the current market sentiment still leans bullish. This aligns with my proposed strategy of buying on pullbacks. During the U.S. session today, gold's bullish momentum continued to break through, reaching a high around 4211.
For support below, we should focus on the 4145-4150 zone. I have consistently emphasized that the broader trend remains bullish, so it's advisable to avoid trading against the trend. Operationally, prioritize buying on pullbacks.

Gold: Intense long-short rivalry.There has been intense long-short rivalry in gold today, and in the short term, focus should be on the breakthrough of key levels and the effectiveness of support.
Continue to keep a close eye on the 4150-4160 resistance zone above. If it can be successfully broken through, there may be a new upward wave ahead, potentially even moving towards the 4190-4195 range.
For the downside, pay attention to the support around 4080. If the critical support level of 4080 USD is breached, it may trigger follow-up selling, further pushing gold prices down to around 4050.
Overall, in terms of operations, we should patiently wait for entries at key levels and avoid blindly following the trend.
Trading Strategy:
Buy 4090 - 4100
SL 4070
TP 4130 - 4140 - 4150
Sell 4160 - 4165
SL 4170
TP 4120 - 4110 - 4100