GOLD (XAU/USD): FED ALERT! IS THE BOTTOM IN?Hello TradingView Community! Gold is standing at a critical juncture. The convergence of the US Federal Reserve (FED) decision, US-China trade talks, and geopolitical risks is setting the stage for significant market movement.
1. 🌍 Fundamental Analysis (Macro): Geopolitics vs. Rate Cuts
Bearish Headwinds: Positive developments in US-China trade discussions eased comprehensive trade war fears, causing safe-haven demand to drop and pushing Gold below the $3,900 mark.
Strong Support Factors:
The market is heavily anticipating the FED will cut borrowing costs by 25 basis points at the conclusion of its two-day meeting (scheduled for tonight/early tomorrow). Lower rates typically support Gold (a non-yielding asset).
Escalating US-Russia geopolitical tensions (new sanctions, canceled meetings) and the ongoing US government shutdown highlight internal instability, providing a continuous underlying bid for the safe-haven metal.
2. 📈 Technical Analysis: Wave C Bottom and Rebound Targets
Based on the Elliott Wave structure on your chart, the technical picture is sharp:
Wave C Completion: The recent drop to $3,892.152 appears to have completed the 5-wave structure of the larger corrective Wave C. This suggests a strong possibility that a major bearish cycle has ended.
LONG Target: If the rebound scenario holds, Gold is targeting the crucial Fibonacci resistance zone: $4,135 - $4,180.
Key Levels to Watch:
Confirmation Resistance: A decisive break above $4,042 will strongly confirm the upward momentum.
Stop-Loss (SL): Risk management demands a strict stop-loss placed just below the Wave C low at $3,892.152.
Conclusion: The combination of geopolitical support, FED rate cut expectations, and the technical signal of a potential Wave C bottom offers an attractive Risk/Reward setup for LONG (Buy) positions. All eyes are now on the FED announcement tonight/tomorrow morning!
#XAUUSD #GOLD #FED #ElliottWave #TradingView #MarketUpdate What are your thoughts? Are you going Long or Short into the FED event? 👇
Would you like me to draft a quick contingency plan for Gold in case the FED's statement is unexpectedly hawkish (less dovish than expected)?
Xauusdanalysis

GOLD (XAU/USD): FED ALERT! IS THE BOTTOM IN?Hello TradingView Community! Gold is standing at a critical juncture. The convergence of the US Federal Reserve (FED) decision, US-China trade talks, and geopolitical risks is setting the stage for significant market movement.
1. 🌍 Fundamental Analysis (Macro): Geopolitics vs. Rate Cuts
Bearish Headwinds: Positive developments in US-China trade discussions eased comprehensive trade war fears, causing safe-haven demand to drop and pushing Gold below the $3,900 mark.
Strong Support Factors:
The market is heavily anticipating the FED will cut borrowing costs by 25 basis points at the conclusion of its two-day meeting (scheduled for tonight/early tomorrow). Lower rates typically support Gold (a non-yielding asset).
Escalating US-Russia geopolitical tensions (new sanctions, canceled meetings) and the ongoing US government shutdown highlight internal instability, providing a continuous underlying bid for the safe-haven metal.
2. 📈 Technical Analysis: Wave C Bottom and Rebound Targets
Based on the Elliott Wave structure on your chart, the technical picture is sharp:
Wave C Completion: The recent drop to $3,892.152 appears to have completed the 5-wave structure of the larger corrective Wave C. This suggests a strong possibility that a major bearish cycle has ended.
LONG Target: If the rebound scenario holds, Gold is targeting the crucial Fibonacci resistance zone: $4,135 - $4,180.
Key Levels to Watch:
Confirmation Resistance: A decisive break above $4,042 will strongly confirm the upward momentum.
Stop-Loss (SL): Risk management demands a strict stop-loss placed just below the Wave C low at $3,892.152.
Conclusion: The combination of geopolitical support, FED rate cut expectations, and the technical signal of a potential Wave C bottom offers an attractive Risk/Reward setup for LONG (Buy) positions. All eyes are now on the FED announcement tonight/tomorrow morning!
#XAUUSD #GOLD #FED #ElliottWave #TradingViewIndia #MarketUpdate What are your thoughts? Are you going Long or Short into the FED event? 👇

ElDoradoFx PREMIUM – GOLD ANALYSIS (29/10/2025, LONDON SESSION)1. Market Overview
Gold recovered strongly from 3,918 lows, printing a clean bullish reversal overnight during Asia, now trading near 3,990–3,998.
The market structure has shifted short-term bullish after a clear CHoCH and BOS, but price is testing heavy resistance at the psychological 4,000 level and the H1 supply zone (3,995–4,013).
London session opens at a decisive point — momentum favors buyers, but a rejection at 4,000–4,013 could trigger a short-term pullback before continuation.
⸻
2. Technical Breakdown
🔹 Daily (D1):
• Price bounced from 3,918 forming a bullish rejection candle.
• RSI turning upward near 50, showing recovery strength.
• Long-term uptrend intact above the 100 EMA (3,842) but short-term correction not complete.
✅ Bias: Neutral to bullish while above 3,918.
🔹 H1:
• Market showing a confirmed CHoCH above 3,965 with bullish momentum candles.
• Currently retesting the descending trendline and 200 EMA (4,000–4,013) zone.
• RSI near 58, MACD histogram positive but slowing — possible short-term exhaustion.
⚠️ Bias: Bullish but watch for rejection at 4,000–4,013.
🔹 15M–5M:
• Clear bullish wave with strong EMA alignment (8 > 20 > 50).
• Structure forming higher highs and higher lows.
• Minor divergence appearing near 3,998, indicating potential retracement to 3,965–3,955.
🎯 View: Buy pullbacks into key retracement zones.
⸻
3. Fibonacci Analysis (Swing 3,918 → 3,998)
• 38.2% = 3,972.6
• 50.0% = 3,958.6
• 61.8% = 3,945.0
🟩 Fibonacci Golden Zone: 3,958 – 3,945
Confluence: prior H1 resistance turned support + trendline retest zone.
⸻
4. High-Probability Trade Scenarios
🟩 Bullish Scenario (Primary Bias)
• Buy Zone: 3,972 → 3,958 (Golden Zone)
• Confirmation: Bullish engulfing or CHoCH on 5M
• Targets: 3,991 → 4,004 → 4,013 → 4,030
• Stop Loss: Below 3,945
• Notes: Structure remains bullish as long as 3,945 holds.
🟥 Bearish Rejection (Countertrend)
• Sell Zone: 4,004 – 4,013 (H1 Supply + EMA Confluence)
• Confirmation: Rejection candle / Bearish divergence
• Targets: 3,974 → 3,959 → 3,945
• Stop Loss: Above 4,020
⚡ Breakout Setup
• Buy Breakout: Above 4,013 (retest holds) → Target 4,030 → 4,070
• Sell Breakout: Below 3,945 → Target 3,918 → 3,904
⸻
5. Fundamental Watch
• No major UK data early; focus remains on USD Index (DXY 106.2).
• US 10-year yields stabilizing; if yields drop, gold could push above 4,000.
• Market sentiment cautiously bullish ahead of mid-week U.S. news.
⸻
6. Key Technical Levels
Type Levels (USD)
Resistance 3,998 / 4,004 / 4,013 / 4,030 / 4,074
Support 3,972 / 3,958 / 3,945 / 3,918
Golden Zone 3,958 – 3,945
Break Buy Trigger > 4,013
Break Sell Trigger < 3,945
⸻
7. Analyst Summary
Gold shows strong intraday bullish momentum but faces resistance at 4,000–4,013.
If London retraces to 3,972–3,958, this area becomes the Golden Opportunity Zone for continuation buys.
A breakout above 4,013 confirms trend reversal to 4,030–4,074.
Failure to hold 3,945 will re-expose 3,918 lows.
⸻
8. Final Bias Summary
Main Bias: Bullish
Secondary Bias: Short-term sell at 4,013 only if strong rejection
Golden Zone (Buy): 3,958 – 3,945
Breaking Price: Above 4,013 for buys / Below 3,945 for sells
London Outlook: Expect minor dip, then bullish continuation if support holds.

Gold Recovers 1000 Pips Ahead of FOMC: Key Levels in Focus📊 Market Overview
After a sharp selloff that shook long positions, Gold has rebounded nearly 1000 pips, recovering from the 388x area toward 398x ahead of the upcoming FOMC meeting.
Despite the short-term recovery, Gold remains down around 3.5% this week, reflecting cautious sentiment as traders reposition before the Fed decision and amid fading U.S.–China trade tensions.
Currently, price is trading near $3,980–3,990 during the Asian session, consolidating under the psychological $4,000 zone.
💎 Technical Outlook (H1–M15)
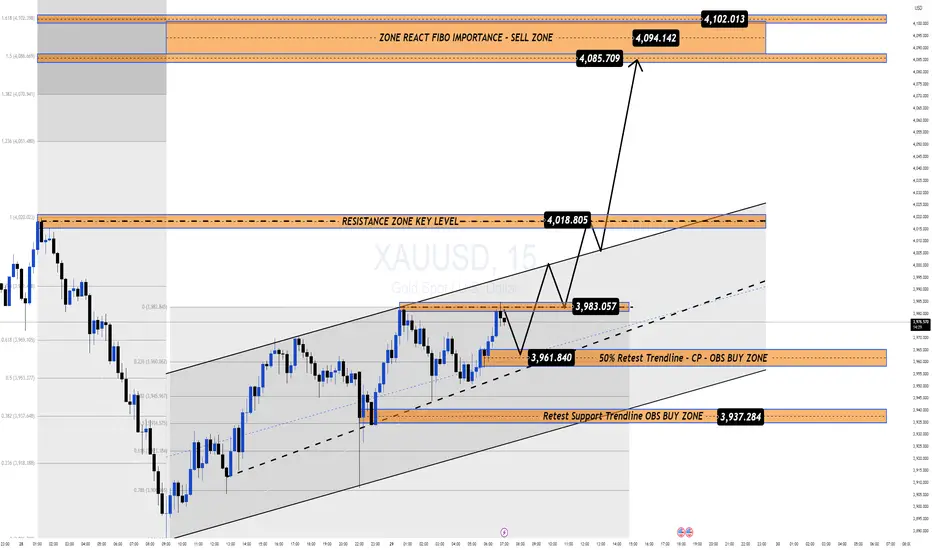
Gold continues to trade within a short-term ascending channel, forming a corrective recovery inside a broader downtrend.
Immediate Support Zones:
• 3,961 – 3,937 → Trendline retest & OBS Buy Zone
• 3,918 → Structural invalidation area
Resistance & Key Reaction Levels:
• 4,018 – 4,085 → Mid-term key resistance
• 4,094 – 4,102 → Major Sell Zone (Fibo 1.5–1.618 confluence)
📍If Gold breaks and holds above 4,018, momentum could extend toward 4,085 – 4,102, where strong selling pressure may reappear.
📍If the price rejects at 4,094 – 4,102, expect a corrective move back toward 3,961 – 3,937, aligning with the channel base and trendline retest.
🌍 Macro Context – FOMC Ahead
Markets expect the Fed to cut rates by another 25bps, following September’s “risk management” cut.
However, if Powell’s tone turns hawkish, Gold could face renewed downside pressure as rate-cut expectations fade, particularly for December.
Conversely, a cautious or dovish tone emphasizing inflation risks and slower growth could boost Gold above $4,100 in the short term.
Meanwhile, easing trade tensions between the U.S. and China and the ongoing equity rally may continue to limit safe-haven demand.
🧭 Summary
Gold is holding a short-term recovery bias, yet the medium-term trend remains fragile ahead of the FOMC.
Expect volatility around the 4,000–4,100 zone, with the Fed statement likely to set the next major direction.
🛡️ Stay patient — liquidity builds before clarity, and key reactions around $4,094–4,102 will reveal the next macro impulse.
Gold (XAUUSD) – 29 Oct | Key Supply Zone in Focus🟡 Gold (XAUUSD) Analysis – 29 October
Hello Disciplined Traders,
Welcome to the Chart Is Mirror Community 👋
Market Context
• Yesterday, Gold failed to hold the H4 demand zone (3976.8 – 3944.3) and the higher-low (HL) key zone .
• The breakout caused a clear H4 bearish structure shift (CHoCH) , confirming that both H4 and M15 are now in a downtrend.
• Market sentiment has shifted to bearish, with momentum favoring sellers.
Key Observations
• Currently, M15 is in a pullback phase , retesting the first supply zone + LH key level 4005 – 4020 .
• If the market respects this zone and prints a LTF structure shift confirmation , we will plan short setups accordingly.
• A M15 close above 4020 would signal a short-term bullish structure shift , suggesting the start of an H4 pullback.
• During this phase, cautious long setups may be considered only with strong confirmation — as pullback trades remain lower probability.
• The next potential supply zone lies at 4132 – 4163 ; if the lower zone breaks, price may pull back into this 50% + strong supply zone, where we’ll again look for short setups with confirmation.
Execution Plan
• Watch the 4005 – 4020 zone closely for bearish reaction and structure shift.
• If the zone is respected and LTF confirmation appears , we will execute our short setup accordingly .
• If price breaks above this zone, wait for new structure formation before considering any counter-trend long setups.
• Market volatility is high — manage position size and risk carefully .
Precision begins with patience — let confirmation lead your conviction.
📘 Shared by @ChartIsMirror

Gold Extends Decline Below $4,000 as Risk Appetite Returns🔍 Market Context
Gold continues to struggle amid renewed optimism around US–China trade talks.
The shift in sentiment has reduced safe-haven demand, while softer expectations of further Fed rate cuts keep the US Dollar capped — offering limited downside support for XAUUSD.
However, the technical landscape remains clearly bearish.
The break below the $4,000 handle confirms continuation of the downtrend first outlined in early-week plans.
📊 Technical Analysis
Structure: Gold maintains a clean bearish channel on the H1–H4 frame.
Immediate resistance: $3,985 – $4,000 (former support, now supply zone).
Target zones:
• Short-term liquidity area near $3,925–$3,930
• Extended target sits around $3,880–$3,860, aligning with Fibo 1.618.
Invalidation: Only a sustained break and hold above $4,020–$4,030 would neutralize this short-term bearish bias.
🎯 Trading Outlook
If gold retests the broken $4,000 zone and fails to regain it,
expect sellers to extend control toward $3,920 or lower ahead of the FOMC meeting.
That event may later define the next recovery point — but for now, momentum remains firmly on the downside.
⚜️ Summary
Gold’s recent slide isn’t random — it’s structural.
The market is rebalancing after excessive bullish sentiment,
and liquidity below $3,900 is likely to attract attention before any significant rebound.
Watch the reaction near $3,920–$3,880 —
that’s where the next meaningful decision for gold may emerge.
📊 MMFLOW TRADING Insight:
“Smart money doesn’t chase candles — it waits for liquidity to shift.”

StevenTrading – XAUUSD: Mid-Term Buy Bias StrategyStevenTrading – XAUUSD: Mid-Term Buy Bias Strategy | Anticipating Wave 5 and Trendline Retest at $3935
Hello everyone,
StevenTrading is back with a detailed analysis on Gold (XAUUSD).
Gold is currently consolidating above the $3,950 level, awaiting fresh momentum from the upcoming FOMC interest rate decision.
Structurally, the metal appears to be following the Elliott Wave 5-leg formation at this stage. The mid-term bias remains bullish, with a focus on entering around the trendline retest zone.
📰 1. MACRO CONTEXT & FUNDAMENTAL OVERVIEW
The Gold market remains largely driven by anticipation:
Current Status:
Gold is trading sideways above $3,950 as traders await clearer guidance on the Fed’s path towards potential rate cuts.
Psychological Barrier:
A decisive break above the $4,000 psychological threshold is required to confirm a sustainable bullish continuation.
This outcome will depend entirely on the tone and decision from the FOMC meeting.
📊 2. TECHNICAL ANALYSIS – ELLIOTT WAVE SCENARIO
Based on the H1 timeframe (see chart reference image_fa2a75.png):
Wave Structure:
Gold appears to be consolidating after completing Waves 3 and 4. The next move could see the formation of Wave 5, potentially completing the current cycle or confirming a new uptrend.
Ideal Buy Zone (High-Probability Area):
The $3,935–3,937 range represents a key confluence area. It aligns with the trendline retest zone and provides solid structural support for initiating long positions.
Short-Term Sell Zone:
The nearest resistance lies at $4,058–4,060, where short-term scalping or hedge positions could be considered.
🎯 3. TRADING PLAN (ACTION STRATEGY)
The primary focus remains on the Buy Continuation setup, aligned with the medium-term bullish correction.
🟢 Primary BUY Scenario
Entry Zone: $3,935 – $3,937
Stop Loss: $3,929 (tight SL recommended)
Take Profit:
TP1: $3,955 | TP2: $3,978 | TP3: $3,995 | TP4: $4,022 | TP5: $4,055
🔴 SELL Scalping / Hedge Scenario
Entry Zone: $4,058 – $4,060
Stop Loss: $4,066
Take Profit:
TP1: $4,045 | TP2: $4,022 | TP3: $4,005 | TP4: $3,968
🧠 4. SUMMARY & DISCIPLINE (Steven’s Note)
Gold stands at a critical juncture ahead of the FOMC announcement.
The buy-side scenario remains dominant, but maintaining discipline and risk control is essential.

The Ultimate GOLD & SILVER Outlook || 5 Trade Setups + FOMC UpdaWelcome to Trade with Decrypters!
📊 DETAILED & COMPLETE ANALYSIS (5 TRADE SETUPS) — Gold & Silver Outlook
1️⃣ Central Bank Buying
* Q1–Q2 2025 net: 410t (+15% YoY)
* August: +19t
* BRICS hold 6,000t (21% of global reserves)
* Top buyers: 🇵🇱 Poland +90t | 🇨🇳 China +35t
* Motive: USD hedge + BRICS 2026 currency prep
📈 Outlook: Sustained demand supports 10–15% long-term gold upside
2️⃣ ETF Inflows & Sentiment
* Q3 inflows: $26B | AUM $445B (+25% YoY)
* Holdings: 3,200t
* Asia: +37t | US: Neutral
* Gold RSI: 68 (Support: $3,800 | Resistance: $4,000)
* Silver RSI: 72 (Support: $32)
🎯 Projection: Gold → $4,000/oz (Q4, +1%) | Silver → $35/oz (+9%)
3️⃣ Macro & Geopolitical Events
* Fed cuts: 75bps → 3.75%
* USD: -8% | CPI: +3.2%
* Tariffs add +0.5% global inflation (→ 4.2%)
* BRICS trade pacts counterbalance USD weakness
* Gold already +57% YTD on 20% risk premium
📊 Outlook: Trade wars + Fed easing = 5–7% metals gain H1 2026
4️⃣ Silver Deficit
* 2025 deficit: 118M oz
* Supply: 1.02 Boz | Demand: 1.20 Boz
* Industrial share: 59% (EVs China +25%, Solar +30%)
* Recycling: 20%
📈 Projection: 150M oz deficit (2026) → Silver +15%
5️⃣ Futures & Options Flow
* CME Gold OI: 550k (+10% MoM)
* Silver OI: 180k (+8%)
* GVZ: 18%
* Call/Put ratio: 2:1 | Net long: 65k gold calls
📊 Outlook: OI rise + call bias = 20–25% vol breakout Q1 2026
🔮 Fundamentals & Forecast
* Gold: 450t CB buying + de-dollarization →
🎯 $4,200/oz (end-2025, +12%) | 🎯 $5,000 (2026)
* Silver: 118M oz deficit + 59% industrial →
🎯 $38/oz (end-2025, +18%) | 🎯 $60 (2026)
⚡ Drivers: Fed easing, 4.2% inflation, US deficit, BRICS shift → strategic metals outperformance
🏦 FOMC Update (Oct 29, 2025)
* Decision: 2:00 PM ET
* 98%+ chance of 25bps cut → 3.75–4.00%
* Powell press conference: 2:30 PM ET
* Dot plot & QT update expected
* Markets volatile → cut likely supportive for Gold, Silver, Stocks & Crypto
Disclaimer: This analysis is for educational purposes only. Not financial advice.

Elliott Wave Analysis – XAUUSD (October 29, 2025)
Momentum
• D1: Momentum remains compressed, but yesterday’s candle closed with a long lower wick — a clear sign of weakening downside pressure. A bullish daily close today would confirm a potential D1 reversal.
• H4: Momentum is preparing to turn down from the overbought zone, yet the current upward move is still weak. We need to monitor whether price can hold above the previous low once H4 momentum drops toward oversold.
• H1: Momentum is falling, but price is supported around 3953 and capped near 3994.
As long as price holds above 3927 and avoids breaking 3892, the next H4 oversold phase could confirm a stronger upside structure.
________________________________________
Wave Structure
• D1: The current decline equals 0.382 retracement of wave (3) yellow, a key Fibonacci level.
• H4: Wave (4) purple has already retraced 0.782 of wave (3) — unusually deep for a normal 4th wave (which typically stops around 0.382–0.5).
This suggests the ongoing correction may represent wave (4) yellow on the D1 timeframe.
If true, the market could now be forming wave W of a larger W–X–Y structure, meaning the upcoming recovery might only be a slow, overlapping X wave before another decline.
• H1: The 5-wave black structure seems completed.
A break above 3995, followed by a test of 4050, would confirm the end of wave (5) black and the start of a corrective move upward.
________________________________________
Summary
Price volatility is still high — avoid limit orders for now and watch how price reacts at key zones.
• 🔹 Support: 3953 – 3927 – 3892
• 🔹 Resistance: 3994 – 4050

Today's gold trading strategyPolicy expectations of "pseudo-loosening" hard to support gold prices
Although the market has priced in a 25 basis point rate cut by the Federal Reserve in advance, this expectation has shown obvious signs of loosening. On the one hand, although the core PCE inflation in the US has declined, it still remains above the 2% target. The president of the Dallas Federal Reserve has explicitly stated that "a single rate cut does not represent the start of a loosening cycle", suggesting that the subsequent policy will adopt a wait-and-see attitude. On the other hand, this rate cut is more of a "preventive adjustment" to the economic resilience rather than an emergency measure to deal with a recession, and it cannot be compared with the intensity of the 2020 loosening cycle. More importantly, although the US dollar index has temporarily retreated to around 98.6, it still holds the support of the 50-day moving average. Once the Federal Reserve sends a signal of "pausing rate cuts", the US dollar is likely to resume its upward trend, exerting a secondary pressure on gold prices.
Today's gold trading strategy
sell:3970-3980
tp:3960-3950
sl:3990

XAUUSD | Gold to drop 2000PIPS, where is the best sell zone?🔍 Market Context
After breaking the medium-term uptrend structure at the main Trendline , gold has formed a clear sequence of Lower High – Equal Low (EqL) , indicating a phase shift from bullish to bearish.
Currently, the price is fluctuating around the 3,960–3,970 USD zone – this is a temporary liquidity accumulation area before heading up to retest the resistance at 4,015–4,050 USD , which was previously a Demand Zone now turned into a Supply Zone .
If a strong bearish reaction occurs here, it is highly likely that the price will extend its decline towards the Order Block 3,945–3,960 USD zone, or even deeper to the Premium Zone 3,884 USD .
💎 Key Technical Structure
Main Trendline: broken, confirming a structure change (ChoCH).
Resistance Zone: 4,010–4,015 → quick reaction resistance.
Supply Zone: 4,043–4,060 → strong technical pullback zone.
Premium Zone: 3,884–3,900 → discount zone, potential temporary bottom.
📈 Trading Scenarios
1️⃣ SELL Zone 1 – Scalp Reaction at Resistance Zone
Entry: 4,010 – 4,015
SL: 4,025
Take Profit : 4,005 - 3,995 - 3,975 - 3,965 - Open
➡️ Quick scalp reaction at nearby resistance – suitable for London/NY session trading.
2️⃣ SELL Zone 2 – Major Retest at Supply Zone
Entry: 4,043 – 4,060
SL: 4,065
Take Profit : 4,050 - 4,040 - 4,030 - 4,020 - 4,010/Open
➡️ Main setup – retest of supply zone confluencing with broken trendline, high probability if strong rejection on H1/H4.
3️⃣ SELL Continuation – Break & Retest below 3,945 USD
Entry: 3,945 – 3,950
SL: 3,965
TP: 3,884
➡️ Setup breaks EqL bottom confirming downtrend continuation, targeting Premium Zone.
4️⃣ BUY Setup – Reversal at Premium Zone 3,900 USD
Entry: 3,900
SL: 3,880
TP1: 3,910 - 3,920 - 3,930 - 3,940 - 3,950/Open
✅ Condition:
Only buy when a strong reaction candle appears (long-tail rejection / ChoCH bullish on M15–H1).
➡️ This is the final discount zone before major capital can return to the market – technical reversal setup, low risk / high reward.
⚠️ Risk Management
Prioritize SELL at supply zones, BUY at Premium – avoid trading mid-range.
Reduce volume in scalp setup (Sell 1).
If price closes above 4,070 → short-term downtrend is invalidated.
💬 Conclusion
Gold remains under short-term bearish pressure, however, the 3,884–3,900 USD zone could act as strong support.
The suitable strategy is to capitalize on the two resistance zones for Selling and observe technical Buying at the Premium bottom.
👉 Comprehensive Strategy:
Sell 4,010–4,015 | SL 4,025 | TP 4,005 → 3,965 🎯
Sell 4,043–4,060 | SL 4,065 | TP 4,050 → 4,010 🎯
Buy 3,900 | SL 3,880 | TP 3,910 → 3,950 🎯
🔥 “Trade with patience, react at precision zones — that’s how consistency is built.”
⏰ Timeframe: 1H
📅 Update: 28/10/2025
✍️ Analysis by: Captain Vincent

Gold price analysis October 29✳️ XAUUSD Update – 29/10
The early Asian session saw some buying pressure, but the overall trend is still unclear. The 4015 zone is currently acting as an important resistance – buyers need to break this zone decisively to expect the uptrend to be restored.
On the contrary, if the price continues to be rejected at 4014–4015, there is a high possibility that the downtrend will be extended and the price may return to test deeper support zones around 383x.
📉 Trading strategy:
SELL when the price rejection signal appears at the 4014 zone
Target: 3930
If the price closes above 4015, switch to the BUY plan following the uptrend.

Gold Price Outlook – Trade Setup (XAU/USD)📊 Technical Structure
Gold price (XAU/USD) is trading near $3,965, with the upside capped at the $3,981–$3,990 resistance zone. The chart shows a recent rejection at resistance and sellers stepping in. Unless bulls break above $3,990, the bias remains bearish with a retest of $3,923–$3,915 support zone likely.
🎯 Trade Setup
Entry: $3,81–$3,989 (near resistance)
Stop Loss: $3,993
Take Profit: $3,930 / $3,915
Risk-Reward Ratio: ≈ 1 : 4.53
🌐 Macro Background
Gold is under renewed pressure as US–China trade optimism undermines safe-haven demand. U.S. President Trump said a trade deal with China could be finalized this week, which boosted market sentiment. As Kitco’s senior analyst Jim Wyckoff noted: “The U.S.-China trade tensions have really diminished, with a possible trade deal later this week after a summit meeting between Presidents Xi and Trump. That’s bearish for safe-haven metals.” 【FXStreet】
On the monetary policy side, the Federal Reserve is expected to cut interest rates by 25 bps, lowering the Fed Funds Rate to 3.75%–4.00%. CME’s FedWatch tool shows markets have priced in nearly a 100% probability of this move, with further easing expected in December. While this provides some support to gold, trade optimism currently outweighs Fed dovishness.
🔑 Key Technical Levels
Resistance: $3,981 – $3,990
Support: $3,923 – $3,915
Psychological Level: $4,000
📌 Trade Summary
Gold remains capped below $3,990 and is at risk of further declines toward $3,930–$3,915. Short positions near resistance are favoured, unless Fed surprises with a deeper cut or US–China trade talks collapse, which could flip sentiment.
⚠️ Disclaimer
This analysis is for reference only and does not constitute trading advice. Trading involves significant risk, and proper risk management is essential.

GoldXAUUSD
- Bearish Channel as an corrective pattern in Short Time Frame
- Break of Structure
- Completed " 12345 " Impulsive Waves
- Order Block
- Change of Characteristics

Gold Analysis: Price action is back... Revised Gold Market Analysis (XAU/USD)
1. Current Market Situation
Your technical view remains sharp. The market has seen a significant break below the major psychological level of $4,000 per ounce. It is currently consolidating in the $3,940 - $3,980 range, attempting to find its footing after this major drop.
This pullback has been driven by short-term fundamental factors, primarily a reduction in "safe-haven" demand due to easing US-China trade tensions and significant profit-taking.
2. The Critical Resistance Zone: $4113
Your identification of $4113 as the key resistance is a crucial correction. This level isn't just a minor pivot; it's a major structural ceiling, likely representing a recent high or a significant reversal point.
The $4,000 - $4,018 area, which was just broken, now acts as the first minor hurdle, but $4113 is the true test of the bullish trend.
Your Scenarios:
Scenario 1: Rejection (Your "Hard to Go Up" Thesis) You are correct. If gold attempts a rally from its current price but fails to reclaim the $4113 level, it will be a powerful bearish confirmation. This failure would signal that the recent break below $4000 was not a small correction but the start of a much deeper move, with **$3770** as the logical target.
Scenario 2: Breakout (Your "Return to Previous Rate" Thesis) This is the long-term bullish-continuation scenario. If the price can stabilize, build momentum, and eventually push back above $4113, it would invalidate the entire recent sell-off. This would prove the drop was just a deep pullback, trapping short-sellers and signaling a strong move to new, higher records.
3. The Powerful Support Zone: $3,770
Your identification of "377" (the $3,770 area) remains the most critical support floor. This is a major structural level that everyone is watching.
Key Moving Average: This zone aligns perfectly with the 50-day moving average (approx. $3,767), a key dynamic support level for institutional traders.
Structural Lows: It also lines up with other identified pivot points (e.g., $3,830 and $3,754) and the 1-month low.
A decisive break below this $3,770 zone would be a very serious bearish development, signaling a potential medium-term trend change.
4. Key Fundamental Drivers (The "Why")
The technicals are being driven by a powerful "tug-of-war" between opposing fundamental forces:
Bearish Pressure (Short-Term):
Geopolitics: Optimism around US-China trade talks is pulling money out of safe havens like gold and into "risk-on" assets like stocks.
Profit-Taking: After a historic rally, many large funds are selling to lock in massive profits.
Bullish Support (Long-Term):
Federal Reserve Policy: This is the most important factor. The market has priced in a ~96% probability of a Fed interest rate cut today (October 29). Lower interest rates make non-yielding gold more attractive.
U.S. Dollar: Fed cuts tend to weaken the US Dollar, which makes gold (priced in USD) cheaper for international buyers.
Central Bank Buying: Global central banks continue to be massive buyers of gold, providing a strong, consistent baseline of demand.

ElDoradoFx PREMIUM – GOLD ANALYSIS (29/10/2025, ASIA SESSION)Gold (XAUUSD) closed the US session near 3,950 after rejecting from the descending trendline and the intraday 200EMA cap around 3,960–3,970.
The current structure shows a corrective rebound inside a broader bearish leg, with D1 still pointing down but short-term exhaustion visible around 3,885–3,900.
Asia opens with minor consolidation below resistance, setting the stage for either a continuation breakdown or a temporary pullback to 3,970–3,990 before sellers re-enter.
⸻
2. Technical Breakdown
Daily (D1)
• Still in a clear corrective phase after failing to hold 4,100–4,140 resistance.
• Price now hovering above the 100-day EMA at 3,842, which acts as medium-term support.
• RSI at 47 – neutral but with downside pressure.
Bias: Bearish while below 3,996; looking for retracement sell setups.
⸻
1H Chart (H1)
• Price rejected from descending trendline near 3,970–3,980.
• Currently consolidating near 3,950, with structure forming a wedge under the 50EMA and 200EMA.
• MACD histogram turning flat, RSI recovering from 27 → 45 range.
Bias: Neutral-to-bearish; a rebound toward 3,970 may offer short opportunities.
⸻
15M Chart (M15)
• Micro bullish correction from 3,886 → 3,960, now forming lower highs.
• Momentum fading near 200EMA (3,955–3,960).
• RSI oscillating around 50; MACD decreasing – indicating loss of short-term momentum.
View: Expect a liquidity sweep into 3,970–3,985, then potential sell reaction.
⸻
5M Chart (M5)
• Tight consolidation between 3,948–3,960; lower timeframe CHoCH visible.
• EMA stack is compressing, hinting at volatility buildup.
• A clean break below 3,945 could trigger a new push to 3,920/3,900.
Short-Term View: Scalpers may watch for fake-out above 3,960 or breakout below 3,945.
⸻
3. Fibonacci Analysis (Last Swing: 4,019 → 3,886)
• 38.2% = 3,936
• 50% = 3,952
• 61.8% = 3,967
✅ Golden Zone = 3,952 – 3,967 → current price zone (high confluence).
⸻
4. High-Probability Trade Scenarios
🟥 Bearish Continuation (Primary Bias)
• Sell Zone: 3,952 – 3,970 (Fibonacci + 15M EMA confluence)
• Trigger: Bearish engulfing or 5M structure break below 3,945
• 🎯 Targets: 3,925 → 3,905 → 3,886 → 3,860
• 🛑 SL: Above 3,975–3,980
⸻
🟩 Bullish Reversal (Countertrend)
• Buy Zone: 3,910 – 3,920 (intraday demand)
• Trigger: Clear 5M CHoCH + bullish engulfing
• 🎯 Targets: 3,940 → 3,955 → 3,970
• 🛑 SL: Below 3,900
⸻
5. Fundamental Watch
• Asia session quiet — focus remains on USD and US yields after yesterday’s strong data.
• DXY remains elevated near 106.20 → limits upside on gold.
• Traders should anticipate low volatility early, followed by possible retracement during London buildup.
⸻
6. Key Technical Levels
Type Levels (USD)
Resistance 3,952 / 3,970 / 3,985 / 3,996
Support 3,930 / 3,910 / 3,886 / 3,860
Golden Zone 3,952 – 3,967
Break Sell Trigger <3,945
Reversal Trigger >3,970
⸻
7. Analyst Summary
Gold remains trapped below major EMA resistance and inside a corrective wedge.
The Golden Zone (3,952–3,967) aligns perfectly for fresh sell entries if momentum confirms.
Unless bulls reclaim 3,980+, the probability favors continuation toward 3,910 → 3,886.
Preferred Strategy:
Sell retracement from 3,952–3,970 (with confirmation).
If price breaks 3,945 → sell continuation.
Avoid buys unless 3,970 breaks and holds.
⸻
8. Final Bias Summary
Primary Bias: Bearish
Secondary Bias: Countertrend buy only from 3,910 support
High-Probability Zone: 3,952 – 3,967
Breakout Confirmation: Sell below 3,945
Invalidation: Above 3,980
⸻
🥇 ElDoradoFx PREMIUM 3.0 – PERFORMANCE 28/10/2025 💸
📊 Precision entries. Consistent gains.
━━━━━━━━━━━━━━━
🟢 BUY LIMIT +45 PIPS
🟢 BUY +80 PIPS
🟢 BUY +30 PIPS
🟢 BUY +90 PIPS
🟢 BUY +110 PIPS
🔻 SELL +60 PIPS
🟢 BUY +110 PIPS
📱 BTC BUY +600 PIPS
━━━━━━━━━━━━━━━
🏆 GOLD TOTAL: +525 PIPS
🪙 BTCUSD BONUS: +600 PIPS
💰 TOTAL DAILY PROFIT: +1,125 PIPS
📊 8 Signals → 8 Wins | 0 SL
🎯 Accuracy: 100% ✅
━━━━━━━━━━━━━━━
🔥 Flawless day! Every setup hit target with precision — GOLD and BTC both in perfect sync.
👏 Congratulations if you profited! ✅✅✅🚀🚀🚀

GOLD: Bullish, But Retracing! Short Term Sell Opportunity!In this Weekly Market Forecast, we will analyze the Gold (XAUUSD) for the week of Oct. 27 - 31st.
Gold is still bullish, the current pullback it's in notwithstanding. Waiting patiently for valid buy setups is the sure way to go.
That being said, there is sell setup that could present an short-term opportunity. The Daily -FVG is currently holding price in check. Should price return to it and it continues to hold, a valid sell opportunity could present itself.
Be careful, as it is counter-trend. They can be lower-probability.
Enjoy!
May profits be upon you.
Leave any questions or comments in the comment section.
I appreciate any feedback from my viewers!
Like and/or subscribe if you want more accurate analysis.
Thank you so much!
Disclaimer:
I do not provide personal investment advice and I am not a qualified licensed investment advisor.
All information found here, including any ideas, opinions, views, predictions, forecasts, commentaries, suggestions, expressed or implied herein, are for informational, entertainment or educational purposes only and should not be construed as personal investment advice. While the information provided is believed to be accurate, it may include errors or inaccuracies.
I will not and cannot be held liable for any actions you take as a result of anything you read here.
Conduct your own due diligence, or consult a licensed financial advisor or broker before making any and all investment decisions. Any investments, trades, speculations, or decisions made on the basis of any information found on this channel, expressed or implied herein, are committed at your own risk, financial or otherwise.

Gold (XAU/USD) - Bearish Reversal and Potential ContinuationPrior Uptrend: The chart clearly illustrates a strong, sustained uptrend from late September to mid-October, where the price rose consistently, making higher highs and higher lows.
Market Structure Shift (MSS): Around October 21-23, the price broke decisively below a significant previous low (the swing low marked by the MSS line, near $4,040). This event signals a likely change in market character or a Market Structure Shift, suggesting the uptrend is over and a downtrend has begun.
Impulsive Down move: Following the MSS, the price fell sharply.
Fair Value Gap (FVG): The chart highlights a Fair Value Gap (FVG), which is an area of price inefficiency created during the sharp move down. This gap acts as a potential magnet or resistance zone. The price is currently near the bottom of this FVG area (around $3,930 - $3,960).
Current Price Action and Bias: The overall sentiment is bearish following the MSS. The analysis suggests the price may retrace higher into the FVG (the dashed arrow indicates a possible move into the FVG) before continuing its move lower.
Target: The TARGET is marked by a dashed horizontal line around $3,870 - $3,880. This suggests a specific price level the analyst expects the price to reach if the bearish continuation plays out.
Interpretation
This chart suggests a bearish trading opportunity based on the recent change in trend. The immediate plan seems to be to watch for a reaction within the FVG for a potential entry to short Gold, aiming for the $3,870-$3,880 target.

Why am I bearish when the market is bullish?#XAUUSD TVC:GOLD OANDA:XAUUSD
We have reminded everyone today that you can short gold in batches at key points, and now all short positions have been exited. When entering the market, it depends on the technology; when leaving the market, it depends on the mentality. Don’t be dominated by fear and greed. Profits belong to you only when you really get them in your hands. Otherwise, everything is just empty talk.
Short-term bears should not continue to participate blindly. By observing the hourly line trend, we can find that this is a typical upward trend. Therefore, bulls may still have a certain rebound momentum in the short term. But it should also be noted that there is pressure from the golden section point of 38.2%, or 3975, and it is also close to the downward trend line. Therefore, for evening trading, I think we can continue to be patient and wait, observe the performance of 3975-3990, and then consider appropriately participating in shorting gold after there is obvious pressure but it is not broken.

GOLD H1 OUTLOOKH1 Gold Looking Bearish Structure
Selling First Zone Of FVG
Sllibg Second Zone Of CISD
Target Old Low / Sell Side Liquidity
Stay Tuned Boost The Post And Follow Us

Gold Faces Wave 5 Danger: Prepare for a Sharp Drop AheadAt yesterday’s opening, gold dropped sharply, breaking the bullish structure. Today, the decline continued, and the gap near 3887 was successfully filled before the price rebounded toward the 3975 resistance area. The strong resistance remains around 4000–4018.
On the daily chart, the trend remains downward, with support at 3963 already broken. Although the price is now recovering, upside resistance remains dense. From a structural perspective, the movement now aligns with a five-wave decline pattern, and the market appears to be in wave 4’s rebound phase. Therefore, it’s crucial to monitor the resistance area closely — if the price fails to break and hold above it, be prepared for the onset of wave 5, which could drive prices down to around 3800.
On the weekly chart, there is potential support near 3834, but keep in mind that wave 5 declines are often stronger and faster than wave 3, meaning this support could be broken.
In summary, trade cautiously and make account safety your top priority.

XAU/USD: Bullish Rally to 4225?OANDA:XAUUSD is priming for a bullish rally on the 1-hour chart , with price pulling back to a critical support zone after a sharp decline, forming a potential reversal point as buyers defend against further downside amid overall uptrend signals. This setup highlights a classic dip-buy opportunity near the confluence of support and recent lows.
Entry zone between 4007-4037 for a long position. Target at 4225 near the resistance zone for attractive upside potential. 📊 Set a stop loss on a close below 3991 to manage risk effectively. 🌟 Keep an eye on confirmation through a bullish engulfing pattern or increased volume pushing above the entry, leveraging gold's volatility in response to USD movements.
Fundamentally , today's US Initial Jobless Claims and Existing Home Sales data could introduce volatility to gold and the dollar—Jobless Claims are forecasted at around 233K, while Existing Home Sales are expected near 4.00M, potentially strengthening USD if figures beat expectations and pressuring gold prices. 💡
📝 Trade Plan:
✅ Entry Zone: $4,007 – $4,037 (buy zone near support)
❌ Stop Loss: Close below $3,991
🎯 Target: $4,225 (resistance zone / take-profit area)
💎 Risk-to-Reward: More than 1:4, offering a strong technical edge.
What's your outlook on this trade? Share below! 👇

28/10/68 : XAUUSD ( US Session )Using it from US Session until 11.00AM , I'll new analysis and update at 12.00PM
Resistance
3947-3953
3936-3942
3930
Support
3918
3907-3912
3896-3901
