XAUUSD Forming Ascending TriangleXAU/USD (Gold) is building a very constructive technical structure, forming a tightening rising-triangle (or ascending triangle) on the daily chart. The upper trendline is acting as resistance, while the lower trendline is offering steady support. This compression suggests that a breakout is imminent: if gold clears the upper boundary with strength, it could trigger a significant bullish continuation.
On the macro and fundamental side, gold remains well supported by dovish expectations around U.S. monetary policy, persistent geopolitical uncertainty, and safe-haven demand. Real yields in the U.S. have been under pressure, giving non-yielding assets like gold greater appeal as a hedge. In addition, inflation concerns have not fully subsided, which could continue to drive interest in gold as an inflation play.
From a market dynamics perspective, central banks’ ongoing purchases of physical gold and ETF inflows are likely contributing to the higher-timeframe bullish bias. These flows, combined with tight technical structure, suggest that buyers are positioning for a fresh leg higher. If this breakout plays out, gold’s next target could push toward new nominal highs or record-equivalent levels, depending on momentum.
In terms of strategy, a long entry makes sense on a daily close above the upper trendline, ideally with a retest of that breakout as confirmation. A tight stop could be placed just below the triangle’s lower trendline to manage risk. If executed well, the upside could be very attractive, given gold’s macro fundamentals and the strength of its structural setup.
Xauusdanalysis

XAUUSD BUYI expect Gold to push to the upside from Price action shown on the chart. Gold breakout and expecting pullback and rally toward above Fair value gap and Supply zone above.

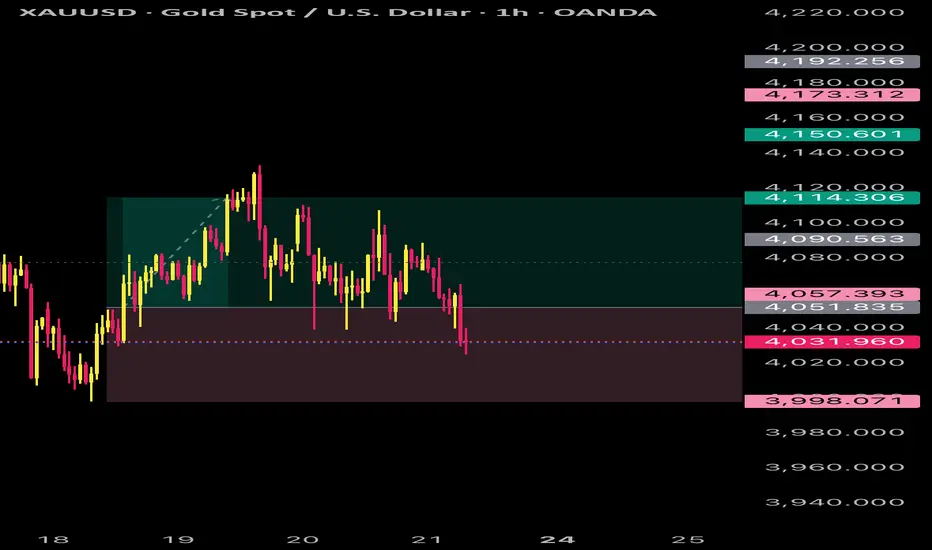
Gold (XAU/USD) 4H: SBR and Order Block RetestPrevious Uptrend: Price made a substantial move up, peaking around 4,225 USD.
Impulsive Down Move (X): A strong bearish move occurred from the high, indicating a potential change of character (CHoCH) or market reversal. This rapid decline is labeled with X.
Support/Resistance Flip (SBR): The price initially broke below a previous Support level (SBR), which now seems to be acting as Resistance in the current consolidation phase. This is a classic Support Broken, now Resistance flip.
Swing Low (S): The most recent Swing Low is marked with S, establishing a new range low after the reversal.
Consolidation/Correction (CRT-L, CRT-H): The price is now trading within a range defined by CRT-L (Current Range Top/Low) and CRT-H (Current Range High/Low), which is the current low of the corrective structure.
Order Block (OB): A crucial area is the Order Block (OB), which typically represents an area where significant institutional selling pressure entered the market, causing the impulsive drop. This area often acts as a key supply zone.
Anticipated Move: The curved arrow suggests a likely scenario where the price reaches up to test the Order Block (OB) and the SBR area before potentially continuing the move down towards the range low (CRT-H) or even lower, consistent with the recent shift to a bearish bias. This is an expectation of a correction/pullback into supply followed by a continuation of the trend.

XAU/USD – Inverse H&S Forming, Gold Eyes Bullish Reversal🔍 Market Context
Early today, Gold dropped nearly 70 points, but immediately rebounded strongly from 4040, signaling aggressive BUY interest and a clear rejection of downside continuation.
On the H2 chart, XAU/USD is shaping a clean Inverse Head & Shoulders pattern — a classic reversal structure that often precedes a strong bullish expansion.
The macro layer for today is packed with high-impact catalysts:
📌 Key Data & Events – 20 Nov
Speech by U.S. President Donald Trump
Barkin (2027 FOMC voter) speaks on economic outlook
Federal Reserve FOMC Meeting Minutes
Williams (permanent FOMC voter) speech
U.S. Unemployment Rate
Non-Farm Payrolls (NFP)
Initial Jobless Claims
➡️ A heavy news lineup capable of triggering high volatility and validating (or rejecting) the reversal pattern.
📊 Technical Analysis – MMF View
Gold bounced sharply from BUY ZONE 4044–4046 with strong volume.
The market structure is creating a complete Inverse H&S formation.
The Neckline Zone 4101–4111 is the key breakout level — clearing this zone opens the door for a full bullish reversal.
Trendline compression + liquidity sweeps show buyers gaining control.
Strategy for today: BUY bias. SELL only for quick scalps.
🎯 MMF Daily Trading Plan
BUY (Priority Setup – Swing / Intraday)
Buy 4046–4048
SL: 4039
TP: 4060 → 4085 → 4100 → 4125
✔️ BUY aligns with the reversal pattern + fresh liquidity shift.
SELL (Scalping Only)
Sell 4146–4148
SL: 4154
TP: 4132 → 4120 → 4110
✔️ SELL only if price taps liquidity at upper supply and rejects clearly.
⚠️ Key Levels to Watch
4101 – 4111 – 4142 → liquidity clusters + breakout confirmation
4029 → major support in case volatility spikes from news
🧠 MMFLOW TRADING Outlook
If Gold holds its corrective pullback and breaks above the Neckline (4101–4111), we may see a strong continuation toward:
4146 → 4187 → 4210+
The Inverse H&S on H2 is a powerful bullish setup — smart positioning favors building long exposure and holding into high-impact events.

XAUUSD PROFITABLE Gold had behaved accordingly and hit take profit, next move can be to wait and relax for it to play out before executing
Gold H1 – Is This Just a Range or a Break Incoming?🟡 XAUUSD – Intraday Smart Money Plan | by Ryan_TitanTrader (21/11)
📈 Market Context
Gold continues to trade inside a compressed intraday range as markets react to the latest discussion on whether the Federal Reserve is likely to cut interest rates anytime soon.
According to new reports, policymakers remain cautious, and early rate-cut expectations are fading as inflation progress slows.
This shift pushes USD stronger, increases Treasury yields, and temporarily weakens gold’s bullish momentum.
Key takeaways from the news:
• Fed officials note that inflation is “still not where it needs to be,” reducing the probability of early rate cuts.
• Markets have scaled back expectations for a Q1 cut, keeping USD supported.
• Higher yields → tighter financial conditions → gold struggles to break premium levels.
• Institutions are likely engineering liquidity grabs on both sides before committing to a new directional move.
Price is currently sitting near the 4030–4045 zone, right above discount liquidity, waiting for a catalyst to break out of the short-term compression.
🔎 Technical Analysis (1H / SMC Structure)
• Market Structure:
Gold has completed a clear CHoCH + short-term bearish sequence and is now compressing into the discount zone around 4030.
• Premium Sell Zone (4H Supply):
4128–4130 aligns with unmitigated supply + buy-side liquidity resting above internal highs.
• Discount Buy Zone:
4030–4028 sits inside the last clean demand zone where a previous sweep occurred.
• Liquidity Map:
→ Buy-side liquidity: above 4128–4135
→ Sell-side liquidity: below 4028–4020
Institutions are likely to sweep one side before delivering direction.
🔴 Sell Setup (Premium Reaction Zone)
• Entry: 4128 – 4130
• Stop-Loss: 4140
• Take-Profit:
→ 4080 (minor imbalance fill)
→ 4045 (range EQ)
→ 4030–4028 (discount demand retest)
📌 Execution rule: Wait for liquidity sweep into the zone + bearish CHoCH on M5–M15 before entering.
🟢 Buy Setup (Discount Reaction Zone)
• Entry: 4030 – 4028
• Stop-Loss: 4020
• Take-Profit:
→ 4060 (short-term reaction level)
→ 4095 (inefficiency fill)
→ 4120 (premium retest)
📌 Valid only if price sweeps the 4030–4028 pocket and shows bullish displacement from discount.
⚠️ Risk Management Notes
• USD strength may spike unexpectedly as rate-cut bets fade — reduce position size during volatility.
• Avoid trading inside the 4045–4085 chop zone unless a clean structure break forms.
• Manage trades aggressively once liquidity levels are taken.
• Expect engineered manipulation during low-volume Asian hours.
📝 Summary
Gold is compressing inside a narrow intraday range as markets reassess the likelihood of Fed rate cuts.
SMC structure suggests a two-sided liquidity sweep before a decisive move:
• Sell Zone: 4128–4130 (premium supply)
• Buy Zone: 4030–4028 (discount demand)
Expect classic accumulation → sweep → displacement patterns until macro conditions create a new trend.
📍 Follow @Ryan_TitanTrader for more Smart Money updates.

Gold - This bullrun is now over!🚨Gold ( TVC:GOLD ) won't create new highs:
🔎Analysis summary:
All the way back in 2019, Gold confirmed its rounding bottom formation. This breakout was then followed by a major rally of about +200% over the past couple of years. But at this moment, Gold is retesting a major resistance trendline and will therefore end its bullrun.
📝Levels to watch:
$4,200
SwingTraderPhil
SwingTrading.Simplified. | Investing.Simplified. | #LONGTERMVISION

Elliott Wave Analysis XAUUSD – 21/11/20251. Momentum
D1:
The D1 momentum is contracting, signaling a potential reversal. If today’s candle confirms this, it will further support the continuation of wave Y.
H4:
H4 momentum has turned downward, so the expectation for today remains bearish movement.
H1:
H1 momentum is preparing to turn upward, suggesting a small corrective bounce. However, in the current context, price is likely to remain sideways within the 4046 – 4081 range.
________________________________________
2. Wave Structure
D1 – Higher timeframe
With D1 momentum preparing to turn down, the continuation of wave Y is reinforced.
But since momentum is near the oversold zone, two potential scenarios may unfold:
1️⃣ Strong decline:
A sharp drop may break 3888, opening the way toward deeper targets such as 3746.
2️⃣ Weak decline – Compression:
Price may continue down but fail to break 3888.
Once momentum turns upward again, a new trend could form.
________________________________________
H4 – Pattern outlook
The H4 structure remains unclear—price may still be in wave (3) or wave (2).
• If it is wave (3), strong bearish candles or a test of 4001 should appear.
• If price keeps moving sideways without breaking 4001 until H4 momentum reaches oversold, the current move is likely wave B of an ABC correction inside wave 2.
Based on the current depth of wave B, wave C is estimated to target 4175.
________________________________________
H1 – Lower timeframe
Wave 2 (green) is taking longer than ideal, but not enough to invalidate the current labeling.
The 4081 resistance is very strong and serves as our sell zone.
Below, the 4020 support is equally important:
• A sharp decline with H1 closing below 4020 may trigger a larger bearish continuation.
• Typically, price reacts with a bounce when it first touches this area.
________________________________________
3. Trade Plan
Sell Zone: 4073 – 4075
SL: 4093
TP1: 4020
TP2: 3958
TP3: 3885

XAUUSD | Prices Await Catalyst from NFPGold Price Technical Analysis (XAU/USD) 🛠️
Gold is currently trending downward (depreciating), but is expected to find strong support near key levels.
1. Bearish Scenario ⬇️
Initial Key Support: Any further decline is likely to find decent support near the 200-period Exponential Moving Average (EMA), currently pegged around $4,018.
Psychological Critical Point: The weekly low, just below the psychological $4,000 mark.
Downside Target: A break below $4,000 could accelerate Gold's decline towards:
- Support at $3,931.
- Retesting the late-October low around $3,886.
2. Bullish Scenario ⬆️
Immediate Hurdle: The Asian session high around $4,110 could act as initial resistance.
Upside Trigger: Continued buying beyond the overnight high, around $4,120, will be seen as a new trigger for bullish traders.
Upside Target: A confirmed uptrend will lift Gold prices towards the next relevant hurdle near the $4,152-$4,155 region.
Ultimate Goal: A further move above will pave the way for a recapture of the $4,200 round figure.

Brian here with the gold outlook for November 20th Good morning everyone, Brian here with the gold outlook for November 20th. The ABC correction phase of gold is nearly complete, and the market is preparing to enter a new wave phase amidst a flurry of USD data today.
Fundamental Analysis
Today's focus remains on the US labor data: NFP (or revisions), Unemployment Rate, and Initial Jobless Claims.
If the data shows a cooling labor market, expectations for the Fed to soon pivot to a rate-cutting cycle will rise, weakening real yields, putting pressure on the USD, and supporting gold prices.
Conversely, "too good" data will strengthen the dollar, allowing for a short-term repricing move, potentially dragging gold down to lower liquidity zones before recovering.
US session liquidity may be thin before the news release, making it prone to spikes due to algorithms and large flows simultaneously adjusting positions.
Overall, the macro backdrop still favors "buying the dip" for gold, but you must accept strong volatility around news time.
Technical Analysis
On the chart, gold has completed an ABC corrective wave within a descending channel, part of a larger uptrend.
The current descending channel only serves as a corrective leg after the previous upward wave; prices are trading above the "mean" area of the bullish structure, indicating the larger market structure remains bullish.
Below is the liquidity zone / demand zone 4013–4015, coinciding with the previous low and the lower channel boundary – if there's another stop-hunt to this area, it is still considered an opportunity to join the upward move, as long as 4008 is not breached.
Above, the 4086–4100 cluster is the decision zone: breaking and holding above here will confirm exiting the corrective channel, triggering an impulsive leg towards resistances 4132–4146 and further to 4187.
In summary, the main bias remains bullish, prioritizing buy strategies at support zones or after breakout confirmation.
Key Price Levels
Resistance: 4086 – 4100 – 4110 – 4132 – 4146
Support: 4040 – 4030 – 4015
Trading Scenarios
Buy Scenario 1 – Continuation Breakout
Entry: 4086
SL: 4078
TP: 4100 – 4120 – 4140
Prioritize when price breaks up and retests 4086–4100 as a new support zone, confirming exit from the descending channel.
Buy Scenario 2 – Deep Liquidity Sweep
Entry: 4015–4013
SL: 4008
TP: 4030 – 4045 – 4070
Watch for strong price reactions at the demand zone, with pin bars or engulfing candles signaling order flow returning to buyers.
Sell Scenario – Sell Reaction at Strong Resistance
Entry: 4144–4146
SL: 4151
TP: 4132 – 4120 – 4100
Short-term sell strategy, leveraging the high supply zone if price rises straight up without sufficient accumulation.
The medium-term upside target if the bullish wave develops as expected remains the 4187 area.
What do you think of this scenario? Remember to follow Brian for daily gold insights and comment your views below to join the discussion.

Gold 4H Breakdown: Supply Rejection Signaling Deeper Sell-Off📉 XAU/USD Trading Plan – Bearish Setup
(Based on 4H supply/demand structure, fib confluence, and distribution signals)
📌 Bias: Bearish
Gold is showing signs of distribution, rejecting multiple supply zones and forming a lower high after a fake CHoCH. The overall structure suggests a potential move into deeper demand.
🟥 Trade Idea: Short Position
🔸 Entry Zone (Sell Area):
4,090 - 4110
Price has rejected this zone several times and aligns with 38.2%–50% fib + mid-range supply.
🔸Stop-Loss (Invalidation):
Above 4,140
Placed above the 50.0% retracement and the key supply zone.
If price breaks this level, the bearish setup is invalidated.
🎯 Take-Profit Targets
TP1 – Conservative Target
4,003 – 3,976
23.6% fib + short-term structural support.
Good for partials.
TP2 – Main Target (FAKE Demand Zone)
3,897 – 3,886
Major demand zone where liquidity is likely to be tapped.
TP3 – Extended Target (Full Projection)
3,753
−27% fib extension and deeper liquidity zone.
📊 Technical Summary
Multiple stacked supply zones above price
Price created a fake CHoCH, failing to hold above structure
Fib retracements (38.2%–61.8%) align with supply
Lower high formation → bearish continuation likely
Targeting the unmitigated fake demand zone and extension levels
⚠️ Risk Management
Risk only 1–2% per trade
Break-even once TP1 hits
Scale out profits at each target to lock gains
📌 Outlook
As long as price stays below 4,100, bearish continuation toward 3,886 and possibly 3,753 remains the most probable scenario.

LiamTrading – XAUUSD H1 | A bearish structure has formed...LiamTrading – XAUUSD H1 | A bearish structure has formed, waiting for confirmation signals in the European session
Overall, gold is in a corrective phase after the previous upward move. On H1, a clear Dow bearish structure (lower highs, lower lows) has formed, but the support area around 4,030 and the Fibonacci cluster below are still potential zones for a reversal buying force. Today's European session will be crucial to confirm: whether to continue a deep decline or bounce back according to the head and shoulders pattern forming on H4.
Macro – Fundamental Brief
The October Fed meeting minutes show a strong internal division:
One group opposes rate cuts, wanting to maintain the current level.
The other group supports cuts, even proposing further reductions in the December meeting.
This lack of consensus reflects a high degree of monetary policy uncertainty, keeping defensive capital flows interested in gold. In the long term, gold only surges when confidence in the financial system weakens – the peak gold price is not a sign of prosperity, but a warning signal.
Technical Analysis – H1 (trendline, Fibonacci, liquidity)
The price is fluctuating below the short-term descending trendline, confirming the bearish phase is still in effect.
The 4,082–4,090 zone is an “important liquidity zone” – where the price has reacted multiple times, currently acting as near resistance.
The 4,029–4,031 cluster is crucial support:
Coincides with technical support area + Fibonacci retracement level.
Start of a large FVG running down to the 3,985 zone (Fibo 1.618 + psychological support).
Above, the 4,129–4,130 zone is strong resistance (strong resistance on the chart); if the price surpasses and holds above this area, the Dow bearish structure will weaken significantly.
Trading Scenario Reference
BUY Scenario – buy at support / Fibonacci zone
Logic: Price holds above support – Fibonacci, bottom-fishing capital appears.
Entry BUY: 4,029–4,031
SL: 4,022
TP: 4,040 → 4,065 → 4,090 → 4,120
Only prioritize when the price reacts well at 4,029–4,031 (wick or clear reversal candle appears on M15–H1). If H1 closes below 4,022, this BUY scenario should be canceled.
SELL Scenario – follow the current bearish structure (prioritize when trendline is not broken)
Logic: Price retraces to retest resistance + descending trendline and is rejected.
Entry SELL: 4,098–4,100
SL: 4,105
TP: 4,088 → 4,070 → 4,035 → 4,000–3,985
Only enter when the price hits the 4,098–4,100 zone and a clear rejection signal appears (pin bar/bearish engulfing). If H1 closes above 4,105 and breaks the trendline, stop all sell orders and reassess the structure.
Notable Price Zones for Scalping
4,082 – 4,060 – 3,985 – 4,129
These zones can be used for short-term scalping based on price reactions, but reduce volume and close quickly.
Important Note
If the price is confirmed to close stably above the descending trendline and holds above the 4,090–4,100 zone, the priority will gradually shift to BUY setups, as a head and shoulders pattern (bullish reversal) is forming on H4.
Conversely, if the 4,029–4,022 support is decisively broken, gold is likely to continue falling towards the FVG and Fibonacci 1.618 zone around 3,985.
Which scenario are you leaning towards for gold today – retrace up to sell further or hold the bottom to bounce back? Leave a comment below the post and follow the LiamTrading channel for daily XAUUSD updates on TradingView.

Gold price analysis November 20Gold continues to show a solid reaction at the main trendline, indicating that the bullish structure is still maintained by organized buying. The market's continued respect for this support line is an important signal, keeping the possibility of extending the trend to the 4200 zone high.
However, it is important to note: a H4 candle closing below the trendline will be the first sign confirming the weakening of the bullish momentum. At that time, the balance of forces will tilt towards the sellers and the price may correct deeply to the 3936 zone - the confluence of the next strong support.
Recommended strategy:
Activate BUY when the market shows a price rejection signal at 4041.
Profit target: 4200.
Risk management: H4 closes below 4041 → switch to SELL strategy, aiming at 3936.

GOLD Breakout Done , Long Setup Valid To Get 300 Pips !Here is My 15 Min Gold Chart , and here is my opinion , the price going up very good and we have a 4H Candle closure above our Res 4100.00 And Perfect Breakout and this give us a very good confirmation , so we have a good confirmation now to can buy after the price go back to retest the broken area 4100.00 For the first time and hope it will give us a good chance to enter with good stop loss , and we can be targeting 100 to 300 pips . if we have a daily closure below this area this mean this idea will not be valid anymore .
Reasons To Enter :
1- Perfect Breakout .
2- Clear Bullish Price Action .
3- Bigger T.F Giving Good Bullish P.A .
4- The Price Take The Last High .
5- Perfect 4H Closure .

Gold (XAUUSD): Long Trade from Demand ZoneIdentified Trading Setup
The chart illustrates a potential long (buy) trade setup based on a specific strategy, likely related to Smart Money Concepts (SMC) or order flow analysis:
Support/Demand Zone: The entry is planned around the grey box zone, specifically at the CRT-L (Current Range Low) area, implying a belief that this is a strong level for a price reversal.
SSS (Sell-Side Liquidity): The label "SSS" points to a level around $4,030 which was recently broken, suggesting the initial selling pressure has subsided or that liquidity has been swept.
Projected Path: The black line with arrows indicates the expected price path—a significant reversal from the low zone, followed by an uptrend towards the target.
Target (Take Profit): The trade aims for the CRT-H (Current Range High) around $4,092.85. This level represents a strong area of previous supply or resistance that the price is projected to retest.
💡 Conclusion
The analysis suggests a contrarian trade anticipating a bounce off a key support/demand zone for a retracement back toward recent high-level resistance. The blue shaded box represents the potential profit area for this long setup.

XAU/USD Intraday Plan – NFP Will Decide the Next MoveGold failed to clear the 4115 resistance yesterday, which led to a retest of the 4053 level — now acting as intraday support. Price is currently trapped between the MA200 and MA50, reflecting indecision ahead of the NFP release.
We need to see a clean break above the immediate resistance at 4078.
A sustained move above 4115 would confirm a momentum shift and open the door toward
4170 → 4232.
If price fails to clear 4078, we may see continued consolidation or another pullback into the Support Zone.
A break below 3,996 would expose the HTF Support Zone (3968–3921).
📌Key Levels to Watch:
Resistance:
4078
4115
4170
4232
Support:
4053
4027
3996
3968
3921
🔎Fundamental Focus:
Today is all about NFP, one of the most market-moving releases for gold. With job creation, wages, and unemployment all being published together, we can expect sharp volatility in both directions.

Gold H1 – Sideway or Preparing for a Bigger Break?🟡 XAUUSD – Intraday Smart Money Plan | by Ryan_TitanTrader (20/11)
📈 Market Context
Gold continues to move inside a tight consolidation as markets digest fresh headlines:
Treasury markets just erased hopes for a December rate cut and now even a January cut is doubtful, following hawkish tones revealed in the latest Fed minutes.
This shift reinforces USD strength in the short term and pressures gold’s bullish momentum, keeping price trapped between well-defined liquidity zones.
Key implications from the news:
• The 6-month Treasury yield jumped back to 3.83%, aligning with hawkish expectations.
• Rate-cut bets evaporating → USD stays firm, limiting gold’s upside.
• Institutions are engineering both-side liquidity sweeps ahead of upcoming Fed speakers.
• Gold is currently hovering around ~$4,070 inside a neutral zone where no clean premium/discount imbalance exists.
Until the market receives fresh macro catalysts, price is likely to sweep liquidity at the edges of the range before choosing direction.
🔎 Technical Analysis (1H / SMC Structure)
• Structure: Price remains inside a short-term sideways distribution after the recent CHoCH + BOS sequence.
• Premium Sell Zone: 4145–4147, aligning with unmitigated supply + buy-side liquidity resting above recent highs.
• Discount Buy Zone: 4004–4002, sitting inside last clean demand with previous sell-side sweep.
• Liquidity Map:
→ Buy-side liquidity: above 4145–4150 (equal-high cluster).
→ Sell-side liquidity: below 4004–3997, where earlier long positions were cleared.
🔴 Sell Setup (Premium Reaction Zone)
• Entry: 4145 – 4147
• Stop-Loss: 4155
• Take-Profit:
→ 4085 (minor imbalance)
→ 4045 (range midpoint)
→ 4004 – 4002 (discount demand)
📌 Execution rule: Wait for liquidity sweep into zone + bearish CHoCH M5–M15 before entering.
🟢 Buy Setup (Discount Reaction Zone)
• Entry: 4004 – 4002
• Stop-Loss: 3997
• Take-Profit:
→ 4040 (short-term range high)
→ 4075 (inefficiency fill)
→ 4140 (premium retest)
📌 Valid only if price sweeps the 4000–3997 liquidity pocket and shows strong bullish displacement.
⚠️ Risk Management Notes
• Expect increased volatility as markets reposition after the sharp decline in rate-cut expectations.
• Avoid trading inside the 4030–4080 chop zone unless a clear structure break occurs.
• Reduce risk size during sudden USD spikes caused by Treasury-yield moves.
• Trail stops progressively as each liquidity level is taken.
📝 Summary
Gold is currently stuck in a clean intraday range as hawkish Fed minutes remove hopes for early rate cuts, pushing USD up and holding gold below premium supply.
SMC structure favors liquidity-sweep setups at both edges:
• Sell Zone: 4145–4147 (premium supply)
• Buy Zone: 4004–4002 (discount accumulation)
Expect classic manipulation → reaction → continuation patterns until the market resolves the new macro pressure.
📍 Follow @Ryan_TitanTrader for more Smart Money updates.

XAUUSD – HEAD AND SHOULDERS PATTERN CLEARLY FORMED, CONTINUE ...💛 XAUUSD – HEAD AND SHOULDERS PATTERN CLEARLY FORMED, CONTINUE TO PRIORITIZE BUYING 🎯
🌤 1. Overview – Today's Picture
Hello everyone, it's Lana again 💬
In the Asian session this morning, gold has completed the right shoulder of the inverse Head and Shoulders pattern very clearly on the H3/H4 frame. Those who bought according to the previous scenario are currently in a favorable position, and in my opinion, this is still the time to hold the Buy order and prepare for additional opportunities if the market confirms the trend.
On the macro side, according to the FedWatch CME tool, the probability of the Fed cutting 25bp in December is only about 30–33%, while the likelihood of maintaining the interest rate still prevails. This prevents the USD from falling deeply, but at the same time, it is not strong enough to "suppress" gold – creating a strong fluctuation environment within the range, very suitable for trading according to technical patterns.
💹 2. Technical Analysis – Head and Shoulders Pattern & Price Structure
The inverse Head and Shoulders pattern has formed quite accurately:
Left shoulder → Head → Right shoulder all rest on the long-term upward trendline.
The bottom area around 4040–4050 is a liquidity box supporting the entire structure.
The neckline currently lies around the 4089–4090 area:
When the price breaks up and closes above 4089, we consider it a confirmation of a new upward trend.
After the breakout, gold can expand to the areas 4145 → 4200, where strong liquidity + FVG is concentrated above.
Area 4130–4132:
Is a large liquidity cluster – where short-term profit-taking & Sell orders are likely to appear.
Once this area is decisively broken, the likelihood of the price quickly bouncing to 4200 is quite high.
Area 4040:
Is both the bottom of the pattern and a key support.
The scenario will fail if gold closes the H4 candle below 4040, as the Head and Shoulders structure would be broken.
Overall, the price is compressing right below the neckline, and just a nice break can trigger the next upward wave.
🎯 3. Reference Trading Plan
💖 Main BUY Scenario – according to the pattern
1️⃣ Buy retracement to support
Entry: 4060–4063
SL: 4055
TP: 4088 → 4108 → 4130 → 4143 → 4200
2️⃣ Buy breakout neckline
Condition: Price breaks the downward trendline & neckline, closes above 4089.
Entry: around 4089–4092
SL: 4080
Reference TP: 4132 → 4145 → 4200
💢 Note on SELL
Currently, SELL is only against the pattern trend, not a priority scenario.
Only consider short Sell when:
Price reacts very strongly at 4132–4145,
And there is a clear reversal signal on M15–M30 (pin bar, bearish engulfing, increased selling volume).
⚠️ 4. Key Fundamental Factors to Watch
The probability of the Fed maintaining the interest rate is still high → the market is likely to "freeze" before the news, then explode with volatility.
During this period, gold is often sensitive to data: employment, inflation, Fed officials' speeches.
🌷 In summary, the inverse Head and Shoulders pattern on XAUUSD is supporting the upward scenario, as long as the price remains above 4040 💛
My strategy:
Prioritize Buy, first in the 4060–4063 area, then break 4089,
Closely monitor the 4132–4145 area – if broken, the opportunity to reach 4200 is very clear.
If you find the analysis useful, please 💛 Like – 💬 Comment – 🔔 Follow LanaM2 to update the gold perspective with me every day ✨

XAUUSD : Bearish Flip Targets $3930 LiquidityKey Observations and Interpretation
Previous Trend: The price experienced a strong bullish move, peaking around the $4,240 level, followed by a significant retracement.
Break of Structure (BOS): There was a previous Break of Structure (BOS) to the upside around $4,040, which indicated the start of the recent upward move. The price has now retraced back to and below this level.
Market Structure Shift/Change of Character: The move from the $4,240 peak down to the recent low near $3,990, followed by a lower high (X) at approximately $4,120, suggests a potential shift in market character from bullish to bearish.
Inducement/Minor Liquidity Sweep (I/S): The price action that led up to the high at X seems to have swept minor internal liquidity (I/S) before the larger drop.
Demand Zone/Fair Value Gap (D/FVG): The shaded area between roughly $4,040 and $4,070 represents a zone that was likely a prior demand zone or contains a Fair Value Gap (FVG). Price is currently interacting with this zone. In a bearish scenario, this zone is expected to act as resistance (a supply zone) after the structure shift.
Target Liquidity ($$$): The chart highlights multiple clear liquidity targets below the current price, marked by the triple dollar signs ($$$). These are levels where retail traders have likely placed stop-loss orders or where sell-limit orders are resting. These levels are approximately:
$3,980
$3,960
$3,930
📉 Projected Move
The analysis projects a likely scenario where the price:
Tests/Fills the D/FVG Zone: The price may experience a small bounce or consolidation within the $4,040 - $4,070 D/FVG zone (now acting as potential resistance/supply).
Continuation Lower: From this zone, the expectation is for the price to continue its move down.
Liquidity Sweep: The primary targets for the bearish move are the highlighted liquidity levels ($$$) below the $4,000 psychological level, with the deepest target around $3,930.

Gold Under Pressure: Key Resistance Holds, More Downside LikelyGold is moving inside a descending channel showing clear bearish pressure. Price is struggling to hold above 4050-70 and repeated rejections from the upper trendline confirm sellers are still in control. A clean break below 4025 can open the way toward the deeper liquidity zones around 4010 and 3975. As long as price stays below the falling trendline the bias remains bearish and any small pullback toward 4075-90 will likely act as a selling opportunity. Only a strong breakout above 4100-20 would shift momentum back to buyers.
✅ Bias: Sell below 4060-85 resistance
Sell Zone : 4075–4090
Stop Loss : Above 4120
Take Profit : 4025 - 4010 - 3975
Note
Please risk management in trading is a Key so use your money accordingly. If you like the idea then please like and boost. Thank you and Good Luck!

XAUUSD: Short-Term Downtrend Active Below FVG/Supply ZoneKey Technical Points
Major Resistance (X): The swing high marked 'X' around $4,240 served as a strong ceiling, initiating the current downtrend.
Supply Zone (D / FVG): The shaded gray box, labeled 'D / FVG' (Demand/Fair Value Gap), is a critical supply area (resistance) located between approximately $4,100 and $4,140. The price has reacted negatively to this zone, confirming its importance as a selling region.
Bearish Channel: Since the rejection from the major high, the price has been contained within a clear descending channel, indicating sustained short-term bearish momentum.
Current Action: The price is trading near the mid-point of the channel, currently at $4,064.40. The market structure suggests a pattern of lower highs and lower lows is still active.
Outlook
The immediate outlook remains bearish as long as the price stays within the descending channel and below the D / FVG supply zone. The most probable next move is a continuation toward the lower boundary of the channel, potentially testing the $4,000 psychological support level.

XAUUSD Bullish Setup Toward 4100XAUUSD is showing a bullish setup after sweeping liquidity and rejecting strongly from the order block zone. Price is pushing upward toward the 4100 target, supported by previous range breakout, FVG imbalance, and clear resistance levels above. The chart signals continuation to the upside.

Where Can Gold (XAUUSD) Take a Correction?Looking at your chart, Gold is moving up in a short-term recovery, but there are strong resistance zones above where a correction (downward move) can happen.
1️⃣ Zone: 4113 – 4120 (Current Area)
This is a minor resistance.
Small pullback is possible but not a major reversal zone.
2️⃣ Major Resistance Zone: 4143 – 4147
This is the first strong supply zone.
Price fell sharply from this zone earlier.
This is the most likely area for correction.
3️⃣ Strong Resistance: 4176 – 4180
If price continues upward, this is the next major resistance.
High probability that gold will correct from here.
4️⃣ Upper Resistance: 4200 – 4207
This aligns with your upper trendline.
This is the highest and strongest reversal zone.
A deep correction can start from here.
Stay Tuned For More Updates
