xauusd ideaWe are waiting for our asset to reach our action zone, and based on the reaction, we’ll decide on our next moves.ALWAYS WAIT FOR A CONFIRMATION TO SEE IF THE PRICE VALIDATES THE ZONE.and you what is your vision of the EURUSD its interests me! i wait you in the commentar
Xauusdanalysis

ElDoradoFx – GOLD PRO ANALYSIS (05/11/2025, US SESSION)1️⃣ Market Overview
Gold holds steady around $3,965, consolidating after yesterday’s rebound from $3,932 lows. The US session opens ahead of ADP Employment and ISM Services PMI, which are likely to drive volatility.
The current price remains in a mid-term corrective phase after the sharp rally to $4,100, and sentiment leans mildly bullish as long as the $3,950 support remains intact.
⸻
2️⃣ Technical Breakdown
• Daily (D1): Gold continues its pullback after the rejection from $4,100, forming higher lows above $3,870 (100 EMA). RSI at 48 shows neutral-to-slight bullish momentum; no bearish divergence visible.
• H1: Structure is consolidative between $3,950 – $3,975 with resistance at 200 EMA and ascending trendline support beneath. Bulls are defending the trendline successfully so far.
• 15M–5M: Short-term compression forming a potential bullish breakout setup. MACD shows a flattening histogram with early signs of momentum reactivation to the upside.
⸻
3️⃣ Fibonacci Analysis
Last Swing: 3,987 → 3,928
• 38.2% → 3,950
• 50.0% → 3,957
• 61.8% → 3,965
🎯 Golden Zone: 3,950 – 3,965 (active reaction area aligning with trendline & 100 EMA on 15M).
⸻
4️⃣ High-Probability Trade Scenarios
📈 Buy Scenario (Main Bias)
• Entry Zone: 3,950 – 3,965 (within the Golden Zone).
• Targets: 3,975 → 3,990 → 4,010 → 4,045
• Stop Loss: Below 3,940
• Confirmation: 15M bullish engulfing, RSI > 60, and MACD crossover to positive.
💥 Breakout Buy Setup
• Trigger: Break and close above 3,975
• Retest Zone: 3,970 – 3,972
• Targets: 3,990 → 4,015 → 4,045 → 4,060
• Stop Loss: Below 3,960
⸻
📉 Sell Scenario (Countertrend)
• Entry Zone: 3,975 – 3,990 (supply zone near 200 EMA).
• Targets: 3,955 → 3,940 → 3,925
• Stop Loss: Above 3,995
• Confirmation: Bearish rejection candle or RSI divergence under 55.
⚡ Break & Retest Sell Setup
• Trigger: Break below 3,940
• Retest Zone: 3,945 – 3,950
• Targets: 3,925 → 3,905 → 3,880
• Stop Loss: Above 3,960
⸻
5️⃣ Fundamental Watch
• US ADP Non-Farm Employment Change – early indicator of Friday’s NFP.
• ISM Services PMI – potential volatility driver for DXY and XAUUSD correlation.
• Fed commentary and yield direction may influence session bias.
⚠️ High volatility expected during releases – avoid over-leveraging.
⸻
6️⃣ Key Technical Levels
Type Level (USD) Notes
Resistance 1 3,975 200 EMA + structure high
Resistance 2 3,990 Key supply & fib extension
Support 1 3,955 Intraday support
Support 2 3,940 Breakout validation point
Trendline Support 3,950 Golden Zone confluence
Breakout Triggers >3,975 / <3,940 Defines session direction
⸻
7️⃣ Analyst Summary
Gold is currently compressing within the Golden Zone ahead of US data. Market bias remains bullish above 3,950, with the possibility of a breakout toward 4,000–4,015 if resistance breaks cleanly.
A failure to hold above 3,950 will shift momentum short-term bearish toward 3,925 and below.
⸻
8️⃣ Final Bias Summary
📊 BULLISH while above 3,950, targeting 3,990 – 4,015
🔻 BEARISH only if price breaks below 3,940, targeting 3,925 – 3,905
— ElDoradoFx PREMIUM 3.0 Team 🚀
⸻

GOLD AWAIT BREAKOUT BEFORE ENTRY#XAUUSD price still bearish unless 2 times breakout occurs above the 3989 limit which will go bullish till 4015.
Now we await for retest above 3974 to sell. Target 3936, stop loss 3989.
Below 3956 on M15-H1 closures holds continuation on sell.

Gold's break below support was expected; continue shorting.Gold traded sideways yesterday, repeatedly encountering resistance around the $4000 level. After a failed attempt to break through in the final wave of trading last night, it experienced a sharp drop, consistent with our bearish forecast.
The breakdown is normal; after all, a break above $3960 inevitably leads to a faster decline. Last night, it ultimately fell to around $3928, breaking the recent consolidation range. Short-term pressure suggests further downside. There is some support around $3930, but I believe this level will be difficult to hold today. Gold prices may test $3915 or even $3900.
On the 4-hour chart, upward momentum in gold is lacking. The overnight high provided resistance around $3975, while the $3962 level was the point of accelerated decline after the breakdown. Currently, bulls are under significant pressure. Unlike the previous consecutive gains, this week has been characterized by weak consolidation with an overall downward bias. The bulls currently lack strength, and the short-term trend remains bearish.
The key levels to watch are 3960-62, which was the resistance level encountered during the first round of rebound, and 3975-77, the high point of yesterday's rebound, which is also the starting point of the decline.
Today's Trading Strategy:
The 3900 area is a key defense zone for the bulls. Gold prices previously rebounded from this area, reaching a high of around $4045. Will gold prices find support again and rebound this time? I think it's unlikely. The bulls encountered strong resistance during the rebound and ultimately broke through this area, indicating that the gold price trend is weakening. We should follow the trend and focus on selling on rallies, only considering going long after gold prices break below 3900.
Aggressive traders can establish short positions around $3960-$3962; conservative traders can establish short positions in the $3970-$3975 range.
If you don't have a plan or strategy for gold trading and are struggling to achieve consistent profits, you can refer to and follow my updates for guidance and help you avoid mistakes.
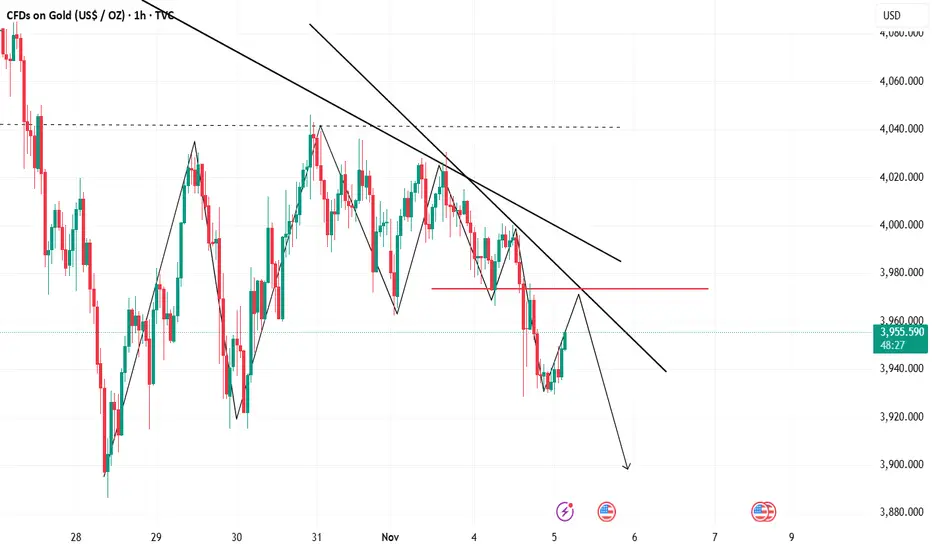
Gold Bearish Continuation After Range BreakdownThe chart shows that gold (XAUUSD) recently broke down from a clear consolidation range highlighted by the red rectangle. This range acted as a distribution zone where price repeatedly failed to break higher. Once the lower boundary of that range broke, sellers gained momentum, pushing price downward.
Price has now pulled back toward the broken structure, forming a corrective bullish move — likely a retracement before further downside. The projection on the chart suggests a lower-high formation followed by continuation to the downside.
Key observations:
Breakdown from consolidation: The range around 3960–4000 was rejected multiple times, confirming strong resistance.
Pullback to structure: Current bullish candles appear corrective, not impulsive.
Bearish projection: The chart shows expected continuation toward levels around 3929, 3900, and potentially lower.
Stop-loss area: The SL is clearly marked at 4000.234, above the former resistance zone.

XAUUSD LONG SETUP INTRADAY ( NOV 05, 2025 )If you have doubt on our trades you can test in demo.
OANDA:XAUUSD LONG SETUP
EP: 3966.253
TP: 3990.121
SL: 3954.296
Trade Ideas:
Idea is clearly shown on chart + we have some secret psychologies and tools behind this.
Trade Signal:
I provide trade signals here so follow my account and you can check my previous analysis. So don't miss trade opportunity so follow must.

XAUUSD LONG SETUP 1:2 RR ( NOV 05, 2025 )If you have doubt on our trades you can test in demo.
OANDA:XAUUSD NEW LONG SETUP
EP: 3972.539
TP: 3996.226
SL: 3960.454
Trade Ideas:
Idea is clearly shown on chart + we have some secret psychologies and tools behind this.
Trade Signal:
I provide trade signals here so follow my account and you can check my previous analysis. So don't miss trade opportunity so follow must.

Gold Bearish Continuation After Range BreakdownThe chart shows that gold (XAUUSD) recently broke down from a clear consolidation range highlighted by the red rectangle. This range acted as a distribution zone where price repeatedly failed to break higher. Once the lower boundary of that range broke, sellers gained momentum, pushing price downward.
Price has now pulled back toward the broken structure, forming a corrective bullish move — likely a retracement before further downside. The projection on the chart suggests a lower-high formation followed by continuation to the downside.
Key observations:
Breakdown from consolidation: The range around 3960–4000 was rejected multiple times, confirming strong resistance.
Pullback to structure: Current bullish candles appear corrective, not impulsive.
Bearish projection: The chart shows expected continuation toward levels around 3929, 3900, and potentially lower.
Stop-loss area: The SL is clearly marked at 4000.234, above the former resistance zone.

Elliott Wave Analysis – XAUUSD (Nov 05, 2025)
🔹 Momentum
D1 timeframe:
Daily momentum has reversed to the downside, suggesting that the dominant trend for the next 4–5 days is likely to be bearish.
H4 timeframe:
H4 momentum is currently turning upward, indicating a potential short-term bullish correction lasting 4–5 H4 candles.
However, since price action is within a corrective wave, short-term momentum signals can be noisy. Still, this minor rally can provide valuable observation opportunities.
H1 timeframe:
H1 momentum is now in the overbought zone and about to turn down.
I usually take entries when H1 and H4 momentum align, but right now they are out of phase, so the best move is to wait and observe.
The 3891 level will be a key area to monitor in the short term.
________________________________________
🔹 Wave Structure
D1 timeframe:
The corrective wave X (purple) within wave (4) (yellow) appears to be forming or nearing completion.
The downside reversal on D1 suggests that wave X might have already ended, and price could now be starting wave Y downward.
A break below 3892 would confirm that wave X is complete.
However, note that this X-wave retracement is quite shallow (around 0.283 of the previous W-wave), which reduces the reliability of the momentum signal — meaning we must stay cautious and monitor closely.
________________________________________
H4 timeframe:
On H4, the structure of wave X (purple) shows signs of a contracting triangle, anchored around the 4028 resistance zone with higher lows.
In this scenario, an a–b–c correction is expected, where wave b forms the triangle, and wave c could rise toward 4050–4149 to complete the X-wave.
However, the strong drop yesterday is weakening this scenario, though not invalidated yet.
→ The bullish scenario would be fully invalidated if price breaks below 3892.
Thus, we must monitor two possible cases:
1. Case 1:
Wave X is still in progress – supported by the current H4 momentum upswing.
If price breaks above 4028 when H4 momentum reaches overbought, it will strengthen this view.
2. Case 2:
Wave X has already completed as a triangle (abcde) shown on H1.
In this case, the ongoing H4 rally is just a corrective bounce, and once H4 momentum enters overbought and price fails to close above 4028, a new bearish leg is likely to start.
________________________________________
H1 timeframe:
The corrective X-wave (purple) seems to have completed as a triangle (abcde, black).
That means the market is now likely in wave Y (purple) on D1, where the main trend is bearish, and any upmove is only corrective.
Hence, the 3981 liquidity zone above is considered a high-probability sell area.
________________________________________
🔹 Trading Plan
• Sell Zone: 3981 – 3983
• Stop Loss: 4002
• Take Profit 1: 3892
• Take Profit 2: 3814
⚠️ Note:
Current volatility is extremely high — each H1 candle covers more than 200 pips.
Therefore, the stop loss range is wide.
👉 To manage risk effectively:
• Either avoid trading during this phase, or
• Reduce position size to keep account safety intact.

GOLD How to Trade the XAUUSD Range Breakout StrategyLet's cut straight to the chase on Gold (XAU/USD). Right now, the chart isn't giving us much to work with. We are locked solid in a textbook range-bound environment. 😒
If you compare this choppy, sideways action to the clear trends we've seen previously, the difference is stark. There is simply no directional conviction in the market at the moment; we're witnessing classic accumulation/distribution—or just plain indecision.
My focus is simple: Patience is your edge right now. I'm not interested in getting chopped up inside this consolidation zone. We are waiting for a concise, decisive move—a clean breakout—either above the high or below the low of this current range.. and a retest of the range. ⬆️⬇️
Bullish Scenario: A breakout above, followed by a successful re-test and fail. That's our green light for a long position, signaling momentum has shifted North. 🚀
Bearish Scenario: A breakdown and re-test of the range. That's the cue for a short opportunity, confirming bearish momentum. 📉
The breakout and re-test confirmation will be key. Until then, I'll stand aside and preserve capital. No setup, no trade. 🔥

XAU/USD Intraday Plan | Buyers Need 3989 BreakAfter breaking below the 3989 support level yesterday, gold tested the First Reaction Zone as anticipated, where buyers stepped in and defended the area.
Price is now trading around 3968, but still below both the MA50 and MA200, which keeps short-term momentum bearish.
For buyers to regain control, we need a clear break and hold above the 3989 level. A break above this area could open the move toward the 4042 resistance, with 4090 possible if momentum continues.
If price fails to reclaim the 3989 level, we may see another retest of the Reaction Zone. Failure to hold that area could expose the lower Support Zone and potentially the HTF Support Zone below.
📌 Key Levels to Watch:
Resistance:
3989
4042
4090
4120
Support:
3957
3918
3884
3851
3820
3781
🔎 Fundamental Focus:
Today has a few medium-to-high impact U.S. releases, including ADP Employment, and ISM Services PMI, which could influence intraday volatility. Later in the session, President Trump is scheduled to speak, which also has the potential to move markets depending on tone and messaging.

ANFIBO | XAUUSD - Sideway Channel H1 [10.29.2025]Hi traders, Anfibo's here!
XAUUSD Analysis – Daily Trading Plan
Overall Picture:
At present, OANDA:XAUUSD is moving sideways within a well-defined H1 channel, showing signs of short-term consolidation after recent volatility. The market is currently lacking a clear directional bias, as both buyers and sellers are testing the upper and lower bounds of this intraday structure. Such conditions often favor range-trading strategies, where precision and timing become crucial for capturing short bursts of momentum.
In this context, our plan today remains straightforward and tactical — trade directly off the trendlines of the channel. In other words, we will look to buy at the lower boundary of the range and sell near the upper boundary, while also being prepared to switch positions if a breakout occurs in either direction.
Trading Plan for Today:
>>> SELL ZONE:
ENTRY: 4060 - 4080
SL: 4090
TP: 4000 - 3955
>>> BUY ZONE:
ENTRY: 3940 - 3950
SL: 3930
TP: 4000 - 4045 - 4070
Risk Management:
- Stick to small-to-medium positions within the range; increase size only on confirmed breakouts.
- Keep stops tight, as sideways phases tend to trigger false signals.
- Maintain Risk:Reward ≥ 1:2 and avoid overtrading in choppy conditions.
- Reassess bias once the H1 channel is clearly broken.
Conclusion:
Gold is currently in a sideways consolidation phase within its H1 channel, awaiting fresh catalysts to determine direction. Until a decisive breakout occurs, the most effective approach is range trading — buying near support, selling near resistance, and reacting dynamically to any confirmed breakout.
The plan today is simple yet strategic:
“Buy at the trendline, sell at the trendline — and flip when the channel breaks.”
Patience and discipline will be key to capitalizing on this quiet yet potentially explosive setup.
GOODLUCK GUYS!

Gold Rebuilds Structure Above $3940, Eyeing $4030 Liquidity Pool
🔍 Market Context
Gold is attempting to regain bullish momentum as safe-haven demand remains supported by rising geopolitical tensions and uncertainty around the upcoming US ADP employment data.
The market continues to oscillate between risk aversion and rate expectations — with the Fed’s hawkish tone keeping the Dollar capped but steady.
At the same time, capital flow rotation from equities into defensive assets is quietly supporting the metal’s structural recovery, with gold holding above key liquidity levels despite intraday volatility.
📊 Technical Analysis (H1–H4)
After forming a double-bottom structure near $3,938, XAU/USD has reclaimed the 38.2% retracement zone (3,974–3,975) from its previous bearish leg.
This area now acts as a pivot zone, separating short-term bullish continuation from potential retracement.
The chart reveals a classic liquidity cycle shift:
Phase 1: Sweep of downside liquidity below 3,930, marking an internal structural low.
Phase 2: Expansion leg reclaiming short-term FVGs, signaling a potential smart money accumulation phase.
Phase 3: Repricing toward upper liquidity targets aligned with Fibonacci extensions.
Key Technical Zones:
• 💎 Liquidity Base: 3,938 – 3,950 (recent demand re-entry area)
• 🎯 Rejection Zone 1: 3,974 – 3,999 (previous inefficiency block)
• ⚙️ Target Zone: 4,033 – 4,045 (1.272–1.618 Fibo extensions, liquidity pool)
• ⚠️ Invalidation: Break below 3,920 would shift structure back to distribution.
🎯 MMFLOW Scenario
If gold sustains above the 3,950 support cluster, buyers are likely to extend the retracement toward 3,999–4,033 where resting liquidity sits.
A clean rejection from 4,000 could trigger an intraday pullback — but as long as price holds above the 3,938 OB base, the bullish recovery structure remains intact.
The short-term narrative favors controlled accumulation, suggesting that smart money is building positions into liquidity zones before the next impulsive move.
⚜️ MMFLOW Insight:
“Liquidity isn’t random — it’s engineered. Every move leaves a footprint, and gold is tracing its next one above $3,950.”

XAUUSD – PRIORITIZE BUYING, TARGET 4040XAUUSD – PRIORITIZE BUYING, TARGET 4040 🎯
🌤 1. Overview
Hello everyone 💬
My perspective on gold today is still to prioritize buying, as there hasn't been a clear deep decline.
The price is currently consolidating in a narrow range, needing more time to build momentum before breaking out.
I will wait to buy again at the OB area – where there is high liquidity, this is a zone likely to see strong price reactions.
The best scenario today: the price may sell off slightly at FVG, then drop to OB to trigger the buy setup.
💹 2. Technical Analysis (ICT Perspective)
💜 Price Structure: Gold still maintains a short-term uptrend, the main trend hasn't been broken.
💎 Liquidity: Liquidity is concentrated below the 3940 area – a potential buying OB.
💫 FVG: The 3975–3980 area is a zone where a slight bearish reaction may occur.
⚙️ Order Block (OB): 3938–3945 is a crucial support zone, with the potential for a strong price rebound from here.
📈 Main Target: 4040 – a high liquidity zone, coinciding with a large frame FVG.
🎯 3. Reference Trading Scenarios
💢 Short SELL (scalping)
Entry: 3980 | SL: 3988
TP: 3972 – 3960 – 3940
💖 Main BUY (priority)
Entry: 3940 | SL: 3932
TP: 3952 – 3968 – 3990 – 4012 – 4035
✨ 4. Important Notes
🔹 Observe price reactions at FVG and OB before taking action.
🔹 If the price exceeds 3988, the bearish scenario is temporarily invalidated.
🔹 The main direction is still to buy according to the Smart Money trend – only consider short selling when confirmed.
🌷 5. Conclusion & Interaction with LanaM2
Gold is still following the Smart Money Flow trajectory,
patiently waiting for the price to reach a favorable zone to act 💪
This is not an investment recommendation, just a personal perspective based on the ICT method.
If you find it useful, please 💛 like – 💬 comment – 🔔 follow LanaM2
to stay updated with the latest gold insights every day.

Another Volatile Day for Gold: Is the Next Leg Down Loading?Yesterday was just another volatile session for Gold...
After testing the waters above $4,000, price reversed sharply during the New York session, dropping to around $3,930.
A brief consolidation followed, and by the time of writing, Gold already rebounded toward $3,970, reclaiming the $3,960 support area.
Despite this recovery, the overall structure remains bearish — as long as price fails to stabilize above $4,000, sellers maintain control.
📉 Outlook:
I continue to expect another leg down, with $3,915 as my next focus, followed by the recent low around $3,885.

Gold & Silver Outlook | Central Bank Buying & Correction (5 Nov)🟡 GOLD & SILVER MARKET ANALYSIS - November 05, 2025
Central Bank Buying:
Global central banks remain in accumulation mode after adding 1,000+ tonnes in 2024.
* China: 2,298t | India: 879t | Russia: 2,335t
* Emerging markets’ gold purchases +30% YoY, driven by de-dollarization and inflation hedging as USD reserves fall below 58%.
Silver Demand & Deficit:
* Industrial use hits 680M oz (+11% YoY) — a record.
* Solar PV: 232M oz | EVs: 90M oz
* Deficit: 215M oz — extending into 2025 as mine output stays flat.
📈 Outlook: Range $47–$55/oz, with potential breakout as green tech ramps.
ETF & Market Sentiment :
* Gold ETFs (GLD): +$3.6B inflows in Oct, but -$2.1B outflows in Nov on profit-taking.
* Silver ETFs: Mixed flows, cautious sentiment.
* Gold RSI: ~68 → short-term pullback risk.
* Forecast: Inflows could rebound in Q1 if Fed resumes easing.
Futures & Positioning :
* CME Gold OI: 528,789 contracts (+WoW)
* Implied Vol (Dec): 21.1% | Call/Put Bias: 60/40 (bullish skew)
* Silver Vol: ~25% — traders shifting to policy-driven long bets.
Macro Drivers :
* Fed: 25bps cut + hawkish tone (CPI 2.6%)
* U.S.–China Truce: Reduces tariffs, softens safe-haven demand.
* BRICS: Advancing gold-backed settlement systems.
* Dollar Share: Falls to 58% of global reserves.
Performance & Forecast :
* Gold: $3,941/oz | -1.5% today | +50% YTD
* Silver: $48/oz | -1.0% today | +66% YTD
📊 Projection: Gold eyes $4,400 | Silver targets $57 by mid-2026.
🕐 Astro Window (UK Time): 1:00 PM–4:30 PM bullish spike expected.
Bias : Short-term correction likely → overall bearish bias until supports retest.
Check chart for buying/selling levels.

Gold Accumulates on Support, 3,952 USD is the Gateway for a New🔍 Market Context
Gold is oscillating within a symmetrical triangle pattern , reflecting price compression and waiting for a breakout signal.
Buyers still maintain a short-term bullish structure, but the series of lower highs indicates increasing selling pressure.
The 3,959–3,964 USD zone is currently the “balance point” — if this area is breached, the downtrend could extend to the lower liquidity zone around 3,929–3,921 USD .
💎 Key Technical Zones
• Resistance Zone: 4,020 – 4,040 USD → the main resistance area of the triangle, where strong reactions are likely.
• Support Zone: 3,959 – 3,964 USD → the support area maintaining the bullish structure.
• Liquidity Zone: 3,929 – 3,921 USD → low liquidity area, potential to attract price stop sweeps before reversing.
🎯 Trading Scenarios
1️⃣ BUY Setup – Prioritize when price holds above support
• Entry: 3,959 – 3,964 USD
• Stop Loss: 3,940 USD
• Take Profit:
– TP1: 3,985
– TP2: 4,020
– TP3: 4,040
– TP4: 4,096
✳️ “Buy the discount” – Buy at the trendline convergence support area when confirmation signals appear (rejection or bullish ChoCH).
2️⃣ SELL Setup – Scenario if support breaks
• Entry: 3,950 – 3,955 USD (after candle closes below support zone)
• Stop Loss: 3,970 USD
• Take Profit:
– TP1: 3,935
– TP2: 3,925
– TP3: 3,912
✳️ “Sell the breakdown” – Sell when support is clearly breached, targeting the lowest liquidity zone (3,921 USD).
💬 Summary
Gold is in a phase of accumulation before major volatility .
If it holds above the 3,952 USD zone → prioritize BUY following the bullish structure .
If it breaks below 3,952 USD → SELL following the breakout towards the Liquidity Zone.
The scenario will be clearly confirmed when the current symmetrical triangle is broken.
💡 Today's Tagline:
“Liquidity defines direction — follow where the money hides.”
⏰ Timeframe: 1H
📅 Updated: 11/04/2025
✍️ Analysis by: Captain Vincent

Gold Price Outlook – Trade Setup (XAU/USD)📊 Technical Structure
OANDA:XAUUSD Gold (XAU/USD) rebounded from the Support Zone ($3,929–$3,938), aligning with the ascending trendline drawn from late October lows. The price is attempting to recover toward the Resistance Zone ($3,985–$3,994) but remains within a broader corrective structure.
The bullish momentum looks corrective rather than impulsive, suggesting that unless gold breaks above $3,995 convincingly, sellers may re-emerge near resistance. The rising trendline remains a short-term guide; holding above $3,940 keeps the rebound bias valid.
🎯 Trade Setup
Entry: $3,929 – $3,938
Stop Loss: $3,925
Take Profit 1: $3,985
Take Profit 2: $3,994
Risk-Reward Ratio: ≈ 1 : 4.95
🌐 Macro Background
Gold is stabilizing near $3,950 after a sharp 1.8% sell-off on Tuesday, following renewed USD strength. As FXStreet’s Dhwani Mehta notes, “Gold is licking its wounds near $3,950... but downside risks remain intact ahead of U.S. data.” 【FXStreet】
USD Dynamics: The Dollar entered a bullish consolidation phase after the risk-off rally, with traders reducing bets on further Fed cuts this year. The CME FedWatch Tool shows less than a 70% chance of a December rate reduction.
Market Sentiment: The global tech-led equity sell-off drove risk aversion, causing investors to cover equity losses by selling gold positions.
Upcoming Data: Traders now focus on U.S. ADP employment and ISM Services PMI, both of which could reshape expectations for Fed policy. Strong readings could strengthen the USD and weigh on gold; weak figures might lift gold on renewed rate-cut bets.
Overall, gold’s short-term recovery remains fragile. A rebound toward $3,985–$3,995 could face resistance unless U.S. data disappoints.
🔑 Key Technical Levels
Resistance: $3,985 – $3,994
Support: $3,929 – $3,938
Trendline Support: $3,940
Psychological Level: $3,950
📌 Trade Summary
Gold (XAU/USD) is showing a corrective bounce after finding support near $3,930. While the setup allows for a short-term long trade toward $3,985–$3,994, traders should remain cautious as the broader sentiment stays bearish. A break below $3,925 would invalidate the rebound and reopen the path toward $3,900.
⚠️ Disclaimer
This analysis is for reference only and does not constitute trading advice. Trading involves significant risk, and proper risk management is essential.

XAUUSD (Gold) 3H Analysis & SMT Divergence with XAGUSD🪙 XAUUSD (Gold) 3H Analysis & SMT Divergence with XAGUSD 🕵️♂️
The 3-hour chart for XAUUSD shows a strong bearish expansion, creating a potential opportunity at the current lows.
Current XAUUSD Price: Trading around $3,936.55.
Key High (CRTH): The high at approximately $3,979.27 is the primary "Buy Side Liquidity" zone. A push above this would invalidate the current bearish structure.
Key Low (CRTL): The low at $3,931.01 is the current "Sell Side Liquidity" target.
SMT Divergence Alert (XAUUSD vs. XAGUSD)
We are observing a potential Smart Money Technique (SMT) Divergence at these lows:
XAUUSD (Gold): Has successfully taken out the recent internal low (sweeping liquidity at $3,931.01 or below).
XAGUSD (Silver): Silver appears NOT to have made a lower low, or has only made a shallow sweep, compared to Gold.
This bullish SMT divergence suggests that the overall pressure on the precious metals sector might be weakening, and Gold's latest dip could be a liquidity grab (Liquidity Sweep) before a strong move up.
Scenario Watch (SMT-Driven):
Bullish Reversal: A sharp volume-driven rejection of the current low, confirming the SMT. Price would likely reclaim the internal structure and aim for the CRTH at $3,979.27 as a primary target.
Bearish Continuation (SMT Failure): If XAGUSD now follows XAUUSD and makes a sharp lower low, the SMT would fail. Both metals would then likely push lower toward key support near $3,917.50 for Gold and its corresponding low for Silver.
What is Silver showing on its low, and does this SMT confirm a potential accumulation phase for XAUUSD?
Greetings,
MrYounity

Gold: Focus on Selling, Watch Resistance at 3960–3975Gold bounced after pulling back to the 3948–3921 support zone yesterday, but was capped by the 4H MA5 and fell back toward support again. On the 30-minute chart, the price action currently shows signs of a potential rebound, with the MA60 serving as the key upside resistance in today's session.
As mentioned during yesterday’s live updates, if the 3948–3921 support area breaks, the next major level to watch will be the 3800 psychological mark along with support from the daily MA60. At that stage, trading strategies should be adjusted based on real-time market behavior and sentiment.
Overall, the short-term bias remains bearish, favoring trend-following sell setups. For medium- to longer-term traders, gradual long positioning can be considered. However, volatility remains elevated in this phase, so risk control is essential—manage position size carefully and avoid emotional trading.

ElDoradoFx – GOLD SESSIONS ANALYSIS (05/11/2025, ASIA SESSION)Gold closed the US session bearish at 3,932, extending its downside move under the descending trendline and rejecting from the key supply area at 3,953–3,960. The structure, momentum, and RSI alignment all confirm a continuation bias to the downside — the market remains in a controlled sell-off phase unless bulls reclaim 3,954 with volume.
⸻
📊 Technical Outlook
🔹 D1: Gold is in the second leg of a corrective pullback after peaking at 4,046. The RSI at 46 and fading MACD histogram show room for continuation toward the 100EMA near 3,870.
🔹 H1: Price has consistently printed lower highs and lower lows. All EMAs (20 < 50 < 200) slope downward. The most recent break below 3,940 confirms renewed seller strength.
🔹 15M–5M: Consolidation inside a tight bearish channel, forming minor liquidity traps above 3,940–3,946 before further declines. Momentum is stable to the downside, with no bullish divergence detected.
⸻
✨ Fibonacci Golden Zone (Swing 3,953 → 3,932)
• 38.2% = 3,940
• 50.0% = 3,943
• 61.8% = 3,946
🎯 Golden Zone: 3,940 – 3,946 (Rejection zone for re-entry shorts)
⸻
🎯 High Probability Trade Setup (Chosen Bias: SELL)
📉 SELL SCENARIO (High Probability)
✅ Sell Entry Zone: 3,940 – 3,946 (Golden Zone retest)
🎯 Targets:
1️⃣ 3,925
2️⃣ 3,915
3️⃣ 3,900
4️⃣ Extended target 3,880 (swing projection)
🛑 Stop Loss: Above 3,954
⚡ Confirmation:
– Price rejection at 3,946 or bearish engulfing candle
– RSI stays below 45
– MACD momentum bars remain red
💡 Rationale:
Structure, EMAs, and momentum fully aligned to downside; the 3,940–3,946 area is a low-risk, high-probability retest before the next leg down.
⸻
📈 BUY SCENARIO (Low Probability)
⚠️ Buy Zone: 3,910 – 3,900 (strong low zone / liquidity pool)
🎯 Targets: 3,932 → 3,940
🛑 Stop Loss: Below 3,890
⚡ Only if: Strong bullish divergence forms with RSI <30 and MACD crossover.
⸻
📰 Fundamental Watch
• Asia: Low volatility expected early session; traders waiting for European cash flow.
• DXY: Holding above 106 supports bearish gold momentum.
• No major news, but volatility could spike from dollar liquidity flows ahead of midweek positioning.
⸻
📌 Key Levels
Type Levels Notes
Resistance 3,940 / 3,946 / 3,954 Golden Zone / Rejection Area
Support 3,928 / 3,915 / 3,900 Short-term targets
Break Sell Trigger < 3,928 Confirms continuation
Break Buy Trigger > 3,954 Invalidates bearish setup
⸻
✅ Expert Summary (Final Bias)
Gold remains in bearish continuation mode, with clean confluence between structure, EMAs, and momentum.
🎯 Expect short opportunities from 3,940–3,946 aiming toward 3,915–3,900.
📉 Bias: Bearish continuation until proven otherwise.
⸻
🥇 ElDoradoFx PREMIUM 3.0 – PERFORMANCE 04/11/2025 🥇
📊 Live precision | Consistent gains.
━━━━━━━━━━━━━━━
💎 GOLD RESULTS
🔻 SELL +20 PIPS
🟢 BUY LIMIT +70 PIPS
🔻 SELL +30 PIPS
🟢 BUY +20 PIPS
🟢 BUY +20 PIPS
🔻 SELL +240 PIPS
---
▶ LIVE TRADING SESSION
🔻 SELL +20 PIPS
🔻 SELL +20 PIPS
🔻 SELL +170 PIPS
━━━━━━━━━━━━━━━
💰 TOTAL PIPS GAIN: +610 PIPS
📊 9 Trades → 9 Wins | 0 SL | 0 BE
🎯 Accuracy: 100% ✅
━━━━━━━━━━━━━━━
🔥 Clean, disciplined setups both pre-market and live. Another powerful session for our traders!
👏 Congratulations if you profited! ✅✅✅🚀🚀🚀

Gold has unfinished business at the top.Gold will start its bullish move from the 3,840 zone if it doesn’t begin from the current price around 3,934. There’s still unfinished business at 4,438.6 that the market needs to complete. CMCMARKETS:GOLD

XAUUSD 1H: Order Block and Liquidity Targets for Potential LongKey Observations:
Break of Structure (BOS): Price has recently broken below a previous low, labeled BOS (Break of Structure). This indicates a shift to a bearish market structure in the short term, often leading traders to look for a retracement before a continuation of the downtrend.
Order Block (OB): A crucial area is highlighted and labeled OB (Order Block). This is a zone where significant institutional selling or buying pressure is believed to have entered the market previously. In this context, the OB is a potential resistance/supply zone that the price may retest.
Liquidity ($$$): Two levels above the current price are marked with $$$. These represent liquidity pools, which are areas where stop-loss orders from short sellers or buy-stop orders from breakout traders are likely resting. Institutional traders often target these zones to fuel their own trades.
The first $$$ (around 3,990) is an immediate target or a minor swing high.
The second $$$ (around 4,010-4,015) is a higher target, representing a more significant swing high.
Proposed Trade Scenario: The solid black line and the dotted arrow show the projected price path:
A retracement (pullback) into the Order Block (OB) zone (around 3,960 - 3,975).
A reversal within or near the OB, leading to a rally (buy/long).
The price targets are the liquidity ($$$) levels.
Current Price Action: The price is currently around 3,937.83, which is below the main Order Block, suggesting the price has already reacted to the BOS and is deep into a decline. The anticipated setup is a counter-trend move (a bullish reaction after a bearish move) or a re-accumulation phase before a larger move.
