Support and trend line coincide, pullback to buy.#XAUUSD OANDA:XAUUSD TVC:GOLD
So far, gold has failed to break out of the converging triangle boundary to choose a clear trading direction, but as time goes on, the price is gradually approaching the end of the triangle, and the battle between bulls and bears may come to a critical decision during the NY session. Looking at the hourly chart, multiple attempts to break through the 4000 resistance level have failed, confirming the pressure above, and gold prices may see further pullback in the short term. The support zone below coincides with the upward trend line, which may be the key area for gold to test during a pullback. Therefore, continue to pay attention to the support level of 3970-3960. If the price retraces to the support level during the NY session and does not break down, you can try to go long on gold with a small position.
Xauusdanalysis

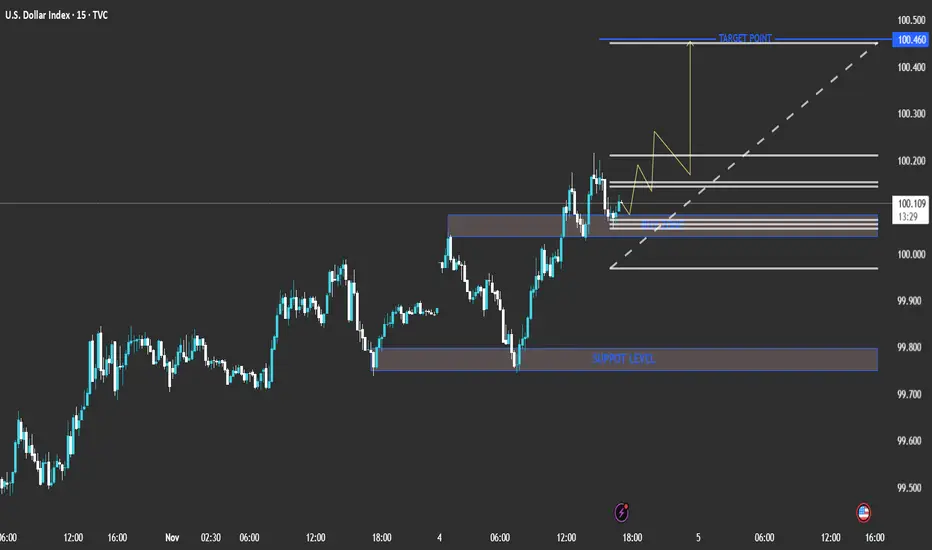
technical analysis of the chart you shared (U.S. Dollar Index Current Price: 100.112
Bias: Bullish short-term
Timeframe: 15-min
The chart shows a clear bullish structure with higher highs and higher lows forming. The price recently bounced from a minor support zone around the 100.00 level and is showing momentum to the upside.
📊 Key Levels
Support Level: 99.750 – 99.850 (major zone from previous lows)
Buy Zone: 100.000 – 100.050 (minor support/entry zone)
Target Point: 100.460
⚙️ Analysis Summary
Price has broken above short-term resistance and is now retesting the buy zone, suggesting a possible continuation higher.
The ascending trendline (dotted white line) supports this bullish bias.
The yellow zigzag projection indicates expected consolidation before a push upward.
🎯 Trading Plan (Based on Chart Setup)
Entry Zone: Around 100.000 – 100.050
Stop Loss: Below 99.900 (below structure support)
Take Profit: 100.460 (target zone)
Risk/Reward Ratio: Approximately 1:3
🔍 Conclusion
The chart suggests a short-term bullish scenario for DXY (U.S. Dollar Index). A successful bounce from the 100.00 zone could lead to a move toward the 100.46 target point. However, a break below 99.90 would invalidate the setup and shift bias to neutral or bearish. TVC:UKX FTSE:UKX FTSE:MCX FTSE:FBMKLCI FTSE:AIM1 FTSE:ASX FTSE:NMX FTSE:AW01 FTSE:JAPAN FTSE:GEISAC FTSE:FBM100 FTSE:AIM5 CBOEEU:BUK100P FTSE:XIN0 FTSE:AXX FTSE:XIN0U
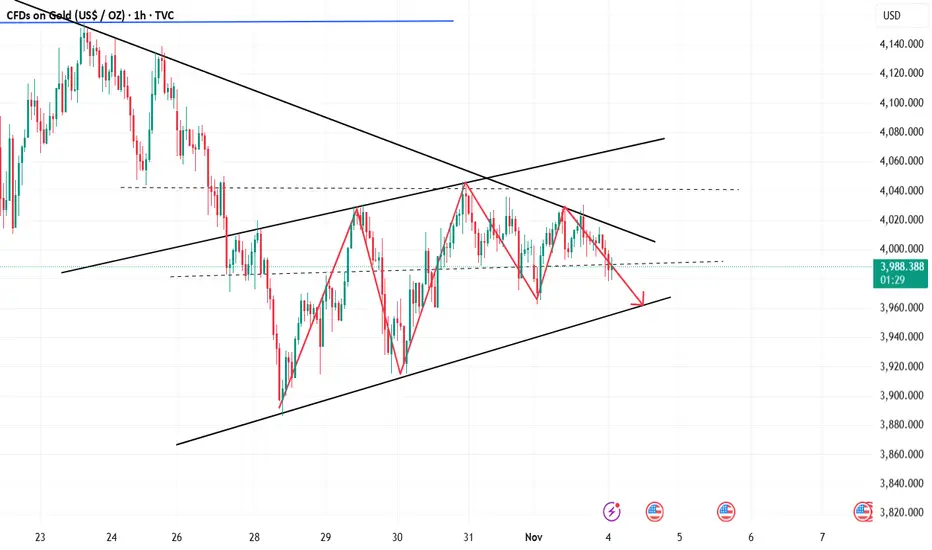
Gold faces key resistance at 4030; continue shorting on rallies.Gold is currently in a consolidation phase, moving back and forth, constantly pulling and tugging. This has been the typical gold price action for a considerable period after major price movements, so it's important to get used to this rhythm. Don't assume a significant surge is imminent just because the price rises; this is currently just a corrective rebound. The overnight short position at 4020 yielded the expected profit. The article explicitly advised shorting, and gold ultimately fell as predicted. Continue to short on any rebounds during the Asian session.
Gold is still consolidating on the 1-hour chart, without a clear directional breakout. Current rebounds present opportunities to short. Multiple attempts to break through resistance levels haven't resulted in a significant upward breakout, indicating insufficient bullish momentum and a generally bearish bias. The 4030 level is a key resistance point. Until a strong, one-sided trend emerges, shorting at the trendline resistance is advisable. Only a break above 4050 could bring a bullish resurgence.
Gold's consolidation without breaking below 3960 suggests a possible trap for long positions. If this continues, a further collapse in gold prices is quite possible. Traders need to be adaptable to these situations. In terms of trading strategy, it is recommended to open a short position at 4000. If there is a strong upward movement, pay further attention to 4020-4030 to continue shorting. On the downside, focus on the 3930-3900 range.
XAU/USD (Gold) 15-Min Chart AnalysisCurrent Price: $4,005
Resistance Zone: $4,020 – $4,040
Gold is approaching a strong resistance area that previously triggered a pullback.
Trend Structure:
The market is moving inside a short-term ascending channel, but momentum shows signs of exhaustion near the upper boundary.
Key Observation:
A false breakout or rejection at the resistance could initiate a downward correction.
Bearish Signal Setup:
Entry Zone (Sell): $4,015 – $4,035 (look for rejection candles or bearish engulfing near resistance)
Target 1: $3,960
Target 2 (Main Target): $3,913
Stop Loss: $4,045 above resistance zone
Risk/Reward Ratio: Approx. 1:2.5
Confirmation:
Wait for bearish confirmation candle on 15M or 30M timeframe.
Break below $3,980 will strengthen bearish momentum toward target.
Signal Summary (📉 Sell Setup):
Direction Entry TP1 TP2 SL
🔻 SELL 4,015 – 4,035 3,960 3,913 4,045 TMX:SXF1! TMX:CRA1! TMX:SXA1! TMX:FHO1! TMX:CGF1! TMX:CGZ1! TMX:FBA1! TMX:FSH1! TMX:SXM1! TMX:SXM1! TMX:FFL1! TMX:FOP1! TMX:FRW1! TMX:FFV1! TMX:FEQ1! TMX:FRQ1!

XAU/USD Technical Analysis – Bearish Rejection at ResistanceXAU/USD) is currently trading around the $4,009 level after rebounding from a recent intraday low. The price action shows a clear rising channel structure, with the upper boundary acting as a significant resistance zone near $4,040 – $4,050.
The chart highlights a resistance level where price has repeatedly failed to sustain upward momentum, indicating a potential double-top or distribution pattern forming in this area.
If price fails to break and hold above the $4,020 – $4,040 resistance zone, bearish momentum may resume, potentially pushing gold toward the $3,950 area initially, followed by a deeper correction to the target level near $3,913.
Conversely, a decisive breakout and close above $4,050 could invalidate the bearish outlook, opening the way for further bullish continuation.
Key Levels:
Resistance Zone: $4,020 – $4,050
Immediate Support: $3,990
Target Level: $3,913
Trend Bias: Short-term bearish under resistance
Conclusion:
Gold is approaching a critical resistance area, and a rejection could confirm a short-term bearish reversal pattern. Traders should watch for confirmation near $4,020–$4,040 for potential short entries targeting $3,913. CME_MINI:NQ1! CME_MINI:MNQ1! CME_MINI:ES1! CME_MINI:MES1! COMEX_MINI:MGC1! CBOT_MINI:YM1! NYMEX:CL1! CME:BTC1! COMEX:SI1! NSEIX:NIFTY1! CME_MINI:RTY1!

Gold breaking through this signal could see it reach the $4,000 Gold experienced a sharp drop in the short term, retreating to the support area of 3928 and reversing. The current upward pressure is in the 3977-3989 USD area, which is the key area for short-term gains. If this area is broken, it will once again stand above the 4000 USD mark.

SELL XAUUSD (GOLD) - Great trade opportunityGOLD (XAUUSD) has been in a downtrend lately and has been showing many signs of more bearish movements ahead. Gold is currently in a clear downtrend channel shown on the chart, it has also broken a powerful support level and recently broken the yellow trendline which acted as the last support level near the current price. Gold is likely to hit the next support zone which is shown as the take profit level on the chart. Time to sell!

GOLD | Daily Analysis #4 - 4 November 2025Hello and Welcome back to DP;
Review and News Coverage:
Wow — what a strong downside move! I hope you all managed to capture some profits from this fall. But is it over yet? Personally, I don’t think so. We might see another leg down, possibly tomorrow, due to the upcoming high-impact news releases.
The key events to watch are:
• NFP (Non-Farm Payrolls)
• ISM PMI
Both of these are known to bring significant volatility to the market, so stay alert and manage your risk carefully.
1H Time Frame Technical Analysis:
As shown on the chart, price broke the uptrend and fell through the 3927 area. I believe the price could continue lower, potentially reaching 3914, which aligns with a strong demand zone where buyers may step in.
That’s it for today — the rest of the details are clearly illustrated in the chart.
Summary:
Key Levels:
Support: 3914 (demand zone)
Resistance: 3927 (previous support turned resistance)
Outlook: Possible further decline before rebound (Looking For Buy)
Key Events: NFP & ISM PMI (expect high volatility)
Disclaimer:
This content is for informational purposes only and does not constitute financial or investment advice. © DIBAPRISM
Amir D.Kohn

Gold (XAUUSD) – 3 Nov | Watching M30 Demand Zone (3935–3915.6)🟡 Gold (XAUUSD) Analysis – 3 November
Hello Disciplined Traders,
Welcome to the Chart Is Mirror Community 👋
Market Context
• Gold remains in a downtrend on H4 following a bearish structure shift (CHoCH).
• After this shift, a pullback phase has started as M15 showed a bullish CHoCH followed by a BoS — indicating that M15 is currently uptrend aligned with the H4 pullback.
• As per the present M15 structure, the Higher Low (HL) sits at 3915.6 and the Higher High (HH) at 4046.6 .
Key Observations
• We will look for short-term long opportunities as long as the M15 bullish structure remains intact.
• The M30 demand zone 3935 – 3915.6 is a strong POI and potential reaction zone for intraday long setups.
• A breakout below 3915.6 will confirm a bearish structure shift, invalidating this demand zone for longs.
Execution Plan
• If price retests 3935 – 3915.6 and respects it with LTF bullish confirmation , we will execute our long setup accordingly .
• For selling opportunities, we will monitor the 4132 – 4162 supply zone and only consider shorts on confirmation.
• The market remains volatile — manage your position size and risk accordingly .
Wait for clarity — reaction reveals direction.
📘 Shared by @ChartIsMirror

Gold price analysis April 11XAUUSD — Gold retains bullish structure within the price channel
Gold is currently moving in the lower half of the rising price channel, showing that buying power is quietly accumulating. The main trendline continues to play an important support role, maintaining the current uptrend.
The key level 4033 is still an important confirmation level for buyers — when the price closes stably above, the uptrend can be more clearly consolidated.
Trading strategy in this period still prioritizes BUY:
BUY around the trendline: around 3980
BUY when the price breaks through the resistance of 4033 (confirms breakout)
🎯 Target: 4100
⚠️ Risk: If the trendline is broken, the scenario of a deep drop to the support zone of 3800 needs to be considered.
Overall, the price structure is still inclined to the uptrend, only when the price channel is completely broken will the trend reverse.

XAU/USD - Setup Analysis / Bullish ReversalPrice has recently swept the Previous Day’s Low (PDL), a key swing point often associated with potential reversal zones.
However, the current structure suggests that price may continue its liquidity run, targeting the Previous Week’s Low (PWL) and the unfilled weekly Fair Value Gap (FVG) positioned just below.
Upon completion of this liquidity sweep and mitigation of the weekly imbalance, a reversal is anticipated.
The projected draw on liquidity aligns with the unfilled H1 order block on the buy-side, in confluence with an engineered liquidity pool formed around the Previous Day’s High (PDH) and the London Session high.

Gold Approaches 3960 Support After Failing at 4030Yesterday, I highlighted that Gold appeared slightly bullish, forming an ascending triangle with resistance around the 4030 zone. Early in the day, Gold did indeed rise and tested this resistance again. However, after the futures market opened, momentum started to fade, and the price began fluctuating around the 4000 level.
As we entered the Asian session, the bears took control, and Gold is now testing the 3970 level, approaching the key 3960 support, which aligns with yesterday's low.
If we see a break below this support, the next key levels to watch are 3915, a zone where Gold experienced significant reactions last week, and even 3890.
On the flip side, any stabilization above the 4000 level could shift the bias back to bullish.
Key Points:
- Downside: Break below 3960 opens 3915 and potentially 3890.
- Upside: Only stabilization above 4000 would suggest a bullish shift.
🚀 Let's see if Gold can make a move today, but remember, volatility remains extremely high and 3-400 pips means nothing for Gold nowadays

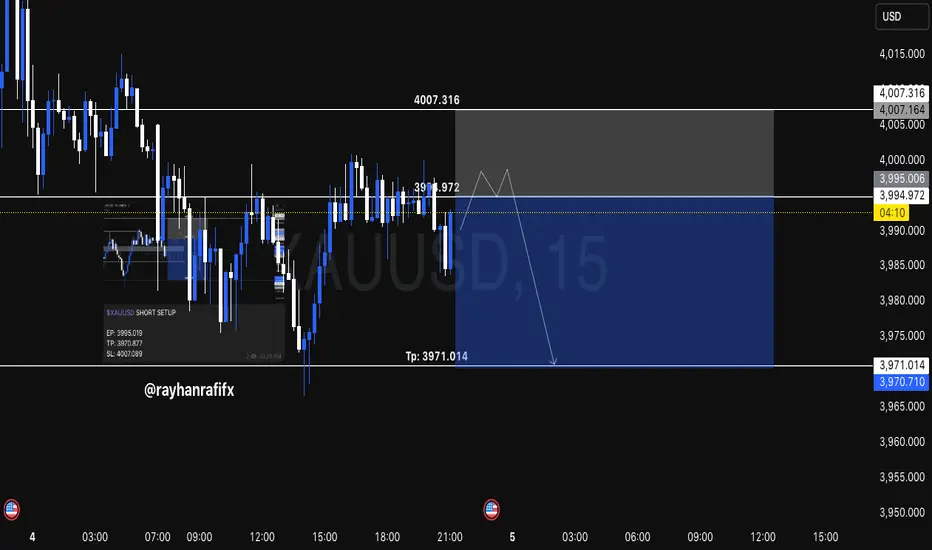
XAUUSD SHORT SETUP INTRADAY ( NOV 04, 2025 )If you have doubt on our trades you can test in demo.
OANDA:XAUUSD SHORT SETUP
EP: 3995.019
TP: 3970.877
SL: 4007.089
Trade Ideas:
Idea is clearly shown on chart + we have some secret psychologies and tools behind this.
Trade Signal:
I provide trade signals here so follow my account and you can check my previous analysis. So don't miss trade opportunity so follow must.
XAUUSD - Signal#XAUUSD - Signal
H4 - Formation of the 3rd wave + breakout of the trend line. Stop behind the high of the 1st wave.
Entry: 3991.571 - *3960.969
TP: 3891.217 - 3789.015 - 3727.505 - 3630.034
Stop: 4049.512

GoldXAUUSD
- Symmetrical Triangle as an corrective pattern in Long Time Frame
- RSI - Divergence
- Change of Characteristics
- Falling Wedge in Short Time Frame
- Fair Value Gap

XAUUSD LONG SETUP INTRADAY ( NOV 04, 2025 )If you have doubt on our trades you can test in demo.
Details:
Entry: 3981.277
Target Price: 4005.181
Stop loss: 3969.178
Trade Ideas:
Idea is clearly shown on chart + we have some secret psychologies and tools behind this.
Trade Signal:
I provide trade signals here so follow my account and you can check my previous analysis. So don't miss trade opportunity so follow must.

GOLD XAU/USD: Wave ((1)) Near Completion - Wave 2 Zigzag vs Flat GOLD: WAVE ((1)) COMPLETE - WHAT'S NEXT?
Wave ((1)) nearly finished at ~$3,989. Next: Wave ((2)) correction
to the $4,250 area. But which pattern?
━━━━━━━━━━━━━━━━━━━━━━━━━━━━━━━━━━━━
ZIGZAG (60% Probability) Pattern: A-B-C (sharp, V-shaped)
• Wave (A): Sharp 1-2-3-4-5 impulse
• Wave (B): Brief recovery (~30-40% of wave A)
• Wave (C): Sharp impulse (~equal to A or 1.618x A)
━━━━━━━━━━━━━━━━━━━━━━━━━━━━━━━━━━━━
FLAT (40% Probability) Pattern: A-B-C (sideways consolidation)
• Wave (A): Moderate move
• Wave (B): Recovery that reclaims wave A (~80-120% of A)
• Wave (C): Normally sharp 1-2-3-4-5 impulse (~50-120% of A)
If price retraces 100% of wave 1 (above $3,956) Structure INVALID
MY BIAS: ZIGZAG
Wave 1 was powerful → Sharp corrections follow
Support: $3,956 (invalidation level)
Resistance: $4,150 - $4,200 - $4,250
IMPORTANT ELLIOTT WAVE RULES FOR WAVE 2:
━━━━━━━━━━━━━━━━━━━━━━━━━━━━━━━━━━━━━━━━
✓ Wave 2 CANNOT retrace more than 100% of wave 1 (invalidation rule)
✓ Wave 2 CANNOT be a triangle (only B and (iv) can be triangles)
✓ Wave 2 CANNOT be a combination beginning with a zigzag
(combinations only if starting with a flat)
These rules help us eliminate possibilities and confirm structure.

gold still bearish#XAUUSD price have multi reject the 3999 limit which shows bearish strength is still strong. Now we await for breakout below 3988 to sell.
3988 sell stop, target 3948, stop loss 4000.
Above the 4006-10 on M15-H1 closures shows bullish continuation, target 4028-35

How to keep up with the rhythm of triangle pattern consolidation#XAUUSD OANDA:XAUUSD TVC:GOLD
Gold prices stalled at higher levels yesterday, mainly due to Federal Reserve officials' cautious stance on a December rate cut, which boosted the dollar and dampened enthusiasm for gold's rise. Judging from the current trend, the market is in a converging triangle pattern. The daily MA5 is around 3987, and the MA10 is around 4021. It can be seen that the range between these two points is very small, indicating that the market is also preparing to break out and choose a major direction. Once the gold price breaks out of the triangle pattern and chooses a direction, the daily chart's trendline will widen. Therefore, the key resistance level to watch is 4020-4030, while the key support level is 3970-3960. The European session is expected to trade within a range in the short term. Before a successful breakout, pay attention to the resistance level of the middle band on the hourly and 4-hour charts at 3995-4000. If the price touches the resistance level on the first attempt and fails to break through, a small short position can be considered.
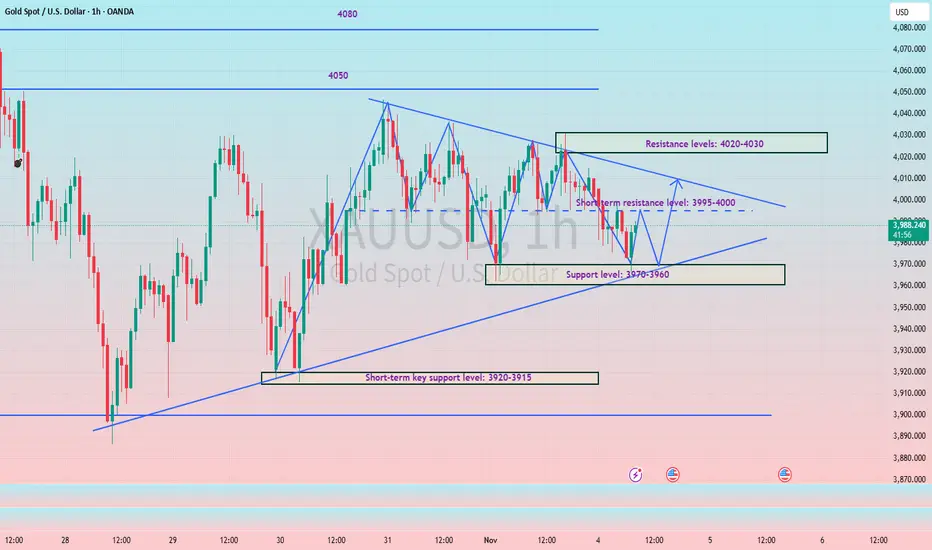
Gold Remains Range-Bound — Focus on Selling ReboundsAs time passes, the 4-hour moving average resistance continues to shift lower, with the key resistance area now around 4004/4030. From the current candlestick structure, bearish momentum still dominates. On the daily chart, the MA30 serves as the crucial pivot level, while MA20 can be used to gauge broader trend direction. In other words, only a firm hold above the MA30 would give bulls a chance to compete, and a full trend reversal would require a confirmed breakout above the MA20.
Key short-term support remains at 3948-3921, followed by the previous low near 3885. If these levels fail to hold, attention should shift to the 3800 psychological level and support from the daily MA60.
On the news front, geopolitical tensions continue to escalate, which has provided some safe-haven demand for gold. However, given the strong rally over the past two months, gold’s traditional safe-haven appeal has weakened, and volatility has increased, giving it characteristics closer to a risk asset at times. Therefore, geopolitical factors should be referenced cautiously, with primary focus remaining on core price structure and trading logic.
Meanwhile, uncertainty around whether there will be a rate cut in December also contributes to the current consolidation. Until there is clear direction, trading should remain cautious—focus on opportunities you clearly understand and avoid greed. When the market structure becomes unclear, stay patient and reduce unnecessary trades to manage risk.

Gold (XAUUSD) Pullback Analysis: Testing OB Before TargetsA potential trading setup based on concepts from Smart Money Concepts (SMC) or similar institutional methodologies.
Asset and Timeframe: XAU/USD (Gold Spot / US Dollar) on a 1-Hour (1H) timeframe.
Current Price: The price is hovering around $3,983.55.
Market Structure:
There's a recent Break of Structure (BOS), suggesting an upward bias or a shift in momentum to the bullish side.
The price is currently pulling back into a key zone.
Key Zones/Concepts:
OB (Order Block): The shaded gray area is identified as an Order Block. This is a zone where significant institutional buying/selling previously occurred, and the price is expected to react to it.
$$$ (Liquidity/Equal Lows): The three dollar signs indicate an area of liquidity or equal lows below the current price action. These are often targeted for a stop-hunt or liquidity grab before a significant move.
1H / BPR (Balance Price Range): The lower green box is labeled as a 1H / BPR. A Balance Price Range is a more refined area of support/demand, suggesting an even stronger reaction zone if the initial OB fails.
Projected Trade Scenarios: The dotted lines outline two primary possibilities:
Bullish Scenario (Solid Line): A bounce from the OB (Order Block) to hit Target 1 ($4,030.00).
Bearish/Liquidity Grab Scenario (Dotted Line): A drop below the OB to sweep the $$$ (Liquidity), potentially testing the 1H / BPR before a sharp reversal back up to Target 1 or even Target 2 ($4,050.00).

Gold looking for another mega bullish This XAU/USD (Gold vs USD) 2-hour chart shows a consolidation phase between the support zone around 3,922 – 3,886 and the resistance level near 4,039 – 4,153. The price is currently trading near 3,994, indicating indecision before a potential breakout.
If gold holds above the support area, the chart suggests a possible bullish breakout above resistance, leading to a continuation toward the long-term target at 4,376. The upward arrows outline a projected move with minor pullbacks, showing step-by-step momentum building toward the target.
In summary, as long as price remains above support, the bias stays bullish, with confirmation coming from a clear breakout above the 4,040–4,150 resistance zone.

XAU/USD: Powell vs. The Discount ZoneHey traders! Gold (XAU/USD) is caught in a fierce battle: a hawkish Fed is boosting the USD, while the risk of a US government shutdown offers support to Gold.
📰 Key Fundamental Drivers:
The Fed & Powell: Interest rates are likely to remain high (Hawkish stance), pushing the USD stronger and applying DOWNWARD pressure on Gold.
US Government Shutdown: The economic risk could limit the USD's rally, providing support for Gold (the safe-haven asset).
📉 Technical Analysis:
Price is currently moving within a Rising Wedge (a bearish reversal pattern) and heading towards a critical Strategic Support Zone (Discount Zone).
🔥 Strategic Support Zone (The Discount Zone): $3,941 - $3,953. This is an attractive price area to look for a Buy (Long) opportunity with a good risk/reward ratio.
Major Resistance Zone: $4,004 - $4,025.
🎯 Two-Sided Strategy:
1. The Bullish Scenario:
Action: Wait to BUY (LONG) when the price hits $3,941 - $3,953 and shows a strong reversal signal.
Target: $4,004 - $4,025.
2. The Bearish Scenario:
Action: SELL (SHORT) if price is strongly rejected at $4,004 - $4,025 OR if price breaks decisively below $3,941.
Target: Below $3,900.
🚨 Warning: Keep a close watch on comments from FOMC members this week to properly position your risk.
#xauusd #forex #powell #fomc #technicalanalysis #gold #usd #discountzone #tradingview
