XAU/USD Daily Structure – Bullish Reversal Targeting BPR ZoneA potential bullish reversal after a recent pullback, aiming for a retest of higher price levels.
Prior Price Action: The price experienced a strong uptrend (sequence of large green candles) leading up to the mid-October high, followed by a sharp pullback (red candles) which broke below a previous low, labeled as BOS (Break of Structure). This BOS confirms a short-term bearish shift or the start of a deep correction within the larger uptrend.
Current Price Level: The price is currently near $4,008.10, having shown recent bullish momentum (the last green candle) off a recent swing low.
Key Levels and Concepts:
D/FVG (Daily Fair Value Gap): There are two Fair Value Gaps marked on the chart.
The lower D/FVG (around $4,000 - $4,060) acted as an initial target or point of interest during the decline. The price has started to move up from this area.
The upper D/FVG (around $4,170 - $4,220) represents a future potential target.
BPR (Balanced Price Range): This blue area (around $4,160 - $4,180) is an area where a previous down move's FVG overlaps with a subsequent up move's FVG (or vice versa), suggesting a zone where the market might find temporary balance or resistance/support.
Projected Path: The black arrow illustrates a bullish projection. The price is expected to continue its upward move, potentially targeting the lower D/FVG for a re-entry/retest before making its way towards the BPR and the upper D/FVG as the final target of this short-term analysis.
Xauusdanalysis

GOLD (XAU/USD): Bulls Eye $4,125 – Breakout Imminent?Gold dropped to a significant horizontal support level last week.
The price subsequently rebounded from this level, forming a rising triangle pattern on a 4-hour timeframe.
The neckline of this triangle is defined by an intraday horizontal resistance.
Its bullish violation (4H candle close above) can be a nice trigger to buy Gold with a confirmation.
Should this occur, a bullish continuation towards 4125 would be anticipated.
Conversely, a bearish movement and a break below the vertical support level could potentially lead to a further decline in price.

XAU/USD Analysis — Awaiting Breakout Confirmation for Bull Entry🏆 XAU/USD GOLD vs U.S. DOLLAR 🏆
📊 Swing/Day Trade Opportunity Guide
🎯 THE THIEF STRATEGY SETUP
Market: Precious Metals | Pair: XAU/USD (Spot Gold)
Timeframe: Multi-Timeframe Confirmation
Strategy Type: Breakout + Dynamic Support/Resistance
💡 BULLISH CASE CONFIRMED ✅
The bulls are on patrol! 🚨 Multiple confluences suggest an upside move:
✨ LSMA (Least Squares Moving Average) acting as dynamic support with multiple touch confirmations — classic reversal signal for swing traders. The metal is respecting this lower boundary like a fortress wall.
⚠️ Breakout Confirmation Required: Watch for a decisive close above 4,060.00 — this level marks a critical moving average resistance zone. Once breached, this becomes our green light for layered entries.
💰 ENTRY STRATEGY: "THE LAYERING THIEF METHOD" 💎
Instead of FOMO-ing into one position, we deploy the layered entry approach — multiple limit orders like a professional accumulator:
📍 Buy Limit Layers (After Breakout Confirmation):
Layer 1️⃣: 3,920.00 ← Initial dip catch
Layer 2️⃣: 3,960.00 ← Continuation entry
Layer 3️⃣: 4,000.00 ← Mid-zone accumulation
Layer 4️⃣: 4,040.00 ← Final confirmation level
⚡ Pro Tip: Scale these layers based on your account size and risk tolerance. You can add more layers every $20-$40 intervals.
🔔 CRITICAL:
✋ Wait for breakout confirmation above 4,060.00 before placing any buy orders. Premature entries = Stolen profits going nowhere! ❌
🛑 STOP LOSS (Risk Management)
Thief SL Level: 3,880.00 🎯
This is where the heist ends if the plan fails. Close below this support = Exit the building! 🚪
⚠️ Disclaimer Note: This stop loss is suggested as a reference point. Your SL placement depends on your risk appetite, account size, and trading personality. We're not financial advisors — only fellow traders sharing our playbook! Trade at your own risk. 💪
🎪 PROFIT TARGET: "THE POLICE BARRICADE" 🚔
Target Zone: 4,360.00 🏁
Why this level? Multiple reasons converge here:
📈 Strong historical resistance acting as a "police barricade"
🔴 Overbought conditions signal potential pullback territory
⚠️ Trap zone detected — this is where smart money takes profits!
Strategy: Scale out your positions as price approaches this zone. Don't get greedy and lose the win!
⚠️ Disclaimer Note: This profit target is OUR suggested zone, but YOU decide when to take profits. The choice is yours — stack those wins or hold for more. No financial advice here, just trading wisdom shared among Thief OG's! 🎩
🔗 CORRELATED PAIRS TO MONITOR 📡
Watch these related instruments for confluence signals:
💵 USD Index ( TVC:DXY ) — Inverse relationship with gold. If DXY weakens → XAU/USD strengthens. Monitor for divergence opportunities.
🏦 SPX500 ( CAPITALCOM:US500 ) — Risk sentiment indicator. Rising stocks = potential gold weakness. Use as confirmation filter.
FX:EURUSD — EUR strength = potential gold support. Cross-market divergences often precede major moves.
FX:GBPUSD — Pound weakness often correlates with gold rallies. Track for multi-timeframe alignment.
TVC:US10Y (10-Year Treasury Yield) — Inverse correlation. Rising yields = headwind for gold. Monitor daily for macro context.
📋 QUICK CHECKLIST ✅
Confirm LSMA support holds
Wait for 4,060.00 breakout confirmation
Place layered buy limits at 3,920/3,960/4,000/4,040
Set stop loss at 3,880.00
Scale profits into 4,360.00 resistance zone
Monitor correlated pairs for confluence
Respect risk management — never exceed 2% per trade
🎬 THE BOTTOM LINE 🎬
Gold is setting up for a potential swing trade move. The LSMA support is holding, and a breakout above 4,060.00 could trigger a run toward 4,360.00. Use the layering strategy to build positions methodically, protect capital with your chosen stop loss, and exit into resistance zones.
This is a confluence-based breakout play — not a guarantee, just probability on our side. 🎲
✨ If you find value in my analysis, a 👍 and 🚀 boost is much appreciated — it helps me share more setups with the community!
#XAU/USD #GoldTrading #TradingStrategy #SwingTrade #DayTrading #ForexAnalysis #TechnicalAnalysis #ThiefStrategy #LSMA #BreakoutTrading #RiskManagement #TradingCommunity #MarketAnalysis #Commodities #MetalsMarket

GoldXAUUSD
- Bullish Channel as an corrective pattern in Short Time Frame
- RSI - Divergence
- Completed " 12345 " Impulsive Waves and " ABC " Corrective Waves
- Falling Wedge as an corrective pattern in Long Time Frame
- Order Block

XAU/USD Intraday Plan | Range-Bound Before Next MoveGold continues to trade in a tight range, holding just above the MA50 and approaching the MA200, as buyers attempt to regain short-term control. The metal is currently hovering around 4025, with price consolidating below the 4042 resistance — a key barrier that has capped upside attempts in recent sessions.
If bulls manage a clean break above 4042, the next resistance stands at 4090, followed by 4120. However, failure to break higher could see price rotate back toward 3990 and the First Reaction Zone (3957–3918) for potential support.
A deeper pullback below 3918 would shift focus toward the Support Zone (3884–3851) and the HTF Support Zone (3820–3781) — areas where stronger buying interest has previously emerged.
📌 Key levels to watch:
Resistance:
4042
4090
4120
Support:
3990
3957
3918
3884
🔎 Fundamental Focus:
The ongoing U.S. government shutdown, now in its fifth week, has significantly disrupted the release of key economic data, leaving traders with limited insight into the real state of the U.S. economy.
This uncertainty is keeping market sentiment cautious, with investors closely watching the few reports still being released — such as ISM Manufacturing PMI today — for clues on growth and inflation.
The lack of reliable data continues to support safe-haven demand, with gold remaining sensitive to any signs of progress toward resolving the shutdown.

Gold Analysis! Trading Strategy for Next WeekWith just over ten hours until the gold market opens, I'll briefly review last week's market performance and outline my strategy for next week.
On Friday, gold rose to 4046 in the Asian session before encountering resistance and falling back. After retracing to 3990, it tested the trendline resistance level again, before falling back again in the US session, resulting in significant volatility throughout the day.
As mentioned on Friday, the volatile market offers opportunities for both bulls and bears. The key lies in the entry point. If the Asian session rises, the European session retraces and breaks the low, and the US session surges, it's a bull trap. Once the high point appears, go short. We followed this approach and achieved good results.
Gold continues to fluctuate, and next week will be crucial for whether the gold bulls can regain their footing. If gold continues its strong performance on Monday, it is likely that the rebound will continue, but it will be a rebound, and the daily chart of gold will then begin a long period of adjustment.
The gold market will continue to face numerous uncertainties, and the battle between bulls and bears is expected to continue. From a news perspective, a series of important economic data will be released next week, such as the US non-farm payrolls and PMI data. The performance of these data will directly affect market expectations for the US economic outlook, and thus influence gold price movements. In addition, speeches by Federal Reserve officials and developments in the geopolitical situation also require close attention.
Next week, the initial resistance level for gold is expected to be in the $4050-$4070 range. This area represents the previous rebound high and the location of the 5-week moving average, making it a relatively strong resistance level. If gold prices can break through this resistance level, they may further challenge the resistance near $4100. The key support level is at $3950, which is the starting point of this week's rebound and the lower Bollinger Band support on the daily chart. A break below this level could lead to a further decline to around $3900 for support.
Next week's trading plan will be launched soon. If you have any trading questions, please feel free to contact me.
XAUUSD possible bullish for 4140#xauusd 2h time frame structure has been change from lower low to higher high. don't jump into the market blindly. wait for demand zone to be test i.e. low volume pullback, then take long. stop loss below 3885. target: 4140. 3930-3900 is the area of interest for long.

XAUUSD- Trend reversal - New ATH incoming?OANDA:XAUUSD has turned bullish on the daily timeframe after holding key dynamic support and reclaiming the volatility ribbon. The structure now supports continuation toward higher Fibonacci levels, provided price remains above the $3,940 support zone.
Momentum is shifting in favor of buyers, and with strong absorption of previous selling, the bias now leans toward further upside movement.
Bullish Confluences:
Structure Shift: Price has broken above the short-term descending channel, confirming a bullish structure change after forming a higher low near the mid-band support.
EMA / Volatility Ribbon Reclaim: Candles have closed back inside the green volatility ribbon, signaling renewed bullish momentum and a shift in trend sentiment.
Strong Daily Rejection: The recent candle shows a clear rejection wick from the lower volatility band (blue zone), indicating that buyers absorbed selling pressure and stepped back in.
Momentum Turn: Oscillators and momentum tools (if used) confirm upward acceleration, consistent with previous bullish continuation setups.
Support Confirmation: The previous base around $3,920 – $3,940 held firmly as support, creating a foundation for an upward leg.
🎯 Fibonacci Extension Targets (Upside)
Measured from the latest swing low to swing high:
Target 1 (38.2%) → $4,091
Target 2 (61.8%) → $4,143
Target 3 (100%) → $4,210

ElDoradoFx – GOLD SESSIONS ANALYSIS (03/11/2025, LONDON)1️⃣ Market Overview
Gold continues its bullish momentum from the 3,962 weekly low, now trading around 4,018–4,020, with clear signs of accumulation above the 200 EMA. The market remains in an upward correction phase, with intraday structure showing strong recovery and possible breakout above key resistance.
London session focus: whether gold can sustain above 4,023 to confirm a continuation toward 4,036–4,046.
⸻
2️⃣ Technical Breakdown
🟢 Daily (D1)
• The daily candle remains bullish, holding above the 10EMA (≈4,010) and approaching resistance near 4,036.
• RSI at 61, signaling sustained recovery momentum.
• MACD histogram decreasing red volume, hinting at reversal continuation potential.
🟡 H1 (Hourly)
• Price structure: higher lows from 3,962 → 3,985 → 4,000, forming a bullish channel.
• Break of structure at 4,015 with RSI 56+, confirming bullish control.
• Price testing the descending trendline and 200EMA (4,022–4,026 zone).
• MACD momentum positive, suggesting strength for a potential London breakout.
🔵 15M–5M (Intraday)
• Bullish BOS (Break of Structure) confirmed at 4,010; price consolidating below 4,023 liquidity zone.
• RSI 65 → near breakout threshold.
• EMAs aligned bullishly (50EMA > 100EMA > 200EMA).
• MACD showing continued bullish histogram expansion.
⸻
3️⃣ Fibonacci Analysis
Last swing: 3,962 → 4,036
Level Price
38.2% 4,017
50.0% 3,999
61.8% 3,982
🎯 Golden Zone: 3,999 – 3,982
→ Ideal retracement zone for continuation buys if price corrects.
⸻
4️⃣ High-Probability Trade Scenarios
✅ BUY SCENARIO (Main Bias)
Buy Zone: 3,999 – 3,982 (Golden Zone)
Confirmation: 5M–15M bullish CHoCH + RSI >55
🎯 Targets:
• TP1 → 4,023
• TP2 → 4,036
• TP3 → 4,046
• TP4 → 4,060
🛑 SL: Below 3,975
Breakout Buy:
Trigger: Break & retest above 4,023
🎯 Targets: 4,036 → 4,046 → 4,060
🛑 SL: Below 4,010
⸻
⚠️ SELL SCENARIO (Countertrend)
Sell Zone: 4,023 – 4,036 (Liquidity trap + 200EMA rejection)
Confirmation: RSI divergence + rejection candle on 15M
🎯 Targets:
• TP1 → 4,008
• TP2 → 3,995
• TP3 → 3,982
🛑 SL: Above 4,046
Breakout Sell:
Trigger: Break below 3,975
🎯 Targets: 3,962 → 3,945
🛑 SL: Above 3,990
⸻
5️⃣ Fundamental Watch
• UK Manufacturing PMI early volatility may drive session movement.
• US ISM Manufacturing PMI and Fed Williams speech later today could bring sharp USD reactions.
• DXY hovering near 106.10, slightly weakening — bullish bias for gold if this continues.
⸻
6️⃣ Key Technical Levels
Type Levels
Resistance 4,023 / 4,036 / 4,046 / 4,060
Support 4,008 / 3,995 / 3,982 / 3,962
Golden Zone 3,999 – 3,982
Break Buy Trigger > 4,023
Break Sell Trigger < 3,975
⸻
7️⃣ Analyst Summary
Gold continues its bullish recovery from the 3,960 zone and is currently testing structural resistance at 4,023.
A confirmed breakout and retest above 4,023 would open the path to 4,036–4,046, while a failure at this level could lead to short-term retracement toward 3,995–3,982 (Golden Zone) before continuation.
⸻
8️⃣ Final Bias Summary
• Primary Bias: 🟢 Bullish above 4,008 → Target 4,036–4,046
• Secondary Bias: 🔴 Bearish below 3,975 → Target 3,962–3,945
• Volatility: Moderate → may increase around PMI data.
⸻
— ElDoradoFx PREMIUM 3.0 Team 🚀

Gold Congestion: Clear Levels, Unclear DirectionAfter forming a local low at 3887 last week — a level perfectly aligned with the October ATH area — OANDA:XAUUSD started to recover from the recent 5k pips decline, retesting the 4050 resistance zone, which previously acted as strong support.
Since mid-last week, price action has entered a consolidation phase. Despite high intraday volatility, the structure is beginning to compress into a clear congestion pattern.
This range, roughly 1k pips wide, provides traders with well-defined reference points:
- Support: 3950–3960 zone – a break below this area would likely reopen the path toward the recent 3887 low.
- Resistance: 4040–4050 zone – a confirmed breakout above could trigger a continuation toward 4150.
At this stage, I am slightly bullish, given the sharp rejections from 3920 last week and the emerging ascending triangle structure, which often precedes upward continuation.
Still, confirmation is required — the market must decide whether this congestion is accumulation or distribution.

LiamTrading - $XAUUSD$: Second Scenario – BUY Priority After...LiamTrading - OANDA:XAUUSD $: Second Scenario – BUY Priority After BREAKING $4002$
With Support from the U.S. Treasury Secretary
Hello traders community, LiamTrading is back with a detailed analysis of OANDA:XAUUSD $ for the start of the week!
The Gold market is receiving strong support from policy: U.S. Treasury Secretary Scott Bessent calls on the Fed to continue cutting interest rates as PCE inflation is currently at $2.7\%$.
This call, aimed at reducing mortgage rates and supporting the housing market, strengthens the long-term outlook for Gold.
Technical Analysis: We prioritize continuing to buy in line with the main trend. The best strategy is to enter at strong resistance/support zones to ensure the lowest risk.1.
📰 MACRO FUNDAMENTALS: CALL FOR RATE CUT
Impact: The Treasury Secretary's statement on cutting interest rates to support the "transitioning" economy increases expectations for policy easing, which is a strong support factor for Gold (though not yet an official decision).
Suitable Strategy: Market sentiment is being driven by expectations of policy easing, reinforcing the priority for a BUY (Long) position.
📊 TECHNICAL ANALYSIS: IMPORTANT PIVOT POINT
Resistance Zone $4002$: This area acts as an important pivot point.
Buy Entry will be activated after the price breaks $4002$ and retests.
Sell Entry: Look for short-term scalping at the resistance zone $4030$ to secure profits. Highlighted Zone: Prioritize entries at confirmed Trendline zones.
🎯 DETAILED TRADING PLAN (ACTION PLAN)
We will wait for Gold to break structure and create a BUY setup.
🟢 Main BUY Scenario (BUY Break & Retest)
Logic: Buy at $4002$ after breaking resistance and retesting, leveraging new upward momentum.
Entry (BUY): $4002$
SL: $3995$ (tight SL)
TP1/TP2: $4020$ | $4035$
TP3: $4070$
🔴 SCALPING SELL Scenario (SELL Scalping)
Logic: Short-term scalping at the strong resistance zone $4030$ (near Sell Liquidity zone).
Entry (SELL): $4030$
SL: $4038$
TP1/TP2: $4015$ | $4004$
TP3: $3990$4.
📌 SUMMARY & DISCIPLINE (Liam's Note)
Our BUY strategy is reinforced by policy outlook and technical breakout at $4002$. Strictly adhere to SL $3995$ to manage risk before the upward structure is confirmed.
Are you ready for Gold's movement at $4002$? Please LIKE and COMMENT!

Elliott Wave Analysis – XAUUSD | November 3, 2025
🔹 Momentum
D1 Timeframe:
Daily momentum is currently rising and approaching the overbought zone.
At the current pace, it is expected that within 2–3 more D1 candles, momentum will reach the overbought area — increasing the risk of a potential reversal.
However, in the short term, the bullish trend still dominates.
H4 Timeframe:
H4 momentum is reversing upward, and if a strong bullish candle breaks above the 4028 resistance level, it will confirm a bullish reversal, potentially leading to a 5-candle H4 uptrend within today’s session.
H1 Timeframe:
H1 momentum is preparing to turn downward, suggesting a short-term pullback may occur before the next upside continuation aligned with the broader H4 trend.
________________________________________
🔹 Wave Structure
D1 Timeframe:
Current data still supports the scenario that the market is forming Wave (4) in yellow.
However, more time is needed for a clear confirmation.
If D1 momentum enters the overbought zone without price creating a new high, that would give us additional confirmation of this wave count.
In the short term, price may continue rising for another 2 days.
H4 Timeframe:
The scenario of Wave (4) in purple within Wave (3) in yellow remains valid and has not been invalidated.
If price breaks above the 4379 high, it would confirm the formation of Wave (5) in purple, signaling the start of a strong bullish move.
At present, price movement remains choppy and overlapping, showing no clear trend direction — hence, we need to monitor price action closely.
With H4 momentum turning upward and resistance around 4028 forming a symmetrical triangle pattern, I expect a bullish move of 4–5 H4 candles today.
A decisive breakout above 4028 would further reinforce this bullish scenario.
H1 Timeframe:
The current H1 structure may be forming either:
• Wave X within the larger D1 structure, or
• Wave (5) in purple within the H4 structure.
In either case, we can expect a short-term upward move in line with H4 momentum.
Currently, price is hovering around the 4017 resistance zone, while H1 momentum is preparing to turn downward — therefore, a short-term correction toward the 3953 liquidity zone is expected.
This area will serve as a potential buy zone.
________________________________________
🎯 Trading Plan
• Buy Zone: 3954 – 3952
• Stop Loss: 3944
• Take Profit 1: 4050

Gold Price Outlook – Trade Setup (XAU/USD)📊 Technical Structure
Gold extends its decline toward $3,965, remaining under pressure below the $4,008–4,012 resistance zone. The $3,958–3,963 support area now acts as the next line of defence, with price hovering just above this key level. A rejection from resistance could trigger a continuation lower toward $3,945, while a sustained break above $4,012 would invalidate the bearish bias and shift focus toward $4,030.
🎯 Trade Setup
Entry: $4,008 – $4,012 (resistance retest)
Stop Loss: $4,017
Take Profit: $3,963 / $3,958
Risk-Reward Ratio: ≈ 1 : 5.33
🌐 Macro Background
Gold prices fell to around $3,965 in early Asian trading as U.S.–China trade optimism and hawkish Fed remarks weighed on safe-haven demand. According to FXStreet’s Lallalit Srijandorn, “A constructive U.S.–China outcome reinforces risk appetite, pressuring Gold prices lower.” 【FXStreet】
Trade Relief: U.S. President Donald Trump reduced tariffs on China to 47% (from 57%) after an agreement with Chinese President Xi Jinping to suspend rare earth export controls and boost American soybean purchases.
Fed Stance: Fed Chair Jerome Powell reiterated that further rate cuts are “not a foregone conclusion”, signalling a cautious stance. Markets still price in a 63% chance of a December rate cut.
Next Data: Traders now eye the U.S. ISM Manufacturing PMI for October, which could affect short-term USD direction and provide cues for XAU/USD’s next move.
Overall, a combination of risk-on sentiment and Fed’s hawkish tone continues to limit gold’s upside momentum.
🔑 Key Technical Levels
Resistance: $4,008 – $4,012
Support: $3,958 – $3,963
Psychological Level: $3,950
📌 Trade Summary
Gold remains below the key $4,008–4,012 resistance, maintaining a bearish short-term bias. The strategy favours selling near resistance for potential downside toward $3,950, while a close above $4,012 would neutralize the setup.
⚠️ Disclaimer
This analysis is for reference only and does not constitute trading advice. Trading involves significant risk, and proper risk management is essential.

XAU/USD 1H – Bearish Liquidity Sweep Toward BPR Zonepotential shift from a bullish (upward) to a bearish (downward) trend, outlining a clear trade entry area and target:
Prior Trend: The price action leading up to the structural change shows an upward move, indicative of a bullish phase.
Bearish CHOCH (Change of Character): This is the critical signal of a potential trend reversal. The price has broken below a previous significant Higher Low (HL), which signifies that the bulls are losing control and the market's 'character' is changing to bearish.
BOS (Break of Structure): In this bearish context, a Break of Structure would confirm the continuation of the new bearish trend by breaking a new Lower Low (not explicitly marked after the CHOCH but implied as the next step in a downtrend).
BPR (Balanced Price Range): This shaded zone marks a specific area where the price is expected to retrace to before falling further. A BPR is an area of overlapping Fair Value Gaps (FVGs) and acts as a high-probability supply/resistance zone where institutional sell orders are likely to be activated.
EQH (Equal Highs) / BSL (Buy-Side Liquidity): The line marked "EQH" (Equal Highs) is a liquidity target that was swept, suggesting the market cleared out buy stop-loss orders before initiating the main move down (liquidity hunt).
Target - SSS (Sell-Side Stop-loss Sweep / Sell-Side Liquidity): The final horizontal line marked "SSS" is the ultimate profit target. This area represents a pool of liquidity (stop-loss orders placed by traders who were short or who bought at that level) that the market is expected to hunt or "sweep" to fill large institutional sell orders.
In summary, the trade plan suggests:
Entry: A short (sell) trade within the BPR zone after the bearish CHOCH is confirmed.
Target: The lower SSS level.

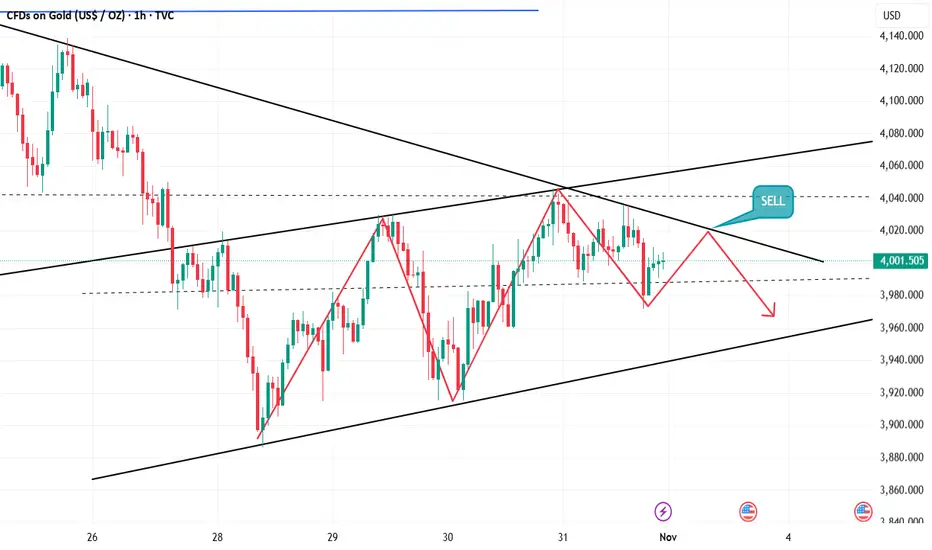
LiamTrading - $XAUUSD$: NEW WEEK TRADING SCENARIO...LiamTrading - OANDA:XAUUSD $: NEW WEEK TRADING SCENARIO – PRIORITIZE SELLING After BREAKING THE TRENDLINE
Hello traders community,
The new week opens with a clear strategy: Prioritize SELLING after Gold has broken the previous upward trendline.
Although fundamental economic news (such as interest rate policies and politics) supports Gold potentially reaching $5,000$ USD, we must trade according to
current Price Action. Technical selling pressure is strong. We will SELL at key resistance areas and continue SELLING when the price breaks the downward structure.
📰 FUNDAMENTALS & LONG-TERM OUTLOOK
Prospect of $5,000$: Fundamental and political factors still support the scenario of Gold reaching $5,000$ USD in the long term (due to geopolitical risks and the potential loss of Fed's independence).
Short Term 🔴: Gold is under technical selling pressure after breaking through the $4,000$ USD mark.
📊 TECHNICAL ANALYSIS: BREAKING THE TRENDLINE
Structure: Gold has exited the upward price channel and is retesting the broken trendline.
Priority: SELL at the retest resistance area of $4024$.
🎯 DETAILED TRADING PLAN (ACTION PLAN)
🔴 SELL Scenario (SELL Primary) - Preemptive Resistance
Entry 1: $4024$ (Sell retest trendline area)
SL: $4032$
TP1/TP2: $4012$ | $4000$
TP3: $3989$
Entry 2 (Continued SELL): When the price breaks the next trendline at $3992$
SL: $4000$
TP: $3940$
🟢 BUY Scenario (BUY Reversal) - Buy at Strong Support
Logic: Only buy when the price hits a strong liquidity support area, potential for short-term recovery.
Entry (BUY): Around $3960$ (Buy Scalping area)
SL: $3954$
TP1/TP2: $3972$ | $3988 FWB:TP3 : $4000$
📌 SUMMARY & DISCIPLINE (Liam's Note) Don't let the $5,000$ USD prospect affect short-term risk management. Trade according to Price Action. Adhere to SL and prioritize SELL positions at resistance areas.
Are you ready for the SELL strategy at the start of this week?

XAU/USD (Gold) 4H - Range & Liquidity Projection🪙 XAU/USD (Gold) 4H - Range & Liquidity Projection
This 4-Hour (4H) chart for Gold (XAU/USD) displays a clear consolidation pattern following recent volatility, with key liquidity zones defined by the price action. The analysis is framed around Smart Money Concepts (SMC), using the labeled high and low points.
🔍 Key Levels & Structure
CRTH (Clear Run on the High): This level at $3,987.92 (or the area around $3,988.26 to $4,005.65) represents the immediate Buy-Side Liquidity (BSL) pool. This is the main target for any bullish expansion from the current price. The "eye" symbol above CRTH suggests a high-probability target for a liquidity grab.
CRTL (Clear Run on the Low): This level around $3,979.27 acts as the immediate Sell-Side Liquidity (SSL) pool. A break below this would likely trigger stop-losses and drive the price lower.
Current Price: The market is currently trading right in the middle of this short-term range, near $3,980.19, indicating indecision or accumulation.
🎯 Projected Scenarios (The Dashed Path)
The dashed path drawn on the chart outlines a high-probability manipulation setup (a "W" shape):
Stop Hunt Down: Price is expected to first move down to sweep the liquidity below CRTL. This move would trap early sellers and stop out buyers who entered near the range low.
Reversal and Shift: After the sweep, the price reverses sharply, indicating that the sellers' liquidity has been absorbed by institutional buyers.
Expansion to CRTH: The reversal then leads to a bullish expansion, targeting the CRTH (Buy-Side Liquidity) at $3,987.92 and potentially the high near $4,005.65.
💡 Trading Plan Summary
Bias: Neutral/Range-Bound until a clear sweep or break occurs. The drawn path suggests an underlying bullish opportunity from a liquidity trap.
Bullish Entry Zone: Look for a reversal pattern or displacement on lower timeframes (1H/15M) after price trades below CRTL ($3,979.27) to capture the move to the upside.
Bearish Confirmation: A decisive 4H candle close below the recent swing low around $3,941.18 would likely invalidate the current consolidation and confirm a deeper bearish move, targeting lower structural support.

GOLD: Bullish! Continue To Buy! The +FVG Is Holding!In this Weekly Market Forecast, we will analyze the Gold (XAUUSD) for the week of Nov. 3 - 7th.
Gold has completed the pullback into the Weekly +FVG. It has moved sideways since, but inching higher.
Buys are valid. They have the highest probability.
Sells become valid only after a bearish break of market structure!
Enjoy!
May profits be upon you.
Leave any questions or comments in the comment section.
I appreciate any feedback from my viewers!
Like and/or subscribe if you want more accurate analysis.
Thank you so much!
Disclaimer:
I do not provide personal investment advice and I am not a qualified licensed investment advisor.
All information found here, including any ideas, opinions, views, predictions, forecasts, commentaries, suggestions, expressed or implied herein, are for informational, entertainment or educational purposes only and should not be construed as personal investment advice. While the information provided is believed to be accurate, it may include errors or inaccuracies.
I will not and cannot be held liable for any actions you take as a result of anything you read here.
Conduct your own due diligence, or consult a licensed financial advisor or broker before making any and all investment decisions. Any investments, trades, speculations, or decisions made on the basis of any information found on this channel, expressed or implied herein, are committed at your own risk, financial or otherwise.

XAUUSD Acceptance Rule at 4 000 - Map for 3-7 Nov 2025Context, in plain language
Gold finished Friday near 3 998.4 on my feed and sits right on the round 4 000 pivot. October was a runaway month with fresh records. In the final week of this rally phase the market will test whether price can live above four thousand or if it needs another breath. The plan below keeps things simple. I work from one decision line, a short event ladder, and a fixed risk template. Education only.
Why four thousand matters
Round numbers concentrate liquidity. They create noise on the first touch then clarity on the second. At four thousand you will see stop runs in both directions and you will see fast fades. The edge comes from trading acceptance rather than touch. Acceptance for me means two closes on the execution timeframe above or below the line. I use four hour for structure and fifteen minute for triggers. If you prefer one hour or five minute, keep the logic exactly the same and do not chase the first spike.
What can move price this week
It is a data led week. Monday brings ISM Manufacturing. Tuesday brings JOLTS. Wednesday brings ADP in the early morning and ISM Services late morning. Friday is the Employment Situation. The Federal Reserve cut the policy rate last week and said future steps depend on incoming data, so these releases are live for gold. I treat Monday as tone setting, Wednesday as positioning, and Friday as the weekly verdict. Times are Eastern. If you trade from Europe, align your session planning the night before.
Levels to work with if Friday’s close is your anchor
Immediate map
• 4 000 is the decision line.
• 4 050 to 4 060 is the first upside gate from the early October stall area.
• 4 100 opens if services data or jobs come in soft and real yields ease.
• 3 950 to 3 920 is first support on pullbacks where late sellers often get trapped.
• 3 880 to 3 800 is the larger retest zone from the September breakout.
I draw one bold line at 4 000. I shade two narrow boxes at 4 050 to 4 060 and 3 950 to 3 920. I leave the wider retest box lighter at 3 880 to 3 800. No extra overlays. No spaghetti. The clarity helps when the tape speeds up.
How I will trade it
Before New York I check two things. The dollar index trend. The ten year real yield tone. If both rise together I will be patient with longs and I will only buy strength that proves acceptance over four thousand with time. If both slip together I will allow a second test long that holds above four thousand and I will target the first gate at 4 050 to 4 060. If the event hits and the first move rips through four thousand I do nothing. I wait for the pause. The second test is the trade.
Triggers
Long idea
• Event passes and the second test holds above 4 000 with two closes on fifteen minute.
• Dollar fails to make a higher high on the hour.
• Target 4 050 to 4 060 first, then trail toward 4 100 only if the day opens up.
• Invalidation below 3 980 on a five minute close or a clear failure back inside the pre release range.
Short idea
• Clean rejection of 4 000 after the event.
• Dollar and real yields bid together.
• Target 3 950 to 3 920 first. Leave room for 3 880 only if the day does not bounce.
• Invalidation above 4 020 on a five minute close.
Risk template
I size so that a normal day’s pullback does not force me out. A simple rule is to keep per trade risk inside one third of the five day ATR. I place stops beyond the opposite edge of the zone I am trading. I never move a stop closer because the candle looks scary. I take partials into the first gate only when the day’s range is already near the expected move for that session. If spreads widen during the release I stand aside for five minutes. This alone will save you from many avoidable losses.
Common traps to avoid
Do not trade the first touch at four thousand. The tape loves to run stops there. Do not fade a break that holds for thirty minutes above the decision line. The whole edge is acceptance. Do not add size in front of Friday’s Employment Situation. This report resets everything. Finally do not forget that gold can gap through levels on macro surprises. The way to survive that is small size, predefined exits, and a plan to do nothing if liquidity is thin.
Event ladder for the week
Monday. ISM Manufacturing sets the opening tone.
Tuesday. JOLTS shapes labor cooling views.
Wednesday. ADP and ISM Services drive pre positioning into Friday.
Friday. Employment Situation at the open. I go reactive only after the first five minutes settle.
How to set up your chart
Timeframe four hour for structure. Timeframe fifteen minute for triggers. Draw a single line at 4 000. Shade the two narrow zones at 4 050 to 4 060 and 3 950 to 3 920. Add a lighter box at 3 880 to 3 800. Nothing else. If you must watch the dollar, keep it on a separate chart. The goal is to make the decision obvious when the release hits.
Three rule bullets that define the model
• Trade acceptance, not touch, at 4 000. Wait for two closes to confirm.
• Use the event ladder to scale risk. Light early. Normal only after the day’s release.
• Place invalidation beyond the opposite band of the zone you are trading.
Education and analytics only. No investment advice.

XAUUSD 4H Technical & Fundamental Weekly ForecastGold remains consolidative after strong rejection at the 4H Resistance Area near 4,100, with a visible break of structure to the downside confirming a shift in short-term momentum. The price is currently stabilizing near the 4H Support Zone at 3,965–3,980, as the market awaits high-impact U.S. data later in the week.
Key Levels
Support: 3965 — 3980
Resistance: 4010 — 4035
liquidity zone: 4000
Reasoning:
Technically, the 4H structure shows a clear lower-high formation after the resistance rejection, signaling that sellers are regaining control. The support zone between 3,965–3,980 will act as a key decision area — a break below could extend the bearish leg, while a bounce might trigger a short-term recovery.
Fundamentally, this week’s focus is on U.S. economic data, including the ISM Manufacturing & Services PMI, ADP Employment, and Non-Farm Payrolls (NFP) reports. Stronger-than-expected numbers could strengthen the U.S. dollar and pressure gold prices, while weaker data might support a short-term rebound.
Disclaimer:
This analysis is for educational purposes only and not financial advice. Always confirm your own entries and apply proper risk management before trading.

XAUUSD Weekly Analysis (03 – 07 Nov 2025)This chart is a technical market outlook for XAUUSD (Gold/USD) — specifically for the first week of November — prepared by B RED FX. Let’s break it down step by step 👇
🧭 Overall View
The market currently has a short-term bearish bias (downtrend).
However, a temporary upside pullback (short-term upward correction) is expected during the week.
📈 Key Level – 4025
This level acts as a critical pivot point for the week — meaning price behavior around 4025 decides whether the trend continues down or reverses upward.
If price breaks and sustains above 4025:
Bullish scenario activates.
Upside targets:
4096
4158
4160
These areas are marked as Supply Zones (where selling pressure might return).
If price fails to hold above 4025 and breaks below 3961:
Bearish continuation expected.
Downside targets:
3880
3850
3840
These are previous weekly lows / Demand Zone — potential buying interest area.
🧩 Zones Highlighted
Supply Zone 1: 4115 – 4096
→ Possible short-term resistance / selling area.
Supply Zone 2: 4220 – 4185
→ Stronger resistance zone for higher upside target.
Demand Zone: 3854 – 3819
→ Potential rebound area if price drops further.
🔍 Text Annotations on Chart
“SHORT TERM PULLBACK EXPECTED FROM HERE” — Indicates a possible small bounce upward before further direction is decided.
🔥 and 🌊 icons — Represent bullish and bearish reaction zones (buy/sell points).
“BUY” and “SELL” icons — Visual clues for potential trade directions based on breakout or rejection zones.
🧠 Summary
Scenario Key Trigger Target Levels Bias
Bullish Break above 4025 4096 → 4158 → 4160 Short-term bullish
Bearish Break below 3961 3880 → 3850 → 3840 Continuation bearish
💬 Conclusion
The chart suggests:
Market is bearish overall but could see a short-term pullback.
4025 is the make-or-break level for this week’s direction.
Traders should watch for a confirmed breakout or rejection near this zone before taking positions.

Gold (XAUUSD) TRADING SETUP FOR NEXT WEEKGold (XAUUSD) is consolidating near $4,000 after a record rally, with key U.S. data and Fed commentary expected to drive the next breakout or breakdown in the coming week.
---
🟡 TradingView Idea: Gold Spot – Calm Before the Catalyst?
Timeframe: 4H
Current Price: $4,003.15
Bias: Neutral-to-Bullish
Pattern: Ascending Channel
Indicators Used: Price Action, Volume, Trendlines
---
📌 Market Context
Gold has cooled off after touching all-time highs, now hovering near the upper boundary of a rising channel. The recent candles show indecision, with lower volume and tight price action—classic signs of consolidation. Traders are waiting for macro triggers before committing to the next move.
---
🔍 Technical Highlights
- Channel Resistance: Price is testing the upper trendline (~$4,015–$4,020). A breakout could target $4,100+.
- Volume Tapering: Declining volume suggests reduced conviction, often preceding a sharp move.
- Candlestick Structure: Wicks on both sides indicate tug-of-war between bulls and bears.
---
🗓️ Upcoming Events (Nov 4–9, 2025)
These could be the catalysts that break gold out of its range:
- Nov 5 – U.S. CPI Data: A key inflation report that could influence Fed rate expectations.
- Nov 6 – Fed Officials’ Speeches: Traders will watch for clues on rate cuts or policy shifts.
- Geopolitical Watch: Easing U.S.–China tensions and Middle East developments may reduce safe-haven demand.
- U.S. Funding Bill Talks: Any gridlock or uncertainty could reignite gold buying.
---
🎯 Trade Setup
- Bullish Scenario: Buy breakout above $4,020 with confirmation (volume + candle close).
Target: $4,100–$4,150
Stop Loss: $3,980
- Bearish Scenario: Short rejection near $4,020.
Target: $3,950–$3,920
Stop Loss: $4,030
---
💬 Drop your thoughts below—are you positioning for the breakout or fading the resistance?

Gold vs USD – Bearish Breakout Playbook for Smart Day Traders🏆 GOLD SCALPERS UNITE! XAU/USD Bearish Heist Plan 💰⚡
📊 ASSET OVERVIEW
XAU/USD | Gold vs. U.S. Dollar | Metals Market
Trade Type: Day Trade Setup 🎯
Bias: Bearish 🐻📉
🎭 THE HEIST PLAN
Alright, gold diggers and chart bandits! 👀💎 Time to put on our bearish masks because this precious metal is looking HEAVY! We're eyeing a potential drop from the clouds back down to reality. Let's break down this professional robbery... I mean, trading strategy 😏
🔥 TRADE SETUP BREAKDOWN
🎯 ENTRY ZONE
Entry Price: Market execution available after Moving Average breakout @ $2,740.00
(Wait for confirmation before entering the vault!)
🛑 STOP LOSS
SL Level: $2,860.00
Place your stop loss ONLY after the breakout confirmation at the mentioned price level
⚠️ Risk Disclaimer: This is an aggressive stop placement. Manage your position size accordingly! Not financial advice—trade at your own risk, legends!
🎁 TAKE PROFIT TARGET
TP Level: $2,660.00
LSMA acting as strong resistance zone 💪
Overbought conditions detected on multiple timeframes ⚡
Bull trap potential in play—don't get caught! 🪤
📌 NOTE: These are reference levels based on technical analysis. You're the captain of your own ship! 🚢 Adjust targets and stops according to YOUR risk tolerance and trading plan.
🔍 TECHNICAL ANALYSIS HIGHLIGHTS
✅ Moving Average breakout confirmation required
✅ LSMA resistance convergence zone ahead
✅ Overbought momentum signals flashing
✅ Classic bull trap formation developing
✅ Risk-to-reward ratio favors bears on this setup
💱 CORRELATED PAIRS TO WATCH
Keep your eyes on these bad boys for confluence:
TVC:DXY (U.S. Dollar Index): Inverse correlation—if DXY pumps, gold typically dumps 📉
OANDA:XAGUSD (Silver): Precious metals cousin—usually moves in sync with gold
FX:EURUSD : Risk-on/risk-off sentiment indicator—watch for dollar strength 💵
COMEX:GC1! Futures: Direct gold futures contract for institutional flow confirmation 📊
Key Correlation Point: Strong dollar = Weak gold. Watch DXY breakouts and EUR/USD weakness for additional bearish confirmation on XAU/USD! 🎯
⚡ RISK MANAGEMENT REMINDER
Listen up, trading thieves! 🎩 This setup has a wider stop loss, which means:
Position sizing is CRITICAL 🔐
Never risk more than 1-2% of your account per trade
The market doesn't care about your feelings—protect that capital! 💪
Partial profit-taking is your friend on the way down 📊
📢 FINAL WORDS
Gold bugs, this bearish setup is cooking! 🔥 But remember—the market is the ultimate boss, and it doesn't follow our scripts. Stay nimble, stay disciplined, and most importantly, stay profitable! 💎🙌
Watch those key levels, manage your risk like a pro, and let's see if this precious metal comes back down to earth! 🌍📉
✨ If you find value in my analysis, a 👍 and 🚀 boost is much appreciated — it helps me share more setups with the community!
#XAUUSD #Gold #GoldTrading #ForexSignals #TechnicalAnalysis #DayTrading #BearishSetup #MetalsTrading #TradingView #ForexStrategy #GoldAnalysis #PriceAction #SwingTrading #RiskManagement #ForexCommunity #ChartAnalysis #TradingIdeas #MarketAnalysis #GoldForecast #USDOLLAR
⚡ Trade safe, trade smart, and may the pips be ever in your favor! ⚡

Gold Next Target $50003 Nov 2025, Kuala Lumpur Malaysia - Why I Think Gold can Reach $5000/oz
Executive Summary
Macro tailwinds: The Federal Reserve has shifted dovish by cutting rates and pausing balance-sheet reduction, which lowers the opportunity cost of holding gold.
Institutional & central bank demand: Central banks remain meaningful net buyers ETFs and institutional flows are turning positive again.
Structural supply constraints: Mining grades are declining, capex rises, and new supply is sluggish making supply less responsive to price.
Market sentiment & risk climate: Despite the rally to ~US $4,000/oz, gold retains safe-haven appeal amid fiscal deficits, inflation uncertainty and geopolitical risks.
Current Market Landscape
Spot gold is trading near US $4,000/oz, after a strong 2025 advance. The market is in a “buy-the-dip” mode.
Media and analyst sentiment is “cautiously bullish” safe haven narrative remains intact even with mixed economic data.
Institutional positioning: Managed-money funds still carry net longs in the futures market; ETF flows recently slowed but positive structural trend remains.
Key Fundamental Drivers
Monetary policy & real yields
The Fed cut policy rate (e.g., Oct 29) and paused QT reducing the real cost of holding non-yielding gold.
Real yields (10-yr TIPS) remain around ~1.5–2%: such levels create a friendly backdrop for gold.
Fiscal deficits & debt dynamics
US federal deficit remains large (e.g., FY2025 > US$1.8T) and yields/duration risks are elevated. Investors increasingly view gold as a hedge.
Demand from central banks & institutions
Q3 2025: Central banks added ~220 tonnes of gold still well above long term averages.
ETFs and institutional flows are showing renewed interest an important supporting driver for price continuation.
Supply side constraints
Global gold mine production is increasing slowly but new supply is constrained by declining ore grades, higher capex, and permitting issues so gold supply is relatively inelastic.
Sentiment & Positioning
Managed-money net longs remain elevated, signaling structural bullishness but also warns of potential shakeouts during corrections.
ETF flows after strong inflows earlier in the year, some recent outflows could signal short-term consolidation rather than trend reversal.
Risk sentiment elevated geopolitical risk, inflation concerns, and economic uncertainty keep the safe haven bid for gold alive.
Supply–Demand Picture (2025)
Demand side: Central bank purchases + institutional/ETF inflows are major drivers.
Supply side: Mining output growth is limited; new, large scale expansions are rare and take many years. Less responsive supply = higher upside potential when demand ramps.
Path to US $5,000/Oz
Base case (bullish grind):
Real yields stable or falling (≤ ~1.5–1.8%)
Central banks continue buying, institutional flows turn net positive
Supply remains tight
→ A move to US $4,500-4,800/oz over next 3–6 months; $5,000 becomes realistic if momentum picks up.
Bull extension case (fast breakout):
Real yields drop sharply, Fed signals further cuts
Strong inflows into ETFs and increased physical demand
Geopolitical shock or inflation surprise
→ Potential overshoot to US $5,200-5,500/oz.
Risk (bear detour):
Real yields rise considerably (>2%)
Strong USD rally, large ETF outflows
→ Possible pullback to US $3,550-3,900/oz – still a structural buy zone if fundamental drivers remain intact.
What Are Institutions & Banks Doing?
Central banks: Still net buyers Q3 2025 saw ~+220t of purchases, indicating that official sector continues accumulating gold.
Institutions (ETFs, funds): After earlier strong inflows, there have been short-term outflows—a typical healthy consolidation in a larger uptrend.
Miners & producers: Higher gold prices improving margin, but many companies warn that future supply growth will be slow—supporting the tight supply narrative.
Technical & Action Plan
Key support zones: ~US $3,900-3,950 (last major pullback); if breached, next structural support is ~US $3,550-3,600.
Momentum trigger: A clear rebound and hold above ~US $4,250-4,300 would open space toward ~US $4,500-4,800.
Breakout validation: To aim for US $5,000, gold needs to clear its recent highs, hold above, and see confirmation via inflows & yield dynamics.
Suggested post headline:
“XAUUSD Structural Path to $5,000: Central-Bank Buying, Low Real Yields, Tight Supply. Pullbacks = Opportunity.”
Suggested call to action:
“Watch for support around 3,900–3,950; a clean rebound and hold above 4,300 could trigger the next leg. Managing risk with stop-loss below 3,550 in case of real-yield shock.”
Key Risks to Mention
-A surprise hawkish turn by the Fed (inflation too strong) → Real yields spike, USD rallies.
-Prolonged ETF outflows or liquidity crunch hitting gold.
-Rapid supply response (unlikely short-term but possible long term).
-Geopolitical de-escalation reducing safe-haven demand unexpectedly.
Zezu Zaza
2048
