Is the XAU/USD Breakout the Next Major Trade Opportunity?💰 GOLD vs USD — “Thief Trader’s Golden Breakout Playbook” ⚡️
Asset: XAU/USD (Gold vs U.S. Dollar)
Market: Metals
Type: Day Trade Setup
Bias: 🟢 Bullish plan – pending order after breakout
🧭 TRADE BLUEPRINT
Entry Zone:
Wait for a clean breakout above 4160.00 before entering.
(Breakout confirmation > impulsive candle > retest optional)
Stop Loss:
“Thief SL” parked at 4040.00 — move only after breakout validation.
💡 SL isn’t mandatory — your money, your call!
Target:
Ride the move up to 4380.00, where strong resistance meets overbought traps.
🧨 Escape with profits before the crowd gets greedy!
💬 NOTE TO ALL “THIEF OG’s”
Dear Ladies & Gentlemen,
I’m not asking you to use only my SL or TP — they’re examples.
You’re the master of your risk. Make money. Take money. Stay legendary. 💸
🧩 CORRELATION CHECKLIST
Keep your eyes on these key pairs to confirm gold’s direction:
TVC:DXY (U.S. Dollar Index): If the dollar drops, gold usually pops.
OANDA:XAGUSD (Silver): Often follows gold’s mood — good double-check.
FX:USDJPY & OANDA:USDCHF : Safe-haven cousins. If they fall, gold shines brighter.
OANDA:XAUJPY : A stealth correlation — helps catch sentiment early.
🧠 Gold doesn’t move alone — it dances to USD rhythm and global risk tone.
⚙️ THIEF INSIGHT:
Gold’s sitting near a major pivot resistance (4160) — a breakout signals momentum ignition.
Risk/Reward is balanced: 4040 SL vs 4380 TP (~1:1.8).
Institutional footprints suggest buy interest post-breakout zone.
Stay sharp — watch volume spikes & candle closes above breakout line.
🏁 FINAL WORDS
Trading isn’t robbery — it’s legalized patience.
The real theft is done with discipline, not greed.
Grab your profits like a pro, not a desperado. 🕶️💼
✨ “If you find value in my analysis, a 👍 and 🚀 boost is much appreciated — it helps me share more setups with the community!”
⚠️ DISCLAIMER:
This is a Thief Style Trading Strategy — just for fun & education.
Not financial advice. Always DYOR & trade responsibly. 🧠💰
#XAUUSD #Gold #DayTrading #Breakout #ThiefTrader #Forex #MetalsMarket #GoldAnalysis #USD #DXY #TradingView #RiskManagement #TechnicalAnalysis #FunTrading #MarketPlaybook
Xauusdanalysis

GOLD: HAWKISH FED Pushing the Market? $4,085 is the Test!Hey community, Gold is sitting at a critical junction. The alignment of the Fed’s pressure and a key Supply Zone is creating a high-conviction trade setup. Let's break it down.
I. FUNDAMENTALS: The Macro Headwinds 📰
Key Driver (The Bears' Argument): The Fed’s latest "hawkish" signals, with regional Presidents opposing further rate cuts, have significantly cooled market easing expectations. This solidifies the strong USD, creating heavy short-term pressure on non-yielding Gold.
Performance & Record High: Despite the immediate pressure, Gold surged 53% this year, hitting an all-time high of $4,381.21/oz on October 20th, showcasing underlying bullish demand.
Long-Term View: Morgan Stanley still supports Gold’s long-term climb (targeting $4,300/oz average by H1 2026), driven by expected rate cuts and economic instability.
Geopolitics: Trade news (e.g., discussions on US-China tariffs) adds noise, but the Fed's interest rate stance remains the dominant factor.
II. TECHNICAL ANALYSIS: The Supply & Demand Zones 🎯
The prevailing structure on the H4 chart confirms a strong DOWNTREND (Bearish Bias). The recent rally is a correction, necessary to retest key supply before the next decline.
1. The Primary SELL Setup (Following the Trend)
Optimal Supply Zone: $4,059 - $4,085. This is the key reversal zone where smart money is likely waiting to fill sell orders (discount zone for shorts).
Strategy: Wait for price to reach the $4,059 - $4,085 zone. Look for a strong rejection or pattern shift on lower timeframes to confirm the SHORT entry.
Ultimate Target (TP): The strong Demand Zone at $3,939 - $3,952.
2. The Counter-Trend BUY Zone (Bounce Potential)
Strong Demand Area: $3,939 - $3,952. This is a major structural level where Gold is likely to find strong support.
Strategy: If Gold sells off into this area, watch for buying pressure to catch a potential bounce.
🔑 FINAL TRADE CONCLUSION
Best Strategy: Wait and SHORT at the $4,059 - $4,085 Supply Zone. This is where fundamental pressure (Fed) and technical resistance perfectly align.
What's your take? Will the strength of the USD hold Gold down from here? Drop a comment! 👇
#XAUUSD #GOLD #FED #TechnicalAnalysis #ForexTrading #SupplyAndDemand #Bearish #TradingStrategy #PriceAction #MarketAnalysis

XAU/USD Bullish Outlook - Strategic Entry & Exit Plan🟡💰 XAU/USD — “Gold Rush or Police Trap?” ⚡ Thief Strategy Playbook 🎯
Asset: XAU/USD “Gold vs U.S. Dollar”
Market Type: Crypto / Metals Cross (Swing / Day Trade)
Bias: Bullish 🟢
🔓 Thief’s Entry Game Plan (Layer Method)
This isn’t your typical sniper-entry… this is the Thief Strategy™ — a layering style method using multiple limit orders for flexible accumulation.
💎 Layer Entries:
4000.00 ✅
4025.00 ✅
4050.00 ✅
(You can increase or adjust the layers based on your risk appetite & setup.)
🛡️ Stop Loss (Thief’s SL): @3950.00
“Dear Ladies & Gentlemen (Thief OG’s) — I’m not recommending my SL; it’s just my escape route.
Trade smart, take your profits, and move at your own risk.”
🎯 Target Zone — “Police Barricade Ahead 🚨”
The 4200.00 zone acts as a strong resistance + potential trap area — heavy liquidity and overbought conditions live there.
Be wise, secure the bag 💼, and slip out before the market cops show up.
📊 Key Technical Notes
Momentum shows gold buyers reclaiming upper zones after liquidity grabs.
Higher-timeframe structure: Still bullish unless 3950.00 breaks cleanly.
RSI divergence & volume spike hint at layered re-accumulation potential.
🔗 Related Pairs to Watch & Correlations
💵 TVC:DXY — Inverse correlation; stronger dollar → gold pullback risk.
BITSTAMP:BTCUSD — Occasionally follows gold sentiment under risk-off conditions.
💹 TVC:SILVER (XAGUSD) — Often moves in tandem; can confirm metal-sector strength.
💱 FX:USDJPY — Watch for safe-haven flows; yen strength = gold demand uptick.
⚙️ Market Sentiment (London Session Focus)
📈 Bullish tone continuing through European hours.
🔍 Institutions layering bids near 4000–4050 liquidity pocket.
⏱ Short-term pullbacks expected before breakout continuation.
✨ “If you find value in my analysis, a 👍 and 🚀 boost is much appreciated — it helps me share more setups with the community!”
📜 Disclaimer:
This is a Thief-style trading strategy — just for fun & educational purposes only.
Not financial advice. Trade responsibly — steal profits, not peace. 🕶️
#XAUUSD #Gold #ThiefTrader #SwingTrade #LayerEntry #Forex #DayTrading #TechnicalAnalysis #MarketStrategy #GoldTrading #XAU #PriceAction #SmartMoney #LondonSession #TradingViewIdeas

Core Data and Event Analysis for the Super WeekCore Data and Event Analysis for the Super Week
The upcoming week will see a dense window of key data releases and events, featuring "PMI + ADP Employment + Central Bank Rate Decision" — each with the potential to break the current range-bound market pattern for gold:
Nov 3: Global Manufacturing PMIs
Market expectations point to a reading of 49.2 for the U.S. October ISM Manufacturing PMI, while China’s SPGI Manufacturing PMI is projected to remain below the 50.0 expansion-contraction threshold at around 49.0%.
- A U.S. PMI print below 48.5 would reinforce expectations of economic slowdown, fueling bets on monetary easing and lifting gold sentiment.
- A reading above 49.5, however, could further weigh on gold prices by signaling relative economic resilience.
Nov 5: U.S. ADP Employment Report
As a leading indicator for nonfarm payrolls, the ADP report is expected to show 170,000 new jobs added in October.
- If the actual figure falls below 150,000, the probability of a Fed rate cut in December may rise above 70%, directly driving gold to test the 4,040 USD resistance level.
- A print above 200,000 could trigger a pullback in gold to the 3,970 USD support zone.
Nov 6: Bank of England (BoE) Rate Decision
Market sentiment is divided ahead of the BoE meeting: most institutions anticipate rates to stay unchanged at 4.0%, but Goldman Sachs forecasts a 25-basis-point cut.
- Should the BoE initiate an interest rate cut cycle, it would boost global expectations for monetary easing, providing indirect support to gold prices.
Nov 7: Collective Remarks by FOMC Members
Five core members of the U.S. Federal Open Market Committee (FOMC) will deliver speeches. Key focus will be on their comments regarding a potential December rate cut and inflation trends.
- Hawkish signals (e.g., emphasizing persistent inflationary pressures) may trigger a short-term correction in gold.
- Dovish comments (e.g., noting signs of softening in the labor market) are likely to act as a catalyst for gold to break above key resistance levels.
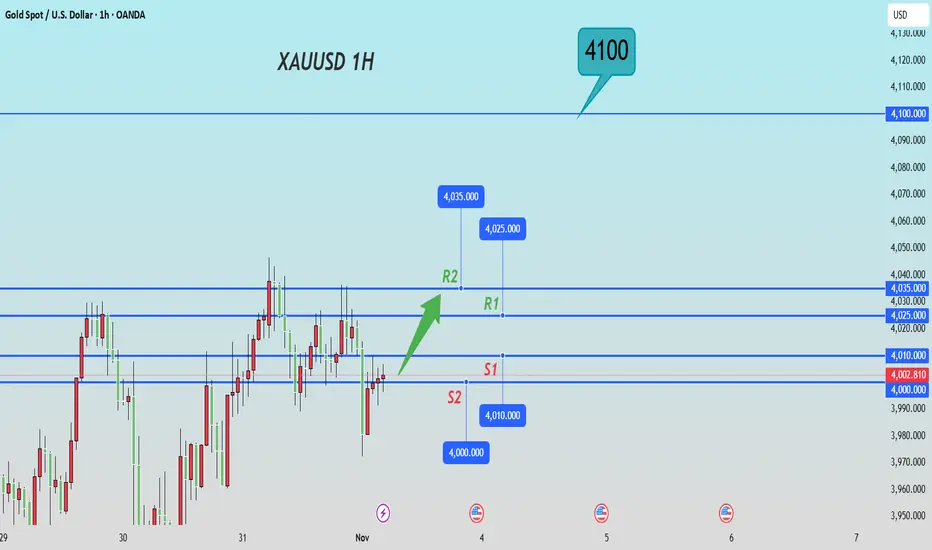
Next week's trading strategy and analysis
buy:4000-4010
tp:4025-4035-4100
sl:3995

XAUUSD Analysis todayHello traders, this is a complete multiple timeframe analysis of this pair. We see could find significant trading opportunities as per analysis upon price action confirmation we may take this trade. Smash the like button if you find value in this analysis and drop a comment if you have any questions or let me know which pair to cover in my next analysis.

Gold Trend Analysis 4-Hour Time Frame
Hi Traders
The analysis for this week is ideal for me according to this flash move.
Since the daily candlestick closed as a doji and indecisive, we mark the high and low range of this daily candlestick and refer to the 15-minute time frame. Depending on whether the high or low breaks or breaks out, we enter the trade.
Considering the liquidity of 4050 and the remaining orders, the balance of 15 minutes, one hour and 4 hours, which are important numbers 4062, 4075 and 4090, the upward movement can be considered initially to hunt liquidity and attract orders in these ranges, and then continue the price correction until we have liquidities at the bottom of the price, including 3915 and 3886 ... Good luck

XAU USD - Corrective wave ABC?Updte to previous post.
Still long, awaiting the corrective structure to occur - firstly to break and hold under $4000 (key level).
Downward channel - to $3800 which is another area of interest - reason being, it holds high volume at a structure point under $3800. So, we sit tight and await the corrective pattern to emerge and complete.
Daily chart image shows my thought pattern and an opportunity I am waiting for price to revert to.
I'm referring to the Daily price chart and key counts are in line with Wave counting and supply and demand curve trading levels based on fair value gap intervals of weekly trading sessions plotted to a daily chart at intervals of 60.
Current wave - 3 of 5 in the Elliott wave count.
Experiencing ABC corrective structure.
Master Key for zones
Red = Three Month
Blue = Monthly
Purple = weekly
Pink = Consolidative box example (Daily)
Orange = Daily
Risk Warning
Trading leveraged products such as Forex, commodities and CFDs, carries with it a high level of risk and so may not be suitable for every investor. Prior to trading the foreign exchange, commodity or CFD market, consider your investment objectives, level of experience and risk appetite. You should never risk more than you can afford to lose. If you fail to understand or are uncertain of the risks involved, please seek independent advice and remember to conduct due diligence as criteria varies to suit the individual.
Below are some of the take aways from the video - please listen again incase any detail is missed.
Do you enjoy the setups?
Professional analyst with 8+ years experience in the capital markets
Focus on technical output not fundamentals
Focus on investing for long term positional moves
Provide updates where necessary - with new updated ideas tracking the progress.
If you like the idea, please leave a like or comment.
To all the followers, thank you for your continued support.
Thanks,
LVPA MMXXIV

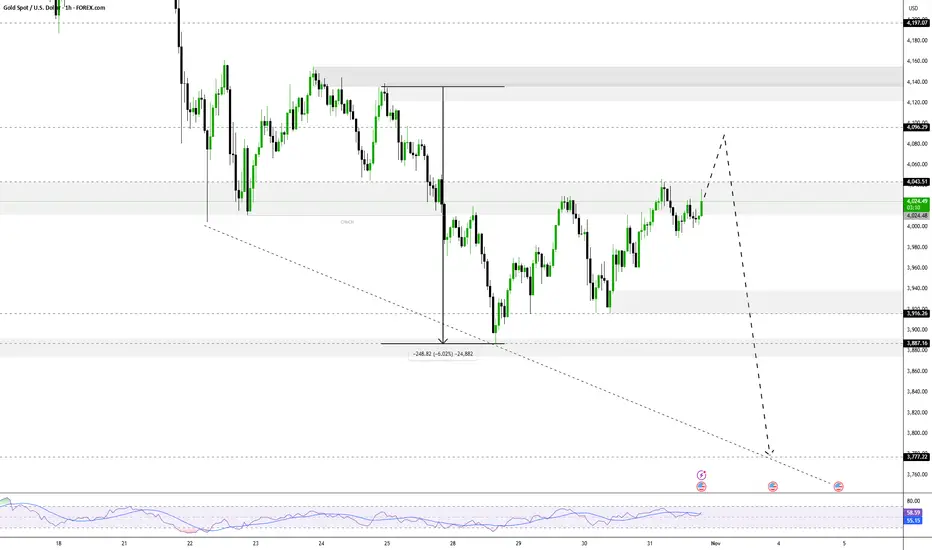
The gold-driven logic behind the US attack on VenezuelaThe "black swan" shock in the global crude oil market: Venezuela, as an important member of OPEC, produces 1.2 million barrels of oil per day (accounting for 1.3% of global crude oil supply), and controls 18% of the world's proven oil reserves. If the US military strike causes the paralysis of its oil facilities (such as the Maracaibo Lake oil field and the Caribbean Sea ports being bombed), global crude oil supply will instantly decrease by 1.2 million barrels per day. Coupled with the fact that the situation in the Middle East has not yet eased, the Brent crude oil price may soar from the current $85 per barrel to $120-130 per barrel, reaching a new high since 2022.
The signal of restarting the inflation spiral: For every $10 increase in crude oil price per barrel, it will push up the US core CPI by 0.3-0.4 percentage points. If the oil price exceeds $120, the US CPI may return to above 4% in December 2025. This will completely reverse the market's expectation of "inflation moderation", and the demand for gold as an "inflation-resistant hard asset" will experience an explosive growth - during the 2022 Russia-Ukraine conflict, the inflation concerns triggered by the oil price increase led to a 5.8% weekly increase in gold prices. This scenario shock is even stronger, with a weekly increase of over 7%.
Next week's trading strategy and analysis
buy:4000-4010
tp:4025-4035-4100
sl:3995
Gold is Ready For Bull From SupportHello Traders
In This Chart GOLD HOURLY Forex Forecast By FOREX PLANET
today Gold analysis 👆
🟢This Chart includes_ (GOLD market update)
🟢What is The Next Opportunity on GOLD Market
🟢how to Enter to the Valid Entry With Assurance Profit
This CHART is For Trader's that Want to Improve Their Technical Analysis Skills and Their Trading By Understanding How To Analyze The Market Using Multiple Timeframes and Understanding The Bigger Picture on the Charts


XAUUSD Forming Ascending TringleXAUUSD has recently completed a breakout from a long-term ascending triangle, showing strong bullish momentum that pushed prices above the key resistance area near 2,400, turning it into a solid support zone. After reaching a new high near the 4,300 level, gold has started a corrective phase, which appears to be a healthy retracement within the broader bullish trend. The market structure remains positive as long as price stays above the 3,900–3,950 demand zone, where fresh buying interest is expected to emerge. This correction could be the final consolidation phase before the next bullish wave targeting the 4,500–4,700 levels in the coming weeks.
From a fundamental perspective, gold remains supported by global macro uncertainty and central bank demand. Weakening U.S. dollar sentiment, persistent geopolitical tensions, and increasing speculation that the Federal Reserve may initiate rate cuts in early 2026 continue to fuel investor interest in safe-haven assets like gold. In addition, strong accumulation from emerging market central banks and inflation concerns sustain the bullish outlook for precious metals.
Technically, as long as XAUUSD holds above 3,900, the bias stays strongly bullish. Traders are watching for a potential retest of broken resistance turned support before continuation higher. A clear bullish rejection from these levels would confirm renewed momentum toward new record highs, offering a favorable risk-to-reward setup for long-term buyers.

NEXT WEEK XAUUAS - GOLDnext week will are looking for short positions on the gold after taking the liquidity at 4046$

Gold - The most obvious top!🪙Gold ( TVC:GOLD ) will reverse soon:
🔎Analysis summary:
After we witnessed a major breakout back in 2024, Gold has been rallying about +120% ever since. However, Gold is now approaching a monster resistance trendline of the long term rising channel. It is really just a matter of time until Gold will create its official top.
📝Levels to watch:
$4,500
SwingTraderPhil
SwingTrading.Simplified. | Investing.Simplified. | #LONGTERMVISION

XAU/USD Short to Longs idea Yes — I still believe Gold remains bullish overall. The recent downside movement looks like a healthy correction before price continues its rally upward. I’m noticing price building liquidity, so I’ll wait for a breakout and a clean tap into one of my key POIs.
Currently, price is sitting in a 30min demand zone near a 2hr supply, where I expect a possible short-term reaction. After that, I’ll be waiting for the next solid buying opportunity — ideally from the 3hr demand around 3,860, or from a new demand that may form closer to current price this week.
Confluences for Buys:
- Price broke major structure to the upside and is now retracing
- Liquidity above (trendline + Asia highs) waiting to be taken
- 3hr demand around 3,860 could fuel the next rally
- Bullish candlestick momentum remains strong
- Higher time frames still show clear bullish structure
P.S.If price breaks below 3,850 with clear bearish structure, I’ll consider a short-term bearish phase. Until then, I’ll stay focused on long opportunities in line with the dominant trend. Have a great trading week!

Gold (XAUUSD) – 31 Oct | Key Demand Zones in Focus🟡 Gold (XAUUSD) Analysis – 31 October
Hello Disciplined Traders,
Welcome to the Chart Is Mirror Community 👋
Market Context
• As per our yesterday’s analysis , the market did not retest our POI zone but instead took support from the double bottom / W-pattern key level around 3960 , breaking structure above 4030.5 .
• This move confirms that M15 is now fully uptrend , aligned with the ongoing H4 pullback phase .
Key Observations
• Today, our first buying zone is the 3975.5 – 3960.5 demand zone .
• The next potential demand area lies lower at the 3937.7 – 3930 OB , as marked in yesterday’s analysis.
• There is a high probability that price may sweep liquidity below 3975.5 – 3960.5 before resuming upside momentum toward new highs.
Execution Plan
• If price pulls back to the 3975.5 – 3960.5 zone and respects it with LTF bullish confirmation , we will execute our long setup accordingly.
• If price continues lower, observe how it reacts around the 3937.7 – 3930 OB . Enter only after clear LTF confirmation .
• The market remains volatile — manage your position size and risk accordingly .
Patience before confirmation is the trader’s true stillness.
📘 Shared by @ChartIsMirror

XAUUSD BEARISH REVERSAL SETUP FROM SUPPLY ZONE🔍 Key Observations:
1. Market Structure Shift:
A Change of Character (CHoCH) has occurred near the upper boundary of the ascending channel.
This indicates a potential shift from bullish to bearish momentum.
2. Liquidity & Supply Zone:
The red zone near $4,044 – $4,018 acts as a supply zone or bearish order block.
Price has reacted from this level, rejecting higher prices.
3. Entry & Targets:
Entry: Around $4,011 – $4,018 (current zone)
Stop Loss: Above the recent high near $4,044
First Target (TP1): $3,977 – local liquidity zone
Second Target (TP2): $3,930 – $3,915 major demand area / imbalance fill zone
4. Channel Breakdown Potential:
If the price closes below the lower trendline of the ascending channel, a strong bearish continuation toward the lower targets is expected.
5. Smart Money Concept (SMC) View:
The chart aligns with liquidity grab above highs, followed by CHoCH, suggesting smart money selling pressure.
A retracement to premium zones has already happened, and distribution is likely underway.
📉 Bearish Outlook Summary:
Bias: Bearish
Entry Zone: 4,011 – 4,018
Stop Loss: 4,044
Target 1: 3,977
Target 2: 3,930 – 3,915
Invalidation: Break and close above 4,045 would negate bearish setup.

How to trade gold stably as the weekly and monthly charts close?#XAUUSD TVC:GOLD OANDA:XAUUSD
As we expected, gold broke through the previous strong resistance at 4030 and continued its bullish trend, reaching a high of 4046, very close to our target of 4050. Although the price of gold retreated somewhat after the brief surge, from the daily chart, the short-term price of gold is still above the MA5 moving average, while from the 4-hour chart, the middle band coincides with the MA20. Therefore, I don't think this means the bulls have given up; on the contrary, it's more like a way to better accumulate momentum at the bottom. This strategy remains effective, and we can still consider going long on gold when the price retraces to the 3985-3975 range.

(XAU/USD) Bullish Reversal Setup Toward $4,066 Target ZoneThis chart shows the 1-hour price action of Gold (XAU/USD). The price is currently around $3,997 and has bounced from a support trend line. Key support levels are marked at $3,914 and $3,866, while resistance is near $4,030. The chart suggests a potential bullish move toward the target buy zone around $4,066, following a possible retest of the trend line or support area before continuing upward.

GOLG BULLISH BREAKOUT SETUP TARGETING 4030 AFTER STRUCTURAL SHIFEntry Point: Around 3,994 – 4,000 USD — where price retested the demand zone after BOS.
Stop Loss: Below 3,978 USD, just under the last higher low to protect from fakeouts.
Target Zone 1: Around 4,011 USD — short-term resistance and first liquidity area.
Target Zone 2: Around 4,034 USD — strong supply zone and next liquidity pool (EQH zone).
Smart Money Concept (SMC) Insights:
Liquidity Sweep: The chart shows that equal lows (EQL) were swept before bullish structure formed — a common SMC pattern indicating accumulation.
Fair Value Gap (FVG): Price may fill a small imbalance before continuing higher.
Strong High Zone: Around 4,034, which could act as the final liquidity target before a potential pullback.
Trade Idea:
Setup: Bullish continuation after market structure shift.
Risk/Reward: Approximately 1:3 R/R ratio.
Bias: Bullish as long as price holds above 3,978 – 3,980 zone.

GoldXAUUSD
- Resistance Level
- Bullish Channel as an corrective pattern in Long Time Frame
- RSI - Divergence
- Symmetrical Triangle as an corrective pattern in Short Time Frame
- Completed " 12345 " Impulsive Waves and " ABC " Corrective Waves

The gold price is still in the process of correcting Wave 4The gold price is still in the process of correcting Wave 4, and nothing has changed structurally.
Currently, the price continues to respect the corrective zone we have been monitoring, and the internal waves still support the complex WXY pattern. This tells us one thing:
⏳ The correction is not over.
Once Wave 4 is complete, the real opportunity will begin:
✅ First impulse up → confirms trend resumption
✅ Pullback (Wave 2) → optimal entry point
✅ Wave 3 → highest potential reward 🚀
If the price breaks above the current resistance zone from here, we will monitor the alternative count. However, as long as the structure hasn't confirmed it, we remain patient.
Remember:
Corrections are designed to test patience.
Wave 4 is historically the most complex wave; triangles, flats, and complex structures are common.
Remain disciplined. Let the structure settle. The next leg up will be worth the wait.
gold await breakout to buy or sell#XAUUSD we await price to fall below 4017 on 2 times breakout before selling. The price is reforming a new trend.
Sell below 4017 2 times breakout, target 3982, stop loss 4028.
H1 closure above 4030-32 will continue bullish till 4050.
Await for breakout before trading

XAUUSD - Signal#XAUUSD - Signal
H4 - Formation of the 3rd wave + retest of the trend line. Stop behind the local minimum.
Entry: 4030.143
TP: 4119.239 - 4192.840 - 4276.955 - 4485.155
Stop: 3985.872
