Elliott Wave Analysis – XAUUSD | October 30, 2025
1️⃣ Momentum
• D1 Timeframe:
D1 momentum remains entangled. Yesterday’s daily candle closed at its lowest point, rejecting all intraday bullish attempts. However, it has not yet broken the previous candle’s low — this suggests that the bearish trend is still intact, though weakening, and a potential reversal could occur within the next 1–2 days.
• H4 Timeframe:
H4 momentum is approaching the oversold zone, indicating a possible short-term recovery lasting around 4–5 H4 candles.
• H1 Timeframe:
The price is currently either consolidating or continuing its short-term decline.
If it continues to cling to the 3927 liquidity zone, a further breakdown is likely.
________________________________________
2️⃣ Wave Structure
• D1 Timeframe:
Price is now sitting near the 0.382 Fibonacci retracement of wave (3) in yellow — a typical correction level for wave (4).
Therefore, if the decline continues or the correction extends, it’s highly probable that we are in wave (4) of the yellow count, and the current drop is only the first sub-wave of this corrective phase.
• H4 Timeframe:
Currently, price is around the 0.872 extension of wave (3) in purple, which is not ideal for a completed wave (4).
When combining the D1 and H4 structures, both indicate that the market is likely forming a corrective wave (4) in yellow, and a recovery move may soon appear as D1 momentum begins to turn upward.
👉 If this scenario is confirmed:
o If price breaks above the previous wave (3) high (around 4400), it would confirm the start of a new impulsive wave upward.
o If price rises slowly and the highest target only reaches around 4400 before turning down again → this move is likely part of the corrective wave (4) before another bearish leg resumes.
• H1 Timeframe:
The current formation suggests a potential double zigzag structure.
To confirm this setup, price needs to break below 3892. This is a strong liquidity zone, so if price reaches it, a temporary bounce could occur.
Key liquidity zones above to watch: 3927 – 3953 – 3995.
If price fails to break above the previous red wave X, these zones may act as strong resistance levels, pushing the market lower again.
Target areas for the red wave Y are:
o 3814
o 3786
________________________________________
3️⃣ Trade Plan
Scenario 1:
• Buy Zone: 3815 – 3813
• SL: 3804
• TP1: 3892
Scenario 2:
• Buy Zone: 3787 – 3785
• SL: 3776
• TP1: 3892
________________________________________
📌 Summary:
D1 momentum is weakening and nearing the oversold zone → a potential bullish rebound could develop in the coming sessions.
The 3815 – 3785 area remains a key buy zone, while 3927 – 3995 should be closely monitored as resistance levels to confirm the next directional move.
Xauusdanalysis

Gold Rebounds to Order Block — Downside Risk Remains🔍 Market Context
After forming a Change of Character (ChoCH) and a clear Break of Structure (BoS) to the downside, gold dropped sharply from 4,080–4,100 USD, confirming a shift from bullish to bearish structure.
Price is now making a technical rebound, forming Lower Highs toward the Order Block 4,012 USD — aligning with a small Fair Value Gap (FVG) , suggesting new selling pressure may emerge.
This rebound is seen as a “pullback retest supply” within a completed bearish setup.
If the 4,012 USD supply zone reacts strongly, price may extend its drop toward lower liquidity pools.
💎 Key Technical Structure
BoS (bearish): confirms a break below prior bullish structure.
Order Block (OB): 4,010–4,020 USD → main supply area confluencing with FVG.
FVG zone: 3,985–4,010 USD → technical retracement zone.
Supply Zone: 3,891–3,895 USD → temporary support, may be swept.
Liquidity Zone: 3,850–3,860 USD → key liquidity target.
📈 Trading Scenarios
1️⃣ SELL Setup – Retest OB 4,010–4,020 USD
Entry: 4,010 – 4,020
SL: 4,035
Take Profit: 3,985 - 3,965 - 3,945 - 3,915 - 3,890/Open
✅ Condition:
Wait for price to retest FVG–OB with clear bearish confirmation (strong rejection, bearish engulfing, or minor ChoCH on M15).
➡️ Trend-follow setup – sell after price retests supply zone.
2️⃣ BUY Setup – Reversal at Liquidity Zone 3,850 USD
Entry: 3,850 – 3,860
SL: 3,830
TP1: 3,870 - 3,885 - 3,900 - 3,920 - 3,940/Open
✅ Condition:
Wait for strong absorption or bullish reversal signal (long-tail rejection or bullish ChoCH on M15–H1).
➡️ Counter-trend scalp setup for reversal traders.
⚠️ Risk Management
Prioritise SELLs below 4,035 USD.
BUYs only valid with confirmation at Liquidity Zone.
Avoid mid-range trading (3,920–3,970) to reduce noise.
💬 Conclusion
Gold remains in a bearish trend after breaking prior bullish structure.
As long as price stays below 4,035 USD , downside momentum prevails.
Next major target: 3,891 – 3,851 USD .
👉 Strategic Plan:
Sell 4,010–4,020 | SL 4,035 | TP 3,985 → 3,890 🎯
Buy 3,850–3,860 | SL 3,830 | TP 3,870 → 3,940 🎯
💎 Price never lies — liquidity always reveals the truth.
⏰ Timeframe: 1H
📅 Updated: 29/10/2025
✍️ Analysis by: Captain Vincent

ElDoradoFx PREMIUM – GOLD ANALYSIS (30/10/2025, ASIA SESSION)🧠 XAUUSD (GOLD) – ASIA SESSION ANALYSIS (30/10/2025)
Professional Institutional Breakdown
⸻
1️⃣ Market Overview
Gold ended the NY session bearish after failing to sustain above 4,010, closing near 3,944. The market remains technically weak after a corrective bounce from 3,916, showing exhaustion under key EMAs. The current Asian range sits between 3,916 – 3,955, and the bias leans bearish unless price reclaims 3,985. The broader daily structure continues its retracement phase after the parabolic September–October rally.
⸻
2️⃣ Technical Breakdown
🔹 Daily (D1)
• Structure: Down correction within larger bullish channel.
• Candle: Small-bodied candle forming near the 20EMA, signaling indecision before potential continuation lower.
• Indicators: RSI at 47, below midline → bearish momentum intact. MACD histogram still negative.
• Key Levels: Support 3,850–3,820 | Resistance 4,005–4,040
📉 Outlook: Daily sentiment remains corrective-bearish. Price needs daily close above 4,005 to shift back bullish.
⸻
🔹 H1
• Structure: Lower highs and lower lows persist.
• EMAs: 20/50/200 aligned bearishly; price capped under the 200EMA (~3,978).
• RSI: 39 → mild recovery but still below 50 threshold.
• MACD: Bearish histogram fading; potential short-term relief rally before another drop.
• Zones: Overhead supply 3,955–3,965 + confluence with fib 61.8%.
📉 Outlook: Expect retracement into resistance followed by potential continuation lower.
⸻
🔹 15M–5M
• Minor bullish correction toward 3,950, but structure shows bearish compression.
• Liquidity resting above 3,955, likely to be swept before new leg down.
• MACD flattening; RSI approaching overbought (>60).
📊 Outlook: Watch for CHoCH or bearish engulfing in 3,955–3,965 zone to confirm re-entry short.
⸻
3️⃣ Fibonacci Analysis
Swing Reference: 3,993 → 3,916
• 38.2% = 3,946
• 50.0% = 3,955
• 61.8% = 3,964
🎯 Golden Sell Zone: 3,955 – 3,964
Confluence: H1 supply + descending EMA cluster.
⸻
4️⃣ High-Probability Trade Scenarios
📉 SELL Setup (Main Bias)
• Entry Zone: 3,955 – 3,964 (Golden Zone)
• Confirmation: 5M/15M bearish engulfing or CHoCH after liquidity sweep.
• TPs: 3,940 → 3,930 → 3,916 → 3,898 → 3,886
• SL: Above 3,976
💡 Rationale: Rejection from fib zone aligns with H1 structure continuation; best risk-reward short setup.
⸻
📉 SELL Continuation (Break & Retest)
• Trigger: < 3,930 confirmed break & retest
• Targets: 3,916 → 3,898 → 3,886
• SL: > 3,940
💡 Rationale: Trend continuation setup below local structure, confirming dominance of sellers.
⸻
📈 Countertrend BUY (Scalp)
• Zone: 3,916 – 3,924 (Asia demand)
• Confirmation: Bullish engulfing or double-bottom on 5M.
• Targets: 3,940 → 3,955 → 3,964
• SL: < 3,908
⚠️ Rationale: Pure liquidity scalp against trend; quick exits recommended.
⸻
💥 Breakout Opportunities
• Buy Breakout: > 3,985 → Targets: 4,013 / 4,030
• Sell Breakout: < 3,916 → Targets: 3,898 / 3,886 / 3,860
⸻
5️⃣ Fundamental Watch
• Asia session: Low-volume environment; volatility likely after Tokyo open.
• DXY stable around 106.00 → maintains downside pressure on gold.
• US GDP and unemployment claims upcoming — could impact NY sentiment.
⸻
6️⃣ Key Technical Levels
Type Levels
Resistance 3,955 / 3,964 / 3,985 / 4,013
Support 3,930 / 3,916 / 3,898 / 3,886
Golden Zone 3,955 – 3,964
Break Buy Trigger > 3,985
Break Sell Trigger < 3,916
⸻
7️⃣ Analyst Summary
Gold remains bearish in structure while inside a short-term corrective bounce. The 3,955–3,964 zone offers the highest probability for re-entry shorts with confirmation.
Below 3,930, sellers take control again targeting 3,898–3,886. Only above 3,985 would sentiment shift bullish toward 4,013–4,030.
📈 Institutional Bias: SELL rallies toward 3,955–3,964
📉 Invalidation: Sustained hourly close > 3,985
⸻
8️⃣ Final Bias Summary
📉 Overall Bias: Bearish
🎯 Primary Setup: Sell retracement 3,955–3,964 → Targets 3,916 / 3,886
⚠️ Alternate Setup: Buy scalp 3,916–3,924 (low probability)
🕐 Session Focus: Asia retracement sell or breakout below 3,916
⸻
🥇 ElDoradoFx PREMIUM 3.0 – PERFORMANCE 29/10/2025 🥇
📊 High volatility, clean recoveries, and strong finishes.
━━━━━━━━━━━━━━━
❌ SELL -40 PIPS
🔻 SELL +40 PIPS
⚪️ BUY LIMIT – Deleted
🔻 SELL LIMIT +40 PIPS
⚪️ BUY LIMIT – Deleted
🟢 BUY +40 PIPS
🔻 SELL +60 PIPS
❌ BUY -50 PIPS
🟢 BUY LIMIT +80 PIPS
🔻 SELL +210 PIPS
━━━━━━━━━━━━━━━
💰 GOLD TOTAL PIPS WON: +380 PIPS
📊 10 Signals → 6 Wins | 2 SL | 2 Deleted
🎯 Accuracy: 75%
━━━━━━━━━━━━━━━
🔥 Choppy day, but the team still closed strong — key levels respected with solid recoveries.
👏 Congratulations if you profited! ✅✅✅🚀🚀🚀

GOLD Will Go Down!HI,Traders !
#GOLD is making a
Bullish rebound after a
Bearish breakout but will soon hit a new
Horizontal resistance
Of 4038.09 from where
We will be expecting a
Further move down !
Comment and subscribe to help us grow !

GOLD Bearish Bias!
HI,Traders !
#GOLD made a bearish
Breakout of the key
Horizontal level of 4189.93
Which is now a resistance
AndAfter retesting that area we
will be expecting
A further move down !
Comment and subscribe to help us grow !

Gold Has Entered the Fifth Wave — A Drop Below 3800 Is PossibleGold continued its Wave-4 rebound today, but following a news catalyst, Wave-5 downward momentum began, and the market structure has become clearer. In such conditions, what traders need most is patience.
From the daily chart perspective, there still appears to be room for further downside. Based on my expectation, this decline may break below 3800. Of course, the market is always changing, and our outlook is based on probabilities — no one can guarantee the market will move exactly as expected. However, recent price action has been largely in line with our forecast, and I believe many of you have already secured profits from this move — that’s what matters.
Additionally, I will be traveling tomorrow and won’t be able to monitor the market in real time. So during your trades, please stay alert and prioritize risk control. Protect your capital first — profits will come naturally afterward. The market never lacks opportunities, so don’t sacrifice long-term stability for short-term gains.
Stay calm, stay disciplined, and trade safely!

Gold (XAU/USD) - Daily Retracement into Fair Value Gap (FVG)Prior Bullish Move & Sharp Reversal: The chart shows a strong rally throughout late September and early October, followed by a dramatic and impulsive bearish reversal starting around October 24th.
Fair Value Gap (FVG): A large Fair Value Gap (FVG) is clearly defined by the gray shaded box. This gap represents an area of price inefficiency created during the aggressive drop.
The price is currently trading within the lower boundary of this FVG (the current price is around $3,983.70).
CRT-L (Consequent Retracement Low): The upper line of the FVG (around $4,070) is the price level that marked the top of the range.
CRT-H (Consequent Retracement High): The lower line (around $3,935) appears to mark the 50% midpoint of the large down candle that created the FVG, or possibly a key level within the gap.
Proposed Price Action:
The current price action suggests an immediate continuation of the drop (indicated by the large green arrow) towards the CRT-H level ($3,935).
The curved black arrow suggests an alternative or subsequent scenario: the price might retest the upper part of the FVG (near $4,000) before making its eventual move.
Interpretation & Trading Bias
The overall bias is bearish due to the magnitude and speed of the recent drop.
The immediate focus of the analysis seems to be on a potential move lower to fill the remaining portion of the FVG, specifically targeting the CRT-H level. The FVG itself acts as a large zone of resistance and price mitigation. The daily timeframe suggests this drop is part of a major structural shift.

Watch for support at 3990-3980 to consider going long on gold.#XAUUSD TVC:GOLD OANDA:XAUUSD
Gold prices have repeatedly tested the 4030 level without a successful breakout. Gold has now begun to decline, with short-term bears gradually releasing their momentum. Further downside is expected, with support expected in the 3990-3980 range. If gold prices can pull back to this range in the short term, we can consider going long on gold in anticipation of a rebound. Target range: 4030-4050
GOLD at breakout level? What's next ??#GOLD.. market just reached at his current breakout area that is around 3945 .
If market sustain below than we can expect further drop...
Good luck
Trade wisely

echnical analysis for your XAU/USD (Gold vs USD) chart:XAU/USD (Gold) 15-Min Chart Analysis – 29 Oct 2025
Market Structure
The previous descending channel has been broken to the upside, indicating a potential trend reversal from bearish to bullish.
Price retraced back to a support level zone (≈ $3,920 – $3,940), where buyers are likely to defend.
Key Levels
Support Zone: 3,920 – 3,940
→ Price already tested this area with strong rejection wicks, showing buyer interest.
Resistance Zone: 3,980 – 4,020
→ Short-term resistance; a breakout above 4,020 confirms bullish momentum.
Target Level: 4,142
→ As marked on your chart, this is the projected bullish target after confirmation of upward continuation.
Price Action
After a downward correction, gold found support and formed a double-bottom-type pattern near the 3,940 level.
Price is currently consolidating above support, signaling potential accumulation before an upward push.
Momentum Outlook
If price holds above 3,940, expect a move towards 4,000 → 4,020, followed by a breakout to 4,142 (target).
However, if 3,920 support breaks, the price may retest 3,880–3,860, resuming short-term bearish momentum.
📈 Trading Bias
Bullish bias above 3,940 (target 4,142).
Bearish only below 3,920 (target 3,860). EURONEXT:FTI1! EURONEXT:VM81! EURONEXT:PH6X2025 EURONEXT:PH8Z2025 EURONEXT:ZT8F2026 EURONEXT:ER8Z2025 EURONEXT:UY8F2026 EURONEXT:VC8F2026 EURONEXT:ZF8F2026 EURONEXT:ZU8F2026 EURONEXT:VJ8F2026 EURONEXT:AH7X2025

Fomc Xauuusd quick buy Gold (XAU/USD) is showing bullish momentum after FOMC news, bouncing from support around 3951. Price targets are set near 4153 and the long-term target at 4376. A breakout above resistance could trigger a strong upward move.

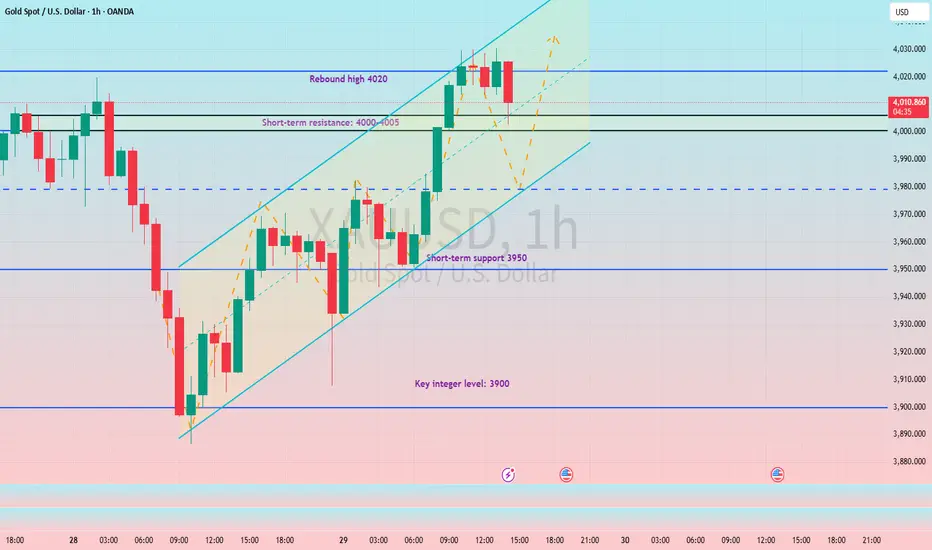
This is just a rebound, not a reversal. Continue to short gold.The Fed's interest rate decision is highly anticipated, and the question remains whether gold bulls can stage a comeback. Gold is currently in a rebound and correction phase after an oversold condition. It's premature to declare a complete reversal of the bullish trend. Gold's rebound from its lows suggests a period of consolidation in the short term, awaiting the Fed's decision to determine its direction.
The 1-hour moving averages for gold continue their downward crossover, indicating that the bullish momentum hasn't fully materialized. However, there is gradually building support at lower levels. If a strong upward surge occurs before the Fed's decision, the bullish momentum may wane afterward. A break above 4020 would confirm a true V-shaped reversal for gold. Failure to break through 4020 suggests continued range-bound trading, with support around 3890. A hold above 3890 would likely lead to a rebound.
With the Fed's interest rate decision looming, let's wait patiently. Whether gold has finished its correction and whether the bulls have begun their counterattack remains to be seen. We'll observe the strength of the bulls after the Fed's decision. If gold breaks through and holds above 4020, the short-term upward momentum will increase.
Trading Strategy: Sell gold at 4010-4020, with a target of 3950-3930.

XAUUSD Ideathis pair has formed a valid ascending channel and a valid ascending trendline
in my opinion this would be the move of the gold
but first gold need to break the red trendline with a candle that close under the touch of the trendline
dont forget today there is very affective news about the interest rate
so be careful with your risk management
Follow for more ideas

Gold Bullish Butterfly Forming – Reversal Ahead?As I expected in the previous idea , Gold started declining from the Resistance zone($4,192 – $4,137) and has now reached the Support zone($4,004 – $3,895) — full target achieved .
At the moment, Gold is moving within that Support zone($4,004 – $3,895) and Potential Reversal Zone(PRZ) .
Looking at the 1-hour time frame , we can spot a Bullish Butterfly Harmonic Pattern forming, which is likely to complete right in that PRZ .
I expect that in the coming hours, once Gold enters the PRZ , it could rise at least up to around $4,057(First Target) .
Second Target: $4,132
Stop Loss(SL): $3,889(Worst)
Please respect each other's ideas and express them politely if you agree or disagree.
Gold Analyze (XAUUSD), 1-hour time frame.
Be sure to follow the updated ideas.
Do not forget to put a Stop loss for your positions (For every position you want to open).
Please follow your strategy; this is just my idea, and I will gladly see your ideas in this post.
Please do not forget the ✅ ' like ' ✅ button 🙏😊 & Share it with your friends; thanks, and Trade safe.

gold on sell reverse#XAUUSD price have breakout the 4000 price on retracement. Now we await for 2 times breakout below 4013 before selling.
Below 4013 sell on 2 times breakout, target 3986-3959, stop loss 4027.
Buying can be valid if the Fed rates gives something good.

#XAUUSD: Two Entries, Three Targets, Swing Sell! Gold dropped to 3883 region, the lowest point in the last two months. Since then, it has started rebounding. Currently, the price is approaching a very important key level, which could lead to a smooth reversal. However, market conditions will be extremely volatile, making it difficult to predict any move. This is because we have the NFP coming up. Due to this volatility, both of these entry points are equally possible.
Once either entry is confirmed, you should place a target based on your risk management and trade planning. Remember, this is not a confirmation, and the price could go in the opposite direction. Please do your own analysis before making any financial decisions.
We are here to help. If you have any questions related to this analysis or any trading matter, please drop a comment. We will do our best to help you out. If you want to support us, please like and comment on the idea.
Team Setupsfx_

XAU USD Last bullish leg ?Price has broken short-term bearish structure and moved above the moving-average channel with strong momentum, indicating a shift toward bullish control. The rising trendline is holding as support, confirming structural reversal.
Fibonacci levels provide clear upside targets, with 38.2% at 4040–4050 as the first objective, followed by a constrained upper target near 4070, just below the 61.8% retracement and prior supply zone.
As long as price holds above the breakout zone and trendline, continuation toward 4040–4070 remains the most probable outcome.

XAU/USD | Testing Deeper Support ZoneYesterday’s analysis is playing out as expected — the first support zone has failed, and price is now testing the Deeper Support Zone (3,944–3,884). The continued downside momentum confirms that sellers remain firmly in control, with short-term sentiment still leaning strongly bearish.
Gold is currently trading around 3,930, holding well below both the MA50 and MA200, reinforcing ongoing downside pressure. If buyers can defend this zone and push price back above 3,987, a corrective rebound toward 4,042 and 4,095 could follow.
However, a clean break below 3,884 would likely open the door for a deeper decline toward 3,820–3,781, where dip-buyers may look to re-enter the market.
📌 Key levels to watch:
Resistance:
3944
3987
4042
4095
4137
Support:
3884
3820
3781
Despite the current correction, the overall bullish trend remains intact, with the recent sell-off seen as a healthy correction within the broader bullish trend.
🔎 Fundamental Focus:
It’s a big week for the U.S., with the FOMC rate decision and press conference on Wednesday expected to draw most of the market’s attention.
Before that, traders will be watching Consumer Confidence and Pending Home Sales data today.
The backdrop remains tense with the U.S. government shutdown still unresolved, keeping overall sentiment cautious across markets.

XAU/USD Intraday Plan | Gold Rebounds Ahead of FOMCPrice is respecting the analysis well — after testing the Deeper Support Zone (3944–3884), gold saw a strong rejection. Price has since rebounded and is now trading around 4017, showing signs of short-term recovery after several sessions of heavy downside pressure.
Gold has reclaimed the 4000 handle and moved back above the MA50, while also breaking the 1H structure to bullish. However, price still trades below the MA200, suggesting that short-term momentum has turned bullish.
For continuation, buyers need to secure a close above 4042, which could open the path toward 4095 and 4137.
On the downside, if price fails to hold above 3987, we could see another retest of 3944–3884, the same zone where buyers previously stepped in.
📌 Key levels to watch:
Resistance:
4042
4095
4137
4178
Support:
3987
3944
3884
3820
🔎 Fundamental Focus:
All eyes are on the FOMC events later today, with the Federal Funds Rate, FOMC Statement, and Press Conference scheduled in the evening.

Gold Breaks Key Support Zone — Bearish Momentum Builds Below $4,Analysis:
The XAU/USD (Gold vs. USD) 45-minute chart shows a clear breakdown below the established support zone, indicating a shift in market sentiment from consolidation to bearish momentum.
The support zone around $4,050 – $4,000 had previously held multiple times, acting as a strong demand area.
The recent breakout below this zone confirms a potential trend continuation to the downside.
Price action suggests a bearish pattern with lower highs and lower lows forming before the breakout.
A retest of the broken support (now resistance) may occur before the next leg lower.
The next major target lies near $3,900 – $3,850, aligning with the projected measured move.
Technical Outlook:
If gold fails to reclaim the $4,050 level, further downside pressure remains likely. However, a close back above this level could invalidate the bearish breakout and signal a possible false break.

GOLD Still Very Bearish , 2 Short Setups Valid To Get 500 Pips !Here is My 30 Mins Gold Chart , and here is my opinion , we are Below 3972.00 With 4H Candle And this never happened for a long time ! and we have a 4H Candle closure below it And Perfect Breakout and this give us a very good confirmation , so we have a good confirmation now to can sell after the price go back to retest the broken area 3972.00 and this will be my best place to sell to can use small stop loss , and i have another place if he price will not go up more to retest 3972.00 m we have a very good res level 3940.00 , if we have a good bearish price action when the price touch it we can sell from it and targeting 100 to 200 pips , and if the price didn`t give us a good bearish price action from it i will wait the price at 3972.00 to can sell and targeting 200 to 500 pips , if we have a daily closure above this area this mean this idea will not be valid anymore .
Reasons To Enter :
1- Perfect Breakout .
2- Clear Bearish Price Action .
3- Bigger T.F Giving Good Bearish P.A .
4- Bearish Control .
5- Perfect 4H Mins Closure .

GOLD | Daily Analysis #1 - 29 October 2025Hello and welcome back to DP
Today we’re excited to launch our Gold daily analysis series. We hope this new addition provides useful and practical insights for your trading decisions. Please support us with your follows and reactions — it really helps us grow!
Market Review:
After a strong bullish run over the past 2–3 weeks, gold finally started to correct from October 20, 2025, continuing its decline up until yesterday.
On the daily timeframe, we’ve identified:
• Support: 3,897
• Resistance: 4,155
Today’s trading session is particularly important as the Federal Reserve’s interest rate decision is due.
According to CME FedWatch, there’s about a 95% probability that the Fed will cut rates by 25 basis points.
Until the announcement, we may see choppy and sideways movement, but once the decision is released, expect a surge in volume and sharp “kangaroo” moves in both directions as traders react to the news.
1H–4H Technical Analysis:
As seen on the chart, 3,897 and 4,155 remain our key daily support and resistance zones.
• If price breaks above 4,012 and confirms the breakout, gold may extend higher toward 4,083 as the first upside target.
• On the other hand, if price drops below 3,974, it may continue falling toward the 3,897 support zone.
With the Fed’s rate decision approaching, expect increased volatility.
Whichever direction price confirms after the announcement could set the tone for gold’s next major move.
Trade cautiously, keep your stop-loss tight, and avoid chasing price during the initial volatility spike.
Disclaimer:
This content is for informational purposes only and does not constitute financial or investment advice. © DIBAPRISM
Amir D.Kohn

XAU/USD 29 October 2025 Intraday AnalysisH4 Analysis:
-> Swing: Bullish.
-> Internal: Bullish.
Analysis and bias remains the same as analysis dated 20 October 2025.
Price has printed as per previous intraday expectation by printing a bearish CHoCH which indicates, but not confirms, bullish pullback phase initiation.
Price is currently trading within an established internal range, however, I will continue to monitor price with regards to depth of pullback.
Intraday expectation:
Price to continue bearish, react at either discount of 50% internal EQ, or H4 supply zone before targeting weak internal high priced at 4,380. 990.
Note:
The Federal Reserve’s sustained dovish stance, coupled with ongoing geopolitical uncertainties, is likely to prolong heightened volatility in the gold market. Given this elevated risk environment, traders should exercise caution and recalibrate risk management strategies to navigate potential price fluctuations effectively.
Additionally, gold pricing remains sensitive to broader macroeconomic developments, including policy decisions under President Trump. Shifts in geopolitical strategy and economic directives could further amplify uncertainty, contributing to market repricing dynamics.
H4 Chart:
M15 Analysis:
-> Swing: Bullish.
-> Internal: Bearish.
As expected, price has printed a bullish CHoCH to indicate bullish pullback phase initiation.
Price is now trading within an established internal range.
Intraday expectation:
Price to continue bullish, react at either premium of internal 50% EQ or M15 demand zone before targeting weak internal low, priced at 3,886.456.
Note:
Gold remains highly volatile amid the Federal Reserve's continued dovish stance, persistent and escalating geopolitical uncertainties. Traders should implement robust risk management strategies and remain vigilant, as price swings may become more pronounced in this elevated volatility environment.
Additionally, President Trump’s tariff announcements, particularly against China, are expected to further amplify market turbulence, potentially triggering sharp price fluctuations and whipsaws.
M15 Chart:
