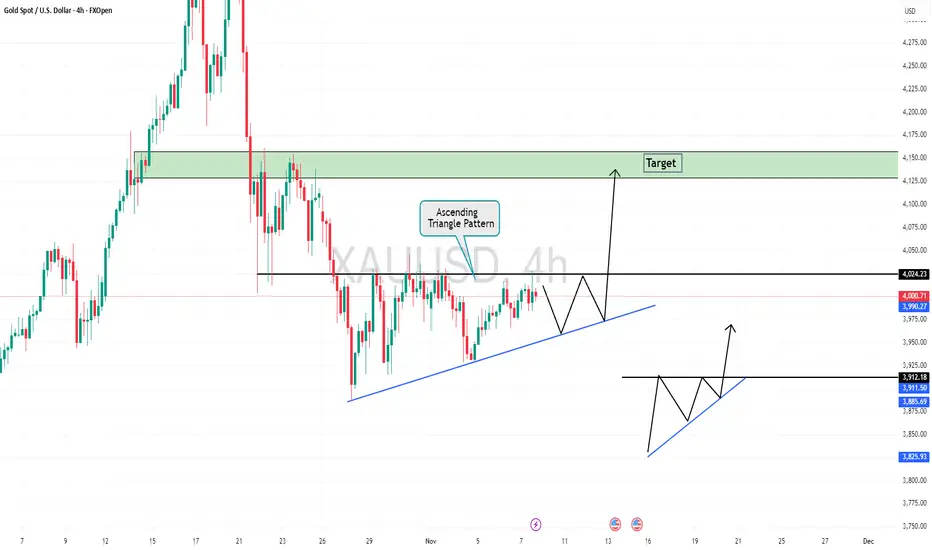
Gold is Ready For Bull From Triangle PatternHello Traders
In This Chart GOLD HOURLY Forex Forecast By FOREX PLANET
today Gold analysis 👆
🟢This Chart includes_ (GOLD market update)
🟢What is The Next Opportunity on GOLD Market
🟢how to Enter to the Valid Entry With Assurance Profit
This CHART is For Trader's that Want to Improve Their Technical Analysis Skills and Their Trading By Understanding How To Analyze The Market Using Multiple Timeframes and Understanding The Bigger Picture on the Charts
Xauusdanalysis
XAU/USD) Technical Outlook – Potential Bearish Reversal Below Gold is currently trading near $4,001, consolidating just below a key resistance zone between $4,015 – $4,025. Price action has formed a rising wedge pattern, suggesting weakening bullish momentum.
The chart indicates that sellers could regain control if the price fails to break above the resistance level. A potential fakeout or retest of the upper resistance might occur before a sharp bearish move.
If bearish pressure confirms below $3,995, the next target lies around $3,965, aligning with the marked target zone and prior support.
Key levels to watch:
Resistance: $4,015 – $4,025
Support: $3,995 / $3,965 (target zone)
Bias: Bearish below resistance; potential short setup after rejection confirmatio EURONEXT:BE8Z2025 EURONEXT:BXF1! EURONEXT:CU6X2025 EURONEXT:ES6X2025 EURONEXT:AB6X2025 EURONEXT:AB7X2025 EURONEXT:AB8Z2025 EURONEXT:AG8Z2025 EURONEXT:AV6X2025 EURONEXT:AV8Z2025 EURONEXT:BL6X2025 EURONEXT:BL6X2025

XAUUSD H1 – Liquidity Sweep & Smart Reentry ZoneAfter a strong impulsive rally, gold reached the premium zone (1.5–1.618 extension) and created a set of Equal Highs (BSL) — a clear liquidity pool above 4148.
I’m anticipating a short-term retracement before continuation, as smart money often rebalances after grabbing liquidity.
🔹 Technical Breakdown (SMC Flow)
Sell Zone (Supply / OB): 4224 – 4228 (SL 4235)
→ Price reached the extreme of a premium H1 OB, aligning with FIB 1.5–1.618.
→ This area remains a valid sell-to-buy reaction zone if M15 shows a CHoCH.
Buy Zone (Demand / OB): 4086 – 4082 (SL 4070)
→ Confluence with 0.5–0.618 retracement and previous structure base.
→ Expecting sell-side liquidity sweep into this zone before a bullish continuation.
Target Zone: 4158 – 4160
→ The next Buy-Side Liquidity (BSL) resting above Equal Highs.
→ Ideal take-profit area for intraday longs from discount levels.
📈 My View
The bias remains bullish on H1, as long as 4070 holds.
I’ll patiently wait for a liquidity sweep into BUY zone followed by a clear M15 CHoCH confirmation — that’s where I’ll look for entries toward 4158–4160.
💭 Note from Karina
This structure perfectly reflects how liquidity drives movement — not emotion, not indicators.
Patience and precision are the true edge of a trader.
This is my personal view based on SMC principles – not financial advice.
Like & Follow for daily London session updates 💛

Gold H1 – End of Wave 5: Is a Corrective ABC Coming?⚡ XAUUSD – Elliott Wave Intraday Outlook | 11/11
📈 Elliott Wave Context
Gold has completed a clean 5-wave impulsive structure on the H1 timeframe, with Wave 5 pushing into the premium zone above 4130.
Price now shows early exhaustion at the highs, suggesting the market is preparing to transition into a corrective ABC phase.
A confirmed reversal signal will be:
✅ H1 close below the Wave 2–4 trendline → confirming the start of Wave A.
🔎 Technical Breakdown (Wave Structure)
• Wave 1: Initial rally from 3964
• Wave 2: Shallow pullback near 3985
• Wave 3: Strong impulsive breakout toward 4070+
• Wave 4: Mid-cycle correction holding structure
• Wave 5: Final push topping around 4130–4140 (current swing high)
The 5-wave impulse is now completed → market likely moves into A–B–C correction.
📉 Expected Elliott Wave Path (ABC)
Wave A
• First levels: 4105 (Fibo 0.236)
• Main target zone: 4078 (Fibo 0.382)
Wave B
• Corrective rebound toward
o 4105, or
o 4115–4120
Wave C
• Strongest leg of correction
• Ideal target zones:
o 4035 (Fibo 0.618 retracement of the full 1–5 impulse)
o 4004 (Fibo 0.786 retracement)
• Wave C often ≈ Wave A → aligns with 4035–4004
📌 Intraday Trade Plan (Elliott-Based)
✅ Scenario 1 – SELL the upcoming correction (Preferred)
Entry:
• After H1 candle closes below the 2–4 trendline,
or wait for a Wave B retest into 4105–4120.
Stop Loss:
• Above the Swing High → 4145
Take Profit:
• TP1: 4078
• TP2: 4035
• TP3: 4004
✅ Scenario 2 – BUY only if wave invalidation occurs
If gold breaks and holds above 4145, Wave 5 may be extending.
Entry: above 4145
SL: 4120
TP: 4170–4200
✅ Summary
Gold has finished a textbook 5-wave impulse and is now likely entering a corrective ABC structure.
The highest-probability opportunity today is to sell the Wave B retracement and target deeper corrective zones at 4035–4004.

XAU/USD Intraday Plan | Momentum Strong, Resistance AheadGold continued its bullish move, breaking above the 4074 and 4115 resistance levels and pushing up into the 4153 zone. Price is now showing early signs of slowing momentum at this level, which has acted as a reaction area in the past.
Price is currently trading around 4128, still well above both the MA50 and MA200. However, buyers need to hold above 4115 to maintain the upside. A clean break above 4153 could open the way toward 4197 next.
If price fails to hold above 4115, we could see a pullback first into 4074, and if selling pressure deepens, the 4027 level and the First Reaction Zone (3984–3955) remain key areas where buyers have previously stepped back in.
📌 Key Levels to Watch
Resistance:
4,153
4,197
Support:
4,115
4,074
4,027
3,984
3,955
3,921
3,884
🔎 Fundamental Focus
This week remains highly sensitive due to ongoing developments around the U.S. government shutdown.
Today is a U.S. bank holiday, meaning liquidity may be lower, we may see exaggerated moves and less stable price action.

XAU/USD – Gold Reaches Supply Zone Prepare for a Pullback to FVg📊 Market Structure
Gold continues to maintain its bullish structure after breaking the structure high (BoS) at the 4,000 USD zone and forming a steep bullish channel over the past 3 sessions.
Currently, the price is precisely hitting the Order Block 4,140 – 4,150 USD — a critical supply zone formed from the previous distribution.
The H1 candle is showing slight technical reaction signs , implying the potential for a short pullback to re-accumulate liquidity.
If a pullback occurs, the Premium Zone 4,080 – 4,085 USD and FVG 4,025 – 4,035 USD will be ideal areas to look for buy signals.
The bullish structure is only invalidated if the H1 candle closes below the Support 4,006 USD zone.
💎 Key Technical Zones
• Order Block: 4,140 – 4,150 USD → main supply zone, where profit-taking pressure appears
• Premium Zone: 4,080 – 4,085 USD → medium-term rebalancing zone
• FVG Zone: 4,025 – 4,035 USD → potential discounted price zone for BUY orders
• Support Zone: 4,000 – 4,006 USD → critical defense zone
🎯 Trading Plan
1️⃣ SELL Scalp – Reaction at OB 4,145 USD
If the price continues to react downwards at the 4,140 – 4,150 USD supply zone:
• Entry: 4,143 – 4,147
• SL: 4,155
• TP1: 4,085
• TP2: 4,035
→ Short-term setup, targeting the rebalancing zone before buying back in line with the trend.
2️⃣ BUY Setup – Continuation from FVG Zone
When the price pulls back to the FVG / Premium Zone and creates a confirmed bullish signal:
• Entry: 4,030 – 4,035
• SL: 4,006
• TP1: 4,090
• TP2: 4,145
• TP3: 4,170
→ Trend-following setup, preferred when the price re-accumulates and a clear rejection appears.
🧠 Vincent’s View
Buyers still control the market, but the current OB touch may trigger a short pullback before the bullish wave continues.
The ideal scenario is “tap OB → pullback FVG → continuation,” maintaining a stable bullish structure towards the 4,170 USD target.
“Buy the dip where fear replaces greed — that’s where the next impulse begins.” ⚜️
⏰ Timeframe: 1H
📅 Updated: 11/11/2025
✍️ Analysis by: Captain Vincent

The bull market has returned. Am I bullish at this price level?#XAUUSD TVC:GOLD OANDA:XAUUSD
Gold prices performed strongly yesterday, closing with a large bullish candle on the daily chart and stabilizing above the daily MA5, officially signaling the return of bulls to the market.
Gold strengthened further today, and from a technical perspective, the bullish trend remains intact. Therefore, continuing to go long on gold is clearly safer. The bullish signal given last night regarding a pullback to the 4075 support level remains valid. However, with the passage of time and the continued strength of gold, a direct pullback to this level in the short term is somewhat difficult. But as a point of multiple pullbacks on smaller timeframes and near the daily MA20, the 4075 support remains reliable. Therefore, we can consider it a defensive level for the short-term bulls. As long as gold prices remain above this level, the bullish momentum will not change.
Currently, looking at the hourly chart, the 4125-4110 range is the support zone for the short term. If the price retraces to this level during the European session, it would be a good entry point, and we can continue to go long on gold within this range.

LiamTrading – XAUUSD H2 | A corrective move may occur todayLiamTrading – XAUUSD H2 | A corrective move may occur today
Follow Liquidity 4090, FVG 4053–4069 & VAH ~4025
Quick note: Gold remains in an uptrend but shows signs of stalling at the upper boundary of the ascending channel. Amid the backdrop of potential USD fluctuations as the US nears reopening, a technical correction towards liquidity zones is a scenario to prepare for.
Technical Analysis
Trendline/Price Channel: Price is moving within an ascending channel; the channel top at 4130–4140 is prone to profit-taking/stalling.
Liquidity: 4085–4092 – a price pull/volume attraction point before choosing the next direction.
FVG #1: 4053–4069 – a price gap with a probability of filling and reversing.
VAH (Volume Profile): 4023–4028 – volume value peak; strong confluence support in case of a deep correction.
POC: ~3985–3990 – a magnetic point if the market weakens more than expected.
Resistance: 4135–4140 (near channel top + short-term offer), further out 4166 (Fibo/channel top extension).
Fibonacci: The latest upward wave shows the expansion area around 4135–4166 as a “liquidity pocket” – suitable for scalp sell upon clear rejection; retracement levels 0.382–0.5 converge around 406x–402x, aligning with FVG & VAH → preferred buy point if price corrects.
Trading Scenarios
Buy shallow pullback (trend-following)
Entry: 4083–4085
SL: 4077
TP: 4098 → 4112 → 4140 → 4166
Note: Requires rejection/candle wick at Liquidity 4090; move SL to breakeven at +1R.
Buy deep at VAH/Volume Profile
Entry: 4025–4028
SL: 4020
TP: 4040 → 4065 → 4100 → 4112
Note: Prioritize when FVG 4053–4069 fills and reverses; exercise caution with volume.
Sell scalp at channel resistance (counter-trend)
Entry: 4135–4140
SL: 4148
TP: 4122 → 4105 → 4090
Note: This is a scalp trade; abandon if H1/H2 closes strongly above 4140.
H1/H2 closes below 4077 → risk of testing 4053–4069; further breach of 4020 may drag to POC ~3990.
Each trade risks 0.5–1%, do not average down against the trend; adhere to Dow (enter only upon confirmed support/resistance break on entry timeframe).
What level are you watching for gold today? Comment below & hit Follow on LiamTrading channel for the fastest updates.

Gold Hits 4150 Resistance: Healthy Correction or Reversal?1. What Happened in the Last 24 Hours
Gold delivered an impressive bullish surge of over 1000 pips, reaching the 4150 resistance zone — precisely the level mentioned in yesterday’s analysis. The move was nearly one-directional, with only a brief intraday retracement after crossing above 4100.
2. Market Context
Such a strong advance often leads to short-term exhaustion, and that’s exactly what we’re seeing now. After touching the 4150 resistance, the price has started to pull back, which appears to be a normal correction rather than a trend reversal.
3. Technical Outlook
The first key support for bulls lies near 4075, followed by the 4050 zone, which is now an important structural level. As long as these supports remain intact, the uptrend remains healthy and the probability of another bullish leg is high.
4. Trading Plan
I remain bullish on Gold and plan to buy dips toward 4075–4050 zones. A sustained hold above these levels could open the way for a retest of 4200 resistance in the next sessions.
If the price falls below 4050 with strong momentum, I’ll reassess the bias — but for now, the path of least resistance is still up.
5. Conclusion
Yesterday’s explosive rally confirmed the bullish structure, and today’s pullback looks like a healthy correction within an ongoing trend. As long as 4050–4075 holds, buying dips remains the smart play. 🚀

XAU/USD – Ahead of U.S. Data: Continuation or Reversal?🌐 MARKET CONTEXT
The gold market is currently navigating a juncture of competing forces: on one hand, the continuing expectation of central bank pivoting and safe-haven demand; on the other, risks from a stronger U.S. dollar and higher real yields. For instance, recent commentary highlighted that gold broke above ~US$4,074-oz amid weak U.S. data and growing hopes of a Fed rate cut.
OneRoyal News
+2
ODI: Think change
+2
Additionally, the milestone of gold surpassing US$4,000 per ounce has underlined both its strong momentum and the questions about whether this is a sustainable trend or ripe for a pullback.
World Gold Council
+1
From a sentiment standpoint:
The risk-on component: if data disappoints, gold could rally further.
The risk-off / hawkish policy risk: if inflation or jobs data surprise to the upside, the dollar and rates may rise, weighing on gold.
For the upcoming London → New York sessions, focus is on how gold reacts around major technical zones, and whether price structure shows continuation or reversal.
Thus, the bias today is conditional bullish, leaning long on confirmed demand zones, but ready to flip to bearish if supply zones trigger rejection.
📉 TECHNICAL ANALYSIS (SMC + Liquidity Structure)
The price is in a broader up-trend (following the breakout above key resistance zones) but is now entering high-probability structural decision zones.
We have clear Supply and Demand zones:
Some prior Resistance turned Support zones around ~4,021-4,074 (per recent reports) act as demand/higher-probability buy areas.
OneRoyal News
+1
A supply zone around ~4,080 and above is noted as a target and potential reversal area if momentum falters.
OneRoyal News
+1
Regarding SMC confirmations: look for liquidity sweeps (stop-loss hunts), fake BOS (Break of Structure), or mitigation before entering. A clean confirmation before a trade increases probability.
Example: If price rises into 4,080-4,078 and then sweeps above 4,086 then reverses, that may signal a “trap buy and sell” scenario (structure break then reversal). Conversely, if price dips to 3,990-3,988 or 3,930-3,928 and shows a sweep of liquidity then a strong bullish candle, we may have a CHoCH and continuation long.
🔑 KEY PRICE ZONES
4,080–4,078 ▶️ Sell Zone – High-probability supply nearest to session high, look for rejection.
4,161–4,163 ▶️ Buy Zone – A higher demand zone / breakout target area acting as strong structural bounce.
4,081–4,083 ▶️ Buy Zone – Demand zone near current structure, reactive long setup if confirmed.
3,990–3,988 ▶️ Buy Zone – Deep demand/support zone for larger reversal potential.
Stop-loss levels:
Sell stop-loss: 4,086
Buy stop-loss (4,161 zone): 4,155
Buy stop-loss (4,081 zone): 4,075
Buy stop-loss (3,990 zone): 3,982
⚙️ TRADE SETUPS
✅ BUY SCENARIO 1 – STRUCTURAL SUPPORT HIGH TARGET
Entry: 4,161–4,163
Stop-loss: 4,155
TP1: ~4,180 TP2: ~4,210 TP3: Open
Logic: A breakout into this zone or strong bounce from it would indicate continuation of bullish momentum and structural demand dominance.
✅ BUY SCENARIO 2 – MID-STRUCTURAL DEMAND
Entry: 4,081–4,083
Stop-loss: 4,075
TP1: ~4,100 TP2: ~4,135 TP3: Open
Logic: A reactive long setup if price pulls back to this zone and confirms demand (liquidity sweep + bullish candle). Good London session focus.
✅ BUY SCENARIO 3 – DEEP SUPPORT ACCUMULATION
Entry: 3,990–3,988
Stop-loss: 3,982
TP1: ~4,020 TP2: ~4,060 TP3: 4,100+
Logic: Larger-scope reversal zone, ideal if price falls into this area and shows structure change (CHoCH) from bearish to bullish.
⚠️ SELL SCENARIO – SESSION SUPPLY REJECTION
Entry: 4,080–4,078
Stop-loss: 4,086
TP1: ~4,040 TP2: ~3,990 TP3: ~3,930
Logic: If price rises into this supply zone and shows rejection (e.g., wick up, reversal candle) then expect a short. Especially potent during New York session when liquidity is high.
🧠 NOTES / SESSION PLAN
Prioritize confirmation: don't enter solely on touching zone — wait for structure (M5/M15) and liquidity event.
London session: likely focus on BUY setups (4,081 zone, 3,990 zone).
New York session: monitor for the SELL setup at 4,080–4,078 if price approaches.
Monitor macro data releases (U.S. inflation, job numbers) which could provoke volatility and invalidate setups.
Risk management: each trade should respect stop-loss and maintain risk ≤2% of account; trail stops once TP1 hits.
Avoid chasing after large rapid moves; allow the market to structure into zones rather than predicting broken conditions.
🏁 CONCLUSION
The bias for today: bullish conditional — we favour buys on confirmed demand zones (4,161–4,163; 4,081–4,083; 3,990–3,988) but remain alert for a bearish reversal if price exhausts into the supply zone around 4,080–4,078 with clear rejection. Today’s structure offers a wide range of actionable zones; success will depend on discipline to wait for confirmation and managing risk strictly.

Gold H1 - Holds Above 4,140$, Eyes the 4,200$ Breakout🔍 Market Context
Gold continues its relentless climb, trading near a three-week high at 4,146$ as buyers remain firmly in control.
Despite a mild rebound in the US Dollar — driven by cautious sentiment across Asian markets — gold’s momentum stays intact, fueled by expectations that the Federal Reserve may proceed with a rate cut in December.
Soft US data last week and weaker consumer sentiment readings have further strengthened this outlook, keeping real yields under pressure and reinforcing gold’s safe-haven appeal.
📊 Technical Outlook (H1–H4)
The market structure remains bullish, forming a clear ascending channel.
Price has broken above the previous resistance at 4,086$ and is now consolidating around 4,140$, preparing for a potential continuation move.
Key Levels:
• Support Zones: 4,086$ – 4,039$ → retest area for new buyers
• Immediate Resistance: 4,146$
• Breakout Target: 4,203$
• Extended Bullish Target: 4,382$ (ATH zone)
If gold maintains structure above 4,080$, the bias remains strongly bullish.
Only a confirmed close below this zone would suggest a short-term pullback before continuation.
⚜️ MMFLOW Insight:
“Momentum follows liquidity. Once price reclaims key structure, smart money builds the next leg — not noise, but narrative.”

XAUUSD (Gold) Daily Chart Analysis: Reaching Key Resistance/FVGKey Observations and Analysis
Recent Price Action: Gold has experienced a strong upward move, currently trading around $4,142.19. This rally has approached a critical area marked on the chart.
Key Resistance / Fair Value Gap (FVG): The price is entering a large shaded box labeled "D / FVG".
This box, spanning from approximately $4,160 to $4,240, represents a Daily Fair Value Gap (FVG) or a significant imbalance left by a prior sharp move down (a large bearish candle on November 21st-22nd).
In technical analysis, particularly concepts like Smart Money Concepts (SMC), an FVG acts as a high-probability target where the market often returns to fill the inefficiency. It also typically serves as a strong resistance zone.
Break of Structure (BOS): An area labeled "BOS" (Break of Structure) around the $4,020 level indicates a recent shift in market structure from potentially bearish/ranging to bullish on this timeframe, confirming the recent upward momentum.
Prior Low ('X'): A previous low labeled "X" around the $4,000 psychological level was initially respected before the rally commenced.
Expected Reaction: The chart includes a projected price path (the black arrow/zigzag line) suggesting the price may tap the FVG and then experience a reversal or sharp pullback from this key supply/imbalance zone.
Conclusion
The XAUUSD market is currently testing a significant Daily Fair Value Gap (FVG) / Resistance zone. Traders will be looking for a reaction around the $4,160 - $4,240 area to determine if the bullish momentum will pause, reverse, or break through to continue higher.

Bitcoin Short Setup From Premium Zone
The market is showing a clear 1H break of structure, with price approaching a strong resistance area. After a bullish impulse, BTC is expected to pull back from resistance for a short-term correction.
Key Levels:
Sell Entry: Around 106,000
Stop Loss: 106,700
Take Profit: 104,100
Reasoning:
Technically:
Price has completed a clear bullish leg and tapped into the 1H resistance area. The structure suggests exhaustion with the potential for rejection. A lower high formation suggests bearish correction toward the 1H support zone.
Fundamentally:
Market sentiment remains cautious as BTC faces resistance amid uncertainty in broader crypto risk appetite and mild dollar strength. Short-term selling pressure may dominate before any new bullish continuation.
Disclaimer:
This analysis is for educational purposes only. It is not financial advice. Always manage risk before trading.

Accurate prediction of an upward trend has arrived as expected.The protracted US government shutdown is finally coming to an end! The Senate has cleared procedural hurdles, and the temporary funding bill has passed a procedural vote, ensuring government funding until January. The shutdown is likely to end this weekend.
As soon as the news came out, the market went from cloudy to sunny – the previous shutdown had tightened liquidity, but now it seems to be easing, and the precious metals market is leading the rebound. Although the shutdown isn't completely resolved, the resumption of negotiations between the two parties has sent a positive signal, boosting risk appetite and relieving the anxiety of watching partisan infighting.
To put it simply, this "temporary extension" by the US government is like a reassurance to the market. Investors who were panicking before the shutdown can now breathe a sigh of relief. All that's left is to wait for the final decision so that the government can fully "reopen for business"!
Gold broke out of a two-week low-level triangle pattern in the previous trading session, ushering in a strong upward trend. Yesterday's market exhibited a three-stage upward trend: higher in the Asian session, continued gains in the European session, and accelerated gains in the US session. Each rally was followed by a period of consolidation without significant pullbacks, a classic characteristic of extremely strong market conditions.
Regarding the future trend, the bullish outlook remains unchanged for today.
On one hand, the current situation strongly suggests a period of high-level consolidation: given the current extremely strong pattern, gold is more likely to continue its "time-for-space" consolidation, digesting pressure before resuming its upward movement. If this pattern holds, aggressive long positions can be considered before the European session.
On the other hand, if a pullback occurs: the 4116-4110 range should be closely watched, as this will act as a crucial support level. If the price retraces to this range and stabilizes, long positions can be considered on the pullback.
Gold price analysis November 11Gold continued to move as expected in yesterday's session, bringing impressive profits to traders who followed the previous strategy.
Currently, the resistance zone of 4150 is acting as an important barrier as buying pressure starts to slow down. There is a high possibility that the market will see a short-term correction around this area.
Current strategy:
SELL GOLD (Scalping) around the resistance zone of 4145, expecting a short-term price reaction.
When the buyers return and create a confirmation signal around the 4076–4106 area, wait to BUY in line with the main trend, with a further target towards ATH 4375, where the liquidity zone above is still empty.
📈 The overall trend is still up – the correction is only temporary for the market to gain momentum for the next wave.

Gold: Bullish Trend, but Watch Selling Pressure at 4150/4186Driven by safe-haven demand, gold saw a strong one-way rally yesterday. After breaking above the 4030 resistance, price surged past 4100 and is now approaching the 4150 area. The 4150–4163 zone served as a consolidation region during the previous decline, so some selling pressure here is normal.
However, keep an eye on support at 4096–4080, with deeper support near 4050. As long as these levels hold, the overall bullish structure remains intact.
Once the selling pressure around 4150 eases, the next upside targets come in at 4185–4221, with immediate support shifting to 4166–4150.
In the near term, trading around these key levels is recommended.
One more point to note: the gap near 4090 from the previous drop has been filled, but yesterday a new gap formed at 4006–4009. This could become a psychological reference point if the U.S. government shutdown ends and the delayed economic data turns out unexpectedly bearish, or if geopolitical tensions ease and safe-haven demand declines.

XAUUSD IDEA FOR 10TH OCT, 2025. (2H)Here we go again, I'm back at trading the XAU against the USD. It's been a hell of a ride this year, but it is what it is. The Pair is bullish due to sentiment and because Gold is known as a safe-haven asset, and currently, investors are long on the pair because of the weak USD
As we can see, the pair is resuming back on its overall trend from a previous retracement, so what's next?
Note: This is a very volatile pair and often filled with manipulations ensure to risk what you can afford to lose.
As usual, my calls or analysis are based on what I see, the current Bias, and from a probability standpoint, meaning that this projection may be or may not be validated, so tread carefully. This is not financial advice; trade responsibly.

GOLD: Buy on pullbacksFrom the 4-hour chart perspective, attention should currently be paid to the short-term resistance zone around 4115-4123 above, with key focus on the critical resistance level around 4145. In the short term, watch the support zone around 4060-4068, and pay key attention to the previous low support zone around 4030-4035.
For trading operations, I still recommend prioritizing buying on pullbacks. At mid-range levels, it’s advisable to mostly observe and refrain from action, be cautious of chasing trades, and patiently wait for key levels to enter positions.
Buy 4070 - 4080
SL 4030
TP 4100 - 4110 - 4120
Sell 4120 - 4110
SL 4130
TP 4090 - 4080 - 4070

Gold Breaks above $4050, what is next? Gold prices continued to edge higher on Monday amid growing market speculation that the Federal Reserve may cut interest rates in December. Despite earlier comments from several Fed officials suggesting no rate cuts this year, the probability of a December cut has strengthened. This renewed optimism has once again boosted gold’s appeal as a safe-haven asset.
However, in my view, the recent price rise isn’t solely driven by expectations of rate cuts. There are several broader macroeconomic and geopolitical factors contributing to gold’s bullish momentum.
Following the recent meeting between Donald Trump and Xi Jinping, markets were initially hopeful that a significant trade breakthrough would ease tensions between the U.S. and China. Investors expected that China might resume exports of rare minerals and critical raw materials, which are essential for semiconductor production.
While China has indeed decided to extend the export suspension of certain materials—particularly gallium and antimony—until 2026, the uncertainty beyond that timeframe has created further anxiety in global markets. This uncertainty, combined with expectations of slower global economic growth into 2026, is strengthening demand for gold as a long-term hedge.
In addition, major central banks such as China, Russia, and Turkey have been steadily increasing their gold reserves. This accumulation provides additional support for gold prices, as these institutions are likely to continue buying on dips to diversify away from dollar exposure. Fundamentally, the overall outlook remains strongly bullish for gold.
From October 20 to October 28, gold experienced a short-term pullback. Despite that correction, price action consistently respected the key support zone near $3,990–$4,000, never forming a stable close below it. The market repeatedly failed to break below that base, showing buyers’ strength.
On the upside, the immediate resistance zone around $4,030–$4,050 had held firm for several sessions. However, during today’s early trading session, gold successfully broke above this resistance, establishing stability above the breakout level.
Currently, the next short-term target lies near the $4,130–$4,150 range. If the daily candle closes bullishly, even a minor correction could be followed by another leg upward toward that zone.
Given that $4,150 represents a strong resistance area, a brief pullback is possible once price reaches it. But if gold can sustain a stable close above $4,150, the next psychological target would be around $4,200–$4,230, with a potential final upside target near $4,280–$4,300.
Support & Risk Levels
Immediate Support: $4,050
Next Strong Support: $3,970 – $4,000
Major Support (Invalidation Zone): $3,880 – $3,900
As long as gold holds above the $3,880–$3,900 range, a major downtrend remains unlikely. Buyers continue to defend lower levels aggressively, and momentum remains positive both fundamentally and technically.
Gold remains underpinned by a mix of fundamental optimism (potential Fed rate cuts, central-bank buying, geopolitical uncertainty) and technical strength above its breakout levels. A sustained move above $4,150 could open the path toward $4,300, while a break below $3,970 might trigger a temporary correction.

Gold Rises Above $4,000 per OunceThe precious metal has begun to accumulate a two-day bullish streak in the short term, posting a gain of more than 2.8% as a new buying bias gains traction in the market. For now, the Federal Reserve’s probability chart once again shows a high likelihood of an additional rate cut at the central bank’s December meeting, which has partially limited the growth in U.S. Treasury yields—considered the primary alternative safe-haven asset to gold. Since bond yields have not continued to rise steadily, gold has managed to recover ground in the short term. If this dynamic persists, buying pressure could become increasingly relevant in the metal’s movements over the coming sessions.
Attempting to Regain the Uptrend
Since the last days of August, gold had maintained a steady upward trend, which was recently interrupted, leading to a period of sideways consolidation. However, the current buying pressure could push the price to hold above the psychological level of $4,000 per ounce. If the price manages to remain in this zone and advance again toward its historical highs, it could reactivate the upward trendline that had fallen into the background in recent weeks.
RSI
The RSI indicator line has begun to move away from the neutral level of 50, indicating that the average momentum of the past 14 sessions has turned bullish in the short term. As the RSI continues to move further away from the neutral zone, buying pressure could strengthen, supporting greater bullish momentum in the coming sessions.
MACD
The MACD histogram has started to show a steady positive slope, allowing the indicator to cross above the neutral zero line in the short term. If the histogram remains above this level, it could reinforce the bullish bias in the short-term moving averages, supporting a more consistent upward momentum in the gold market.
Key Levels to Watch:
$4,300 – Historical High Zone: This level represents the most important bullish barrier on the chart. Price movements reaching this area again could reactivate a strong upward trend in the coming sessions.
$4,100 – Nearby Resistance: This level coincides with a technical neutrality zone observed in recent weeks. It could act as a temporary barrier, potentially triggering short-term pullbacks if buying pressure fails to fully stabilize.
$3,900 – Key Support: This level aligns with the 50-period simple moving average. A break below this point could invalidate the current bullish structure and pave the way for a more dominant bearish bias in the short term.
Written by Julian Pineda, CFA, CMT – Market Analyst

gold await breakout before buying or selling#XAUUSD price still bullish, but if the gap above 4110-4098 gets rejected then short bearish retrace is expected.
Sell at 4098 on 2 times breakout, target 4054, stop loss 4110.
Above 4103-4110 holds bullish continuation if the first breakout covers above there and H1 closure above the price.

XAUUSD Could Be Bullish If It Stabilizes at This LevelGold surged to its highest level in more than two weeks as traders recalibrated expectations for a Fed rate cut in December, following weak US jobs data and worsening consumer sentiment.
The precious metal's gains came despite progress in ending the US government shutdown, as signs of an economic slowdown continued to boost demand for safe-haven assets.
- Sell Setup (Short position): A sell position is valid below 4102, targeting 4056 / 4025 / 4004.
- Buy Setup (Long position): A buy position is valid above 4102, targeting 4155 / 4189.
📌 Key Points
Gold remains bearish below 4102, with potential for a decline towards 4056–4025 after a possible correction to 4090–4102.
Only a confirmed 1-hour or 4-hour close above 4102 would shift the bias to bullish continuation, targeting 4155–4189 next.

StevenTrading – XAUUSD continues to follow the bullish scenario⚡️ StevenTrading – XAUUSD continues to follow the bullish scenario
Hello Trader
📰 Fundamental Analysis
Gold prices opened higher in Europe as concerns about the U.S. economic health boosted safe-haven demand.
The Senate reached a temporary agreement to end the government shutdown, reducing systemic risk but not eliminating defensive cash flows.
→ This week's bias remains upward, prioritizing trades in line with the main trend.
📊 Technical
Breakout confirmed: the 4.035 zone has been clearly broken, prices closed above and are forming a retest of the 4.035–4.045 box.
The H4 uptrend line holds firm, acting as a “support base” for the continuation scenario.
Key areas:
Support: 4.035–4.045 (retest box), 4.006–4.010 (secondary support along the trendline).
Resistance: 4.077–4.100 (near supply), 4.150 (resistance/candlestick & psychological), 4.225–4.292 (higher resistance).
🎯 Trading Scenario (for reference)
🟢 Buy with the trend – prioritize when retest holds firm
Entry: 4.043–4.045
SL: 4.039
TP: 4.077 → 4.100 → 4.150 → 4.225
Logic: Pullback to the 4.035–4.045 box + holding above the trendline ⇒ continuation to upper supply zones.
Customization: if the market retests deeply to 4.035–4.038, only consider entry when M30 shows a clear rejection signal (pin bar/engulf) and volume supports.
🔴 Reactive sell – only short scalp at resistance
Zone: 4.150
SL: 4.156
TP: 4.125 → 4.100
Note: Only enter with clear rejection on M15–M30; do not hold overnight when the major trend still supports an increase.
⚠️ Risk & Invalidation
Invalidation of buy setup: H4 candle closes below 4.035 (losing retest box); especially below 4.006 (breaking secondary support/trendline) ⇒ pause long, wait for new structure.
Invalidation of sell scalp setup: H4 closes above 4.156/holds 4.150 ⇒ stop selling, wait for pullback to buy.
Risk management: ≤ 1%/trade; enter/exit according to plan, do not chase prices within the zone.
—
This article reflects the personal views of StevenTrading. If you find it useful, please Like & Comment so I can update the plan daily.
