Elliott Wave Analysis – XAUUSD (October 27, 2025)Elliott Wave Analysis – XAUUSD (October 27, 2025)
🔹 Momentum
• D1 Timeframe:
D1 momentum remains clustered, suggesting that a bullish reversal could occur at any time. However, since momentum has not yet separated clearly, short-term downside pressure still exists.
• H4 Timeframe:
H4 momentum is currently declining, meaning that the downtrend could continue. We need to wait for H4 momentum to reach the oversold area and observe the market’s reaction there to determine whether the current drop is complete.
• H1 Timeframe:
H1 momentum is rising slightly, indicating the potential for a short-term rebound. However, since H4 is still in a down phase, any upward movement could face resistance near the 4098 level.
________________________________________
🔹 Wave Structure
• D1 Timeframe:
Price is currently moving sideways while D1 momentum remains stuck together, signaling a possible upcoming 5-day rally once D1 momentum turns upward into the overbought zone.
o If price fails to break above wave (3) yellow, this move is likely a wave (4) yellow correction.
o Conversely, if price breaks above wave (3) yellow, the current correction may only be a minor wave within wave (3) yellow.
________________________________________
🔹 Two Main Scenarios
1️⃣ Bullish Scenario (WXY blue completed):
If the WXY blue corrective structure has finished, the market may start a new wave (5) purple uptrend.
In this case:
• As H4 momentum moves into the oversold area, price should not fall deeply toward 4004.
• A sharp and decisive rebound from that zone would confirm this bullish scenario.
2️⃣ Bearish Scenario (Correction still in progress):
If the correction is not yet complete, the H4 decline could continue:
• Price might break below 4004, or at least retest it.
• If that happens, the downtrend could extend toward 3953 or 3927.
________________________________________
🔹 H1 Structure – Triangle Formation
On the H1 chart, price is consolidating within a contracting triangle, suggesting sideways accumulation with two possible interpretations:
• Scenario 1:
The triangle represents wave X of the WXY black structure.
When H4 momentum reaches the oversold zone and price holds above 4004, we may see an impulsive breakout toward the previous high at 4381, completing a flat correction of wave (4) yellow (D1).
• Scenario 2:
The triangle is wave (4) of wave Y blue, meaning that once completed, price could decline further toward 3953 or 3927 to finish wave Y. After that, a more stable upward wave is expected.
________________________________________
🔹 Trading Plan
Currently, price remains inside the triangle pattern:
• For experienced traders:
Wait for a breakout of either side of the triangle for direct entry.
• For more conservative traders:
Wait for Buy opportunities near strong support below.
🎯 Buy Zone: 3930 – 3927
🛑 Stop Loss: 3917
🎯 TP1: 4004
👉 If price breaks above 4149, we can look for Buy entries upon breakout, expecting an extended upward move toward 4268 or higher.
Xauusdanalysis

GOLD Finally Bearish , Short Setup Valid To Get 300 Pips !Here is My 30 Mins Gold Chart , and here is my opinion , we finally Below 4050.00 With 4H Candle And this never happened for a long time ! and we have a 4H Candle closure below it And Perfect Breakout and this give us a very good confirmation , so we have a good confirmation now to can sell after the price go back to retest the broken area 4050.00 , and give us a good wicks as previous wicks ! and we can targeting 100 to 200 pips . if we have a daily closure above this area this mean this idea will not be valid anymore .
Reasons To Enter :
1- Perfect Touch For The Area .
2- Clear Bearish Price Action .
3- Bigger T.F Giving Good Bearish P.A .
4- Over Bought .
5- Perfect 30 Mins Closure .

Today's gold trading strategyThe contradiction between supply and demand has set the price floor.
The gold market is currently facing a dual situation of "tight supply and strong demand". On the supply side, the global underground reserves of gold are only 20%, and the output of mined gold in 2025 can only maintain a slow growth of 3,000 tons. Moreover, new mines need 5-7 years to come into production, and there is simply no possibility of a significant increase in supply in the short term. The marginal production cost has risen to $1,500 per ounce, providing a strong support for the gold price. On the demand side, not only are global central banks buying gold in a frenzy, but the gold purchase volume is expected to exceed 10,000 tons in 2025. The private investment demand in Asian markets such as China and India is also surging. In 2024, the consumption of gold bars and coins in China increased by 46.02%. This supply-demand gap is difficult to fill in the short term and will inevitably push the gold price to rise.
Today's gold trading strategy
xauusd @ buy4050-4060
TP:4080-4100-4150
SL:4030

XAU/USD – Downtrend Holds as Gold Tests the Lower Channel🔍 Market Context
Gold remains under pressure after failing to reclaim the 4,060 breakout zone.
Recent attempts to recover have been absorbed by sellers, confirming short-term weakness and the continuation of the downward structure.
The market appears to be in a redistribution phase, as traders await clarity from upcoming macro data.
📊 Technical Analysis
Structure: Clear bearish channel with lower highs forming below the broken trendline.
Key resistance: 4,058–4,060 (previous breakout support now acting as supply).
Support zones:
• 4,004–4,000 → short-term liquidity area.
• 3,928–3,930 → deeper liquidity pocket + Fibo reaction zone.
Bias: Downtrend remains intact unless price reclaims and holds above 4,070–4,080.
🎯 Short-Term Outlook
If gold continues to reject from the 4,050–4,060 area,
a further move toward 4,000 and possibly 3,928 is likely.
Conversely, a clean reclaim above 4,080 could invalidate the current bearish pressure and trigger a short-term recovery.
⚜️ Summary
Gold is not collapsing — it’s resetting structure after an extended rally.
The focus remains on how liquidity behaves near 4,000.
If that zone breaks, expect momentum to accelerate toward 3,928 before buyers step back in.
📌 MMFLOW TRADING Insight:
“Follow the structure, not the emotion — liquidity always tells the truth.”

Gold Bearish Rejection from Supply Zone (OB + FVG Confluence)Key Observations and SMC Components:
Market Structure Shift (MSS): The label "MSS" suggests that the previous bullish market structure has been broken to the downside, indicating a potential shift to a bearish trend.
Order Block (OB): A bearish Order Block is identified (labeled "OB"), which is typically the last up-close candle before the strong move down. This zone is a high-probability area where institutional selling pressure is expected to resume.
H1 FVG (Hourly Fair Value Gap): Within the Order Block, an H1 FVG (or Inefficiency) is identified. This is an area where price moved strongly without overlapping all three candles, leaving a gap. Fair Value Gaps are often used as targets for price to retrace and "fill" before continuing the dominant move.
CRT-L and CRT-H:
CRT-L (Current Range Top/High) marks the top of the range before the sharp drop.
CRT-H (Current Range Low/Bottom) marks the low point of the current swing leg.
Projected Move: The large green arrow and the curved line indicate the anticipated price action: a retracement (pullback) upwards into the H1 FVG and the OB zone, followed by a rejection and a continuation of the downward move towards and potentially below the CRT-H low.
Current Price Action: The price is currently at the very bottom of the sharp drop, hovering around $4,041.48. The dotted line and arrow show the expectation of a rally into the shaded resistance zone.
Trading Bias and Expectation
The overall bias is bearish. The analyst expects price to:
Rally (short-term bullish retracement): Move up to the area between approximately $4,065 and $4,080 (the OB and H1 FVG zone).
Reject and Trend (long-term bearish continuation): Find strong resistance in the OB/FVG zone, and then reverse to continue the downtrend, aiming to break the CRT-H low.

GOLD (XAU/USD): THE FED & THE FINAL DIP – GET READY TO SHORT!1. MACRO OVERVIEW SUMMARY
Headwinds (Short-term): The agreed-upon US-China trade framework reduces tariff fears, putting near-term selling pressure on Gold.
Tailwinds (Mid-term): Weak CPI data (3% inflation) solidifies expectations for Fed rate cuts (weakening the USD) + Escalating Russia-Ukraine Tensions.
The Decisive Event: The FOMC decision on Wednesday will serve as the ultimate compass for Gold's next major move.
2. TECHNICAL ANALYSIS: STRUCTURE & TARGETS
Current Structure: Following the strong bullish impulse, Gold is in a major corrective phase. The recent price structure was broken, confirming that the short-term trend has shifted to bearish.
Anticipated Scenario: Gold has likely completed its retracement and is expected to execute the final drop to conclude the correction process before a potential reversal.
The Magnet (Target): The critical Value Gap on the daily timeframe (around $3,880 – $3,920) is the ultimate destination this final move is likely heading for.
WAITING FOR ENTRY: Gold is anticipated to rally slightly to retest the recently broken structure area before continuing its descent.
3. TRADING STRATEGY (BEARISH BIAS)
We favor a SHORT position, aligning with the final corrective down-move:
Ideal Entry Zone: $4,080 – $4,100 (Retest of the broken structure).
Take Profit (TP1): $3,970 (Nearest Demand/Support Zone).
Take Profit (TP2): $3,880 (Final Target at the major Daily Value Gap).
Stop Loss (SL): $4,135 (Above the key Supply Zone).
Crucial Note: Maintain strict risk management ahead of Wednesday's FOMC. This short move could finalize the major correction!
Where do you think this final drop will end? Comment below!
#Gold #XAUUSD #FOMC #Trading #TradePlan

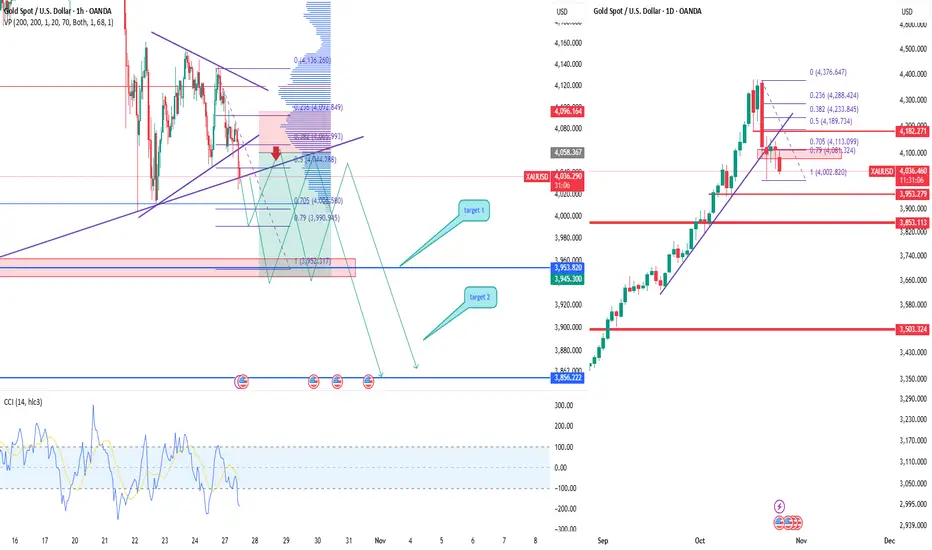
XAUUSD Gold testing support, correction possibleAfter a strong rally, gold entered a correction phase. Price broke the ascending channel and now trades around 4030–4050. The chart structure suggests a potential retest near 4070–4090 before continuation to 3960 (Target 1) and 3856 (Target 2).
CCI confirms weak buying momentum and volume profile shows high liquidity zones above current price — favoring a pullback.
Investors are taking profits after gold’s rally amid softer Fed outlook and possible dollar rebound. While long-term fundamentals stay bullish, short-term correction looks likely.
Sell setup from 4070–4090 zone with targets 3960 and 3856, stop 4110.
Valid while price remains below 4110.
XAUUSD 4H Short Setup: Selling the FVG RetraceKey Observations:
Recent Structure: The price has experienced a strong move down (impulse leg) followed by a small retracement and then further downside movement. The overall momentum is currently bearish.
Fair Value Gap FVG: The key focus is the Fair Value Gap FVG, marked by the blue/gray box. This is an area of price inefficiency left behind during the strong bearish move. It typically acts as a target for price to retrace to before the dominant trend continues.
Setup Rationale: The analysis suggests the current price movement (around 4,064.9 will see a retracement higher (green arrow up) to fill the FVG and potentially touch the liquidity zone marked by the red box (often representing an optimal entry or order block within the FVG.
Trade Projection: After reaching this inefficiency zone ($\sim\text{4,085}$ to $\sim\text{4,105}$), the projection is for a strong bearish continuation (green arrow down), aiming for the downside target in the green shaded area 4,045.
Conclusion:This setup anticipates a bounce into resistance FVG zone before a continuation of the selling pressure. The core strategy is selling a retracement in a short-term bearish market.

XAU/USD 27 October 2025 Intraday AnalysisH4 Analysis:
-> Swing: Bullish.
-> Internal: Bullish.
Analysis and bias remains the same as analysis dated 20 October 2025.
Price has printed as per previous intraday expectation by printing a bearish CHoCH which indicates, but not confirms, bullish pullback phase initiation.
Price is currently trading within an established internal range, however, I will continue to monitor price with regards to depth of pullback.
Intraday expectation:
Price to continue bearish, react at either discount of 50% internal EQ, or H4 supply zone before targeting weak internal high priced at 4,380. 990.
Note:
The Federal Reserve’s sustained dovish stance, coupled with ongoing geopolitical uncertainties, is likely to prolong heightened volatility in the gold market. Given this elevated risk environment, traders should exercise caution and recalibrate risk management strategies to navigate potential price fluctuations effectively.
Additionally, gold pricing remains sensitive to broader macroeconomic developments, including policy decisions under President Trump. Shifts in geopolitical strategy and economic directives could further amplify uncertainty, contributing to market repricing dynamics.
H4 Chart:
M15 Analysis:
-> Swing: Bullish.
-> Internal: Bearish.
Analysis and bias remains the same as yesterday's analysis dated 22 October 2025.
Price has printed according to my analysis dated 20 October 2025 where I mention that price is to continue bullish, react at either premium of 50% internal EQ, or M15 demand zone, before targeting weak internal low priced at 4,185.910.
Price has printed a bearish iBOS and subsequently a bullish CHoCH to indicate, but not confirm bullish pullback phase initiation.
Price is now trading within an established internal range.
Intraday expectation:
Price to react at either premium of 50% internal EQ, or M15 demand zone, before targeting weak internal low priced at 4,004.280.
Note:
Gold remains highly volatile amid the Federal Reserve's continued dovish stance, persistent and escalating geopolitical uncertainties. Traders should implement robust risk management strategies and remain vigilant, as price swings may become more pronounced in this elevated volatility environment.
Additionally, President Trump’s tariff announcements, particularly against China, are expected to further amplify market turbulence, potentially triggering sharp price fluctuations and whipsaws.
M15 Chart:

GOLD HIGH PROBABILITY SETUPS SOON!!!🚨 XAUUSD HIGH PROBABILITY BUY SETUP 🚨
* Here We Can See Clearly The Next Potential Moves For GOLD Coming Hours/Days.
* Keep Your Eyes Close On Your Trading Positions.
* Happy PIP Hunting Traders.
FXKILLA.

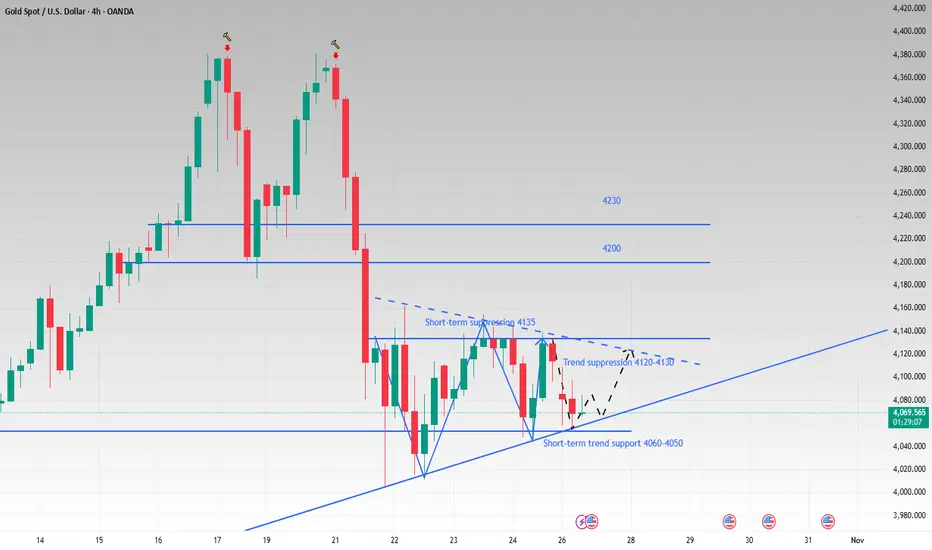
The triangle pattern breaks and looks at the directionLast week we repeatedly emphasized the importance of paying attention to the rising trend line of the 4H cycle. Until the price falls below this trend line, we will maintain our bullish stance. Although news of easing trade tensions between China and the United States over the weekend has brought a slight cooling to the market's tense mood, this has only temporarily suspended the bullish counterattack. Whether a real and effective consensus can be reached still requires attention to the APEC summit at the end of the month.
At the same time, the Federal Reserve's interest rate cut this week is almost a foregone conclusion, which has provided some support for the rise in gold prices. This has also contributed to the current relatively flat trend in gold prices, without as much fluctuation as last week. In addition to the rising trend line that we have been paying attention to, there is also a small downward trend line in the 4H chart, which makes the current trend fall into a triangle consolidation range.
The short-term support below is 4060-4050, and the trend suppression above is 4120-4130. Before the triangle pattern breaks to determine the future trading direction, we can sell high and buy low around this range.
The current hourly moving average is arranged downward, and it is expected to test the lower support again. If it falls back to the lower support and does not break, we can consider going long on gold.
[XAUUSD] New Week Scenario: Accumulation Awaiting Drop New Week Scenario: Accumulation Awaiting Drop - Watch for Selling at Liquidity Zone $4195
Hello traders community,
The new week begins with XAUUSD (Gold) being "restrained" in a sideways structure. However, don't let this calm deceive you. Technically, this is an accumulation pattern with a clear bearish bias.
The market is in "wait mode," and patience will be the key to catching the next big wave.
📰 MACRO ANALYSIS: TUG OF WAR AHEAD OF FOMC
The market is caught between two opposing streams of information:
Bearish Pressure: Positive signs of a US-China trade deal are reducing the safe-haven demand, putting pressure on Gold prices.
Bullish Support: The weakening USD due to expectations that the Fed will continue to cut interest rates inadvertently provides some short-term support for the precious metal.
Decisive Factor: Traders are "holding their positions" to await the two-day monetary policy meeting (FOMC) this week. This will be the main event, determining the medium-term trend of the USD and Gold.
📊 TECHNICAL ANALYSIS: CONTINUATION OF BEARISH STRUCTURE
The H1 chart shows a very clear "Sell" scenario:
Price Structure: After a strong drop from the peak, the price is moving sideways, accumulating in a bearish pennant/flag pattern. This is a continuation structure, indicating that the Sellers are "resting" before pushing the price further down.
Ideal Sell Zone: The $4195 zone is an extremely strong confluence resistance area, marked as "Liquidity strong" on the chart.
This is precisely the 0.5 Fibonacci level, the "golden" retracement point of the entire previous decline.
This is an old support level that has now become new resistance.
Optimal Scenario: We will wait for the price to pull back to test the $4195 liquidity zone. This is an opportunity for Sellers to enter the market with low risk and high profit potential.
🎯 TRADING PLAN (SELL SETUP)
Absolute priority is to Watch for Selling (Sell) in line with the main trend.
ENTRY (Sell): $4195
STOP LOSS: $4205
TAKE PROFIT: TP1: $4168-TP2: $4145-TP3: $4122-TP4: $4102
SUMMARY
In the context of the market awaiting FOMC news, Gold is likely to make one final "pullback" to the $4195 area before continuing its downward trend. Be patient and wait for signals at this ideal sell zone.
Wishing traders a successful and disciplined new trading week!

XAUUSD – Gold Trapped in Uncertainty Before the FOMC Market Overview:
Gold remains range-bound as US–China trade optimism tempers safe-haven demand, while expectations for further Fed rate cuts continue to weigh on the USD and cushion downside pressure.
The market is hesitant ahead of the two-day FOMC meeting this week, as traders await clear policy guidance before taking larger directional bets.
In short — macro tone is mixed:
Trade headlines reduce fear.
Fed expectations support gold.
Yet the chart shows indecision — a compression phase before expansion.
Technical Outlook (H1)
On the chart, gold continues to oscillate inside a tightening triangle, holding above the 4,050–4,060 Support Trendline (OBS BUY ZONE).
The liquidity structure shows buy-side absorption near the lows, while sellers remain active around the 4,186–4,260 resistance zones.
If gold maintains stability above 4,050, buyers may attempt to push toward the 4,107 neckline, and possibly test 4,186, before meeting the next supply layer at 4,260.
Conversely, a failure to hold support could expose the 4,002 and 3,930 liquidity pools below.
Key Technical Zones:
Support Trendline / OBS BUY ZONE: 4,058 – 4,050
Neckline / Local Resistance: 4,107 – 4,110
Reaction Zone (Fibo / Supply): 4,186 – 4,260
Deeper Liquidity Zone: 4,002 – 3,930
MMFLOW View – Plan for the Session
At this stage, the market is in accumulation mode.
As long as price stays above 4,050, MMFLOW maintains a neutral-to-bullish bias, focusing on how price reacts near the neckline at 4,107.
The ideal scenario would be:
A short-term pullback to absorb liquidity near 4,050,
Followed by a push toward 4,186,
Then a possible correction before the FOMC outcome.
However, if sellers manage to reclaim 4,050, a drop into 4,002 or even 3,930 could mark the next deep liquidity grab — setting up the base for a larger rally later.
Summary:
Gold remains stuck between macro hesitation and structural compression.
Liquidity is building on both sides — and the breakout direction will likely align with post-FOMC volatility.
🟡 Bias: Neutral-to-Bullish above 4,050.
Watch how the market defends 4,058 and reacts at 4,107–4,186.
📊 What’s your take — will FOMC give gold a reason to break free, or keep it trapped another week?
👉 Follow MMFLOW TRADING for daily structure breakdowns & institutional flow insights.
🟣 Chart: XAUUSD H1 – Smart Money Flow structure showing liquidity sweep, compression triangle, and Fibo confluence zones before the FOMC decision.

Gold (XAUUSD) – 27 Oct | Watching Key Supply Zones🟡 Gold (XAUUSD) Analysis – 27 October
Hello Disciplined Traders,
Welcome to the Chart Is Mirror Community 👋
Market Context
• Gold continues to range within the 4004.6–4161.8 price range for the last four trading sessions.
• As per the M15 internal structure , after a CHoCH downside , price pulled back to the 4131.5–4144.9 supply zone last Friday, respected the zone, and resumed its downtrend.
• The Asia session also continued in line with the bearish momentum.
Key Observations
• Market is currently in a minor pullback toward the 4089–4098 POI zone for a potential short setup.
• Overall bias remains bearish while the M15 structure stays intact.
Execution Plan
• If the 4089–4098 zone is respected with LTF confirmation , plan for short setups accordingly.
• If invalidated and price breaks above, the next selling zone remains 4131.5–4144.9 supply zone .
Stillness is strength — let the structure confirm your trade.
📘 Shared by @ChartIsMirror

Today's gold trading strategyTwo types of short-term signals, focusing on immediate verification
Fed's short-term "dovish signals" catalyze: In the latest remarks by Fed officials, three voting members explicitly stated that "no interest rate hike is needed in November, and we need to observe the cooling trend of employment data", and the CME Fed observation tool shows that the probability of an interest rate hike in November has dropped from 25% to 12%. Historical data shows that in the 3-5 trading days after the cooling of the interest rate expectation, gold typically rises by 1.2%-1.8%, and the US dollar index is under short-term pressure (currently the US dollar index is 94.2, and if it falls below 94, it will further open up the upward space for gold);
Geopolitical conflict "immediate safe-haven impulse": The situation in the Middle East suddenly escalated, Israel launched a ground attack on the Gaza Strip, and the Houthi forces announced "expanding the attack range on Red Sea shipping", the spot price of London gold jumped by 12 US dollars on the same day, and safe-haven funds flowed into gold ETFs (such as SPDR) for 280 million US dollars in a single day. Although the demand for safe-haven protection from such sudden geopolitical events is not long-lasting, it will form a short-term upward momentum of 3-5 trading days;
Today's gold trading strategy
xauusd @ buy4050-4060
TP:4080-4100-4150
SL:4030

Plan |Gold Gradually Accumulating, Preparing for an Upward Wave?🔍 Market Context
After reaching the historical peak ATH GOLD 4,371 USD , gold underwent a deep correction, breaking the short-term bullish structure (BoS) and retesting the OB Bearish zone above .
However, since the price returned to the 4,040 – 4,060 USD area, the market has shown clear signs of liquidity absorption ($$$) and maintained an internal upward trendline, indicating that buying momentum is returning.
The current structure suggests gold is in a re-accumulation phase before forming a medium-term recovery wave towards the 4,185 → 4,243 USD zone.
Buyers hold the advantage as long as the price does not break the main support trendline.
💎 Key Technical Structure
Support Zone: 4,040 – 4,060 USD → a strong support zone confluencing with the trendline, where institutional buying previously appeared.
Support Trendline: connecting the series of higher lows from 15/10 → short-term trend remains bullish.
Liquidity Zone $$$: 4,060 – 4,080 → supply absorption zone, confirming its role as a “price base”.
Resistance Zone: 4,149 – 4,185 → the first resistance zone to break to confirm the recovery momentum.
Target FVG / Supply Zone: 4,243 – 4,250 → potential profit-taking area or reversal consideration point.
Current structure:
→ Short-term: bullish corrective move.
→ Medium-term: potential for forming an extended recovery wave if holding above 4,040 USD.
📈 Trading Scenarios
1️⃣ BUY Setup – Retest Trendline / Liquidity Zone 4,060 USD
Entry: 4,060 – 4,070
SL: 4,035
TP1: 4,149
TP2: 4,185
TP3: 4,243
✅ Condition:
Price hits the trendline or liquidity zone 4,060 and shows a bullish reversal signal (rejection / bullish engulfing).
➡️ This is a high-probability setup, confluencing trendline structure + liquidity zone support, often where large buyers re-enter the market.
2️⃣ BUY Setup – Break & Retest resistance zone 4,149 USD
Entry: 4,149 – 4,155
SL: 4,130
TP1: 4,185
TP2: 4,243
✅ Condition:
Wait for the price to break the 4,149 resistance zone with strong volume, then lightly retest without closing below 4,130.
➡️ Trend-following setup – confirms the return of buying momentum and extends the target to the FVG zone 4,243 USD.
3️⃣ SELL Setup (Scalp reaction) – FVG 4,243 USD
Entry: 4,240 – 4,245
SL: 4,255
TP: 4,185 → 4,150
✅ Condition:
Only execute if there is a strong reaction at FVG 4,243 without a continuation break signal.
➡️ Short-term technical sell – leveraging the supply zone reaction, not holding the position long.
⚠️ Risk Management
Prioritize trading in the buy direction, avoid selling against the main trend.
If H2 closes below 4,035 → bullish scenario invalidated, wait for a new structure.
Do not FOMO buy in the mid-range (4,090–4,130).
Keep moderate volume, move SL to breakeven when price surpasses 4,149.
💬 Conclusion
Gold is in a gradually ascending accumulation phase after a strong decline.
As long as the price holds the trendline and support zone 4,040 – 4,060 USD, gold is likely to rebound following the liquidity + breakout retest model, with the main target being 4,185 → 4,243 USD .
If it breaks through 4,243 USD, the market could trigger a stronger rally towards 4,300 – 4,340 USD .
👉 Reasonable Strategy:
Buy 4,060–4,070 → TP 4,185 / 4,243 USD
Add Buy when breaking 4,149 USD with volume confirmation.
Technical Sell 4,243 USD if there is no signal to break higher.
🔥 “As long as 4,040 holds, gold remains in accumulation — patience will pay.”
⏰ Timeframe: 2H
📅 Update: 27/10/2025
✍️ Analysis by: Captain Vincent

Gold Price Outlook – Trade Setup (XAU/USD)📊 Technical Structure
OANDA:XAUUSD Gold (XAU/USD) is consolidating within a symmetrical triangle formation. The resistance zone lies between $4,104 – $4,113, while the support zone is marked at $4,050 – $4,055. The price has repeatedly tested both zones, suggesting market indecision. A breakout from this tightening structure could dictate the next directional move.
📌 Trade Setup
Entry: $4,061 (near trendline support)
Stop Loss: $4,050 (below support zone)
Take Profit: $4,113 (resistance)
Risk–Reward (R:R): ≈ 1 : 4.36
🌍 Macro Background
Renewed optimism surrounding US-China trade talks has reduced safe-haven demand, leading to gold’s decline near $4,065 earlier today. US Treasury Secretary Bessent confirmed that both sides reached a framework for discussion, with China expected to delay its rare earth policy by one year. At the same time, markets are nearly certain the Federal Reserve will deliver a 25 bps rate cut at the October FOMC meeting, with another cut possible in December. While trade optimism weighs on gold, rate-cut expectations continue to provide a safety net for the metal.
🔑 Key Technical Levels
Resistance: $4,104 / $4,113
Support: $4,055 / $4,061
Upside Target (if breakout): $4,130 – $4,150
📋 Trade Summary
Gold is trapped in a tightening triangle between $4,055 and $4,113. Traders may look for long entries on dips near $4,061 with targets at $4,113, aligning with Fed rate-cut expectations. However, renewed US-China optimism caps the upside. A decisive break below $4,050 would invalidate the bullish outlook and open the door toward $4,020.
⚠️ Disclaimer
This analysis is for reference only and does not constitute trading advice. Trading involves significant risk, and proper risk management is essential.

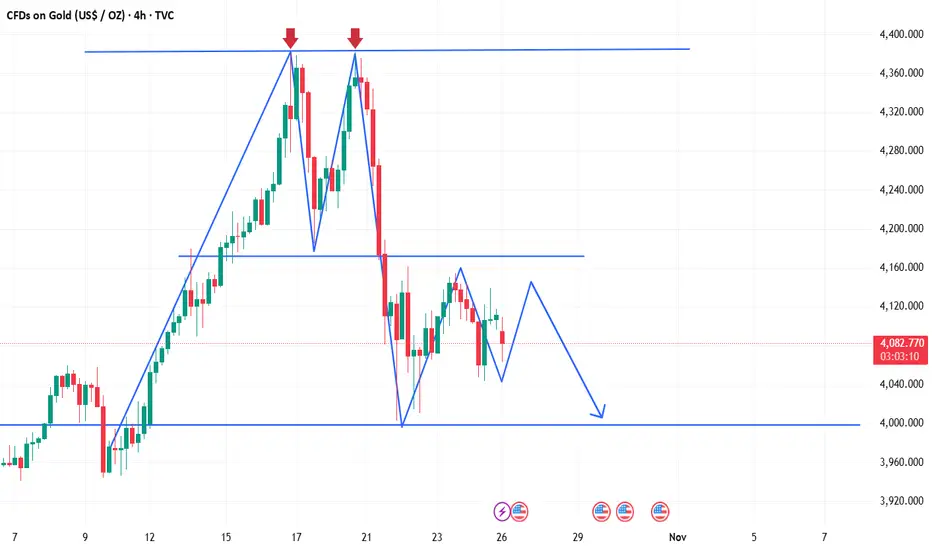
Gold analysis with trading ideasAfter nine consecutive weeks of strong gains, gold has entered a sharp correction phase. Driven by intense selling pressure, its nearly three-month winning streak has officially come to an end. However, given the persistently high levels of global geopolitical and economic uncertainty, the likelihood of a significant further decline in gold prices remains low, as safe-haven trading activity remains robust and dynamic. Currently, trade negotiations between the U.S. and China are still ongoing, while President Trump has announced the termination of all trade talks with Canada. Meanwhile, due to the U.S. Congress’ prolonged failure to pass an appropriations bill, the release of economic data continues to be disrupted, shifting traders’ focus back to central bank policies once again.
From a technical perspective, following the formation of a "double top" pattern on the 1-hour chart, gold has been oscillating under the resistance of the pattern’s neckline. Despite the bullish CPI data last Friday, gold bulls failed to push prices above the 4,160 level, indicating that short-term bullish momentum is still under significant pressure and gold is likely to remain in a wide-range consolidation. Looking at the 4-hour chart, after prices fell from the "double top" pattern, they rebounded with support from the acceleration line: the lower boundary of the range was reclaimed last Thursday, followed by a second bottoming-out and rebound on Friday—signaling that the short-term support at the lower boundary has been basically confirmed.
The key range currently lies between 4,060 and 4,170, and these two levels can be regarded as the dividing lines for short-term bullish and bearish trends. A break above 4,170 would suggest strengthened rebound momentum, potentially leading to a further test of the upper channel edge around the 4,300 area. Conversely, a break below 4,060 may trigger a continued decline toward the 4,000 support level—this forms the core framework for the current market movement.
Today’s trading strategy will revolve around the 4,000–4,170 range, prioritizing short positions at higher levels and long positions at lower levels. If prices break above 4,170, it will indicate that gold bulls have regained control, requiring a timely strategy adjustment to enter long positions on pullbacks.
XAU/USD | Gold Under Pressure, Support & Resistance to WatchGold continues to trade under pressure, holding below both the MA50 and MA200, keeping short-term momentum firmly tilted to the downside. Price is currently hovering just below the 4,095 support level, with the market remaining range-bound within a broader corrective structure.
Buyers will need a confirmed break above 4,137 to trigger a potential recovery toward 4,178 and 4,234.
On the downside, the 4,042–3,987 Support Zone serves as an intermediate area to monitor for short-term reactions. A failure to hold this zone could extend the decline toward the Deeper Support Zone, which remains a major reaction area where dip-buyers are expected to re-enter the market.
📌 Key levels to watch:
Resistance:
4095
4136
4178
4234
4285
Support:
4042
3987
3944
🔎 Fundamental focus:
Gold remains under pressure as traders weigh ongoing U.S. government shutdown risks and delayed economic data, which have limited visibility into the real state of the economy.
While short-term price action remains corrective, safe-haven demand and macro uncertainty are still expected to support gold on deeper dips toward key demand zones.

Gold is weak. Short-term short selling is recommended.Spot gold rebounded on Friday, paring intraday losses after weaker-than-expected US Consumer Price Index (CPI) data, closing above 4,100. However, it remained in a negative trend for the week, ending the previous nine-week winning streak. The weak inflation data reinforced market expectations of a 25 basis point interest rate cut by the Federal Reserve at its October 29-30 monetary policy meeting. Market sentiment improved on hopes of a easing of the Sino-US trade standoff. The White House confirmed on Thursday that US President Trump will meet with the President of Korea on the sidelines of the APEC summit in South Korea on October 30, a development that could help ease recent trade tensions.
Technically, gold is showing initial signs of consolidation after a strong rebound. The short-term outlook has turned bearish, as gold prices are currently trading below the 21-, 50-, and 100-period simple moving averages (SMAs) on the 4-hour chart, suggesting fading bullish momentum. From a wave perspective, the 4-hour chart shows an ABC corrective wave pattern, with 4380 as the starting point for wave A. Currently, gold is in the stage of confirming the high point of a wave B rebound, with a high probability of a subsequent wave C decline.
On the 1-hour chart, after forming a double top at 4380 this week and then retreating, the overall market is currently in a consolidation phase with a more bearish outlook. Resistance lies above 4160-4185, while support lies below 4004. Range-bound trading is expected next Monday. If there is risk-averse news over the weekend or if 4160 is broken directly, the weak trend can be reversed.

Gold (XAUUSD): The Mother of All Traps is Set!🥇 Gold (XAUUSD): The Mother of All Traps is Set! 🤯
Don't let the drop fool you! Gold is meticulously setting up a high-probability reversal. This isn't just a market correction; it's a calculated liquidity grab before the real explosion happens. Smart Money is loading up! 🧠💰
The Current Play: The Turtle Soup Hunt 🐢🥣
Price is dropping towards a critical reversal zone. This drop is designed to liquidate early buyers and trap breakout sellers. Our focus is the precise area where all confluences align:
Liquidity Magnet: The price needs to sweep the BSL (Buy Side Liquidity) around 4,011 and 3,998.
The Entry POI: The ultimate reversal point is the Potential Turtle Soup zone around 4,040.35 to 4,030.51. This is where sellers get trapped! 🪤
The Foundation: This zone is further validated by the CRTL (Candle Rotation Theory Low) and the prior SMT (Smart Money Technique) divergence. This is a fortress! 🏰
🚀 The Massive Rally Target
Once the low is swept and the trap is sprung, we expect an aggressive expansion:
First Target: Reclaim the recent high around 4,122.38 (CRTH + TS high).
Ultimate Target: Price will be magnetized towards the Bearish FVG 4H overhead (starting at 4,161.43). Filling that gap is the ultimate objective.
🔑 Key Trading Rules:
Patience is Profit: WAIT for the wick to pierce the 4,030 area.
Confirmation: Look for a low-timeframe (1m/5m) Market Structure Shift (MSS) after the sweep. That's your entry signal!
Risk Management: Stop-loss safely below the liquidity sweep.
Who's catching this massive XAUUSD reversal? Hit the like button if you're waiting for the sweep! 👇
Greetings,
MrYounity

XAUUSD 1D: Short Setup – Retracement to FVG Before DropKey Observations:
Market Structure Shift (MSS):
A recent large bearish candle (the red candle around October 20th) appears to have broken below a significant short-term low, which is often termed a Market Structure Shift (MSS) in institutional trading concepts. This indicates a potential change from bullish to bearish momentum.
Fair Value Gap (FVG): An unfilled price area (marked by the gray shaded box) has been identified as a FVG.
This zone often acts as a magnet where price is expected to return to "fill" the inefficiency before continuing its main direction.
Liquidity/Return Levels (CRT-L and CRT-H):The Current Range Top CRT-L marks the top of the price inefficiency or the potential area where price could reverse after filling the FVG.
The Current Range Low CRT-H marks the level where price has recently closed.Projected Move: The analysis suggests a short-term relief rally or retracement (dotted line) to move higher into the FVG area 4160$ to 4210$. Once the price moves into or near the FVG and potentially the CRT-L, the expectation is a strong bearish rejection (large green arrow) that would push the price back down, possibly towards or below the recent low CRT-H.
Conclusion:The dominant short-term bias is bearish, but a temporary bullish retracement is anticipated to fill the Fair Value Gap before the bearish continuation.

XAU/USD: Wave 5 is already starting or the bulls' last hope?XAU/USD: Wave 5 is already starting or the bulls' last hope?
📈 Weekly Scenarios
Bullish scenario: Price holds above ~$4,056-4,000, breaks through ~$4,267 → start of waves (5) up → target ~$4,380-4,455+.
Consolidation: Price moves between ~$4,000 and ~$4,267, forming a base before the next major move.
Bearish scenario: Break of support at ~$4,000 with volume confirmation → start of correction → target ~$3,820-3,943.
✅ Conclusion
On the weekly timeframe, gold is at a key milestone: either a strong profitable rally (wave 5) begins, or a correction reverses.
Main signals: holding above ~$4,000 and breaking through ~$4,267 is the way to the upside; a break below ~$4,000 is a signal for caution.
