Plan |Gold Gradually Accumulating, Preparing for an Upward Wave?🔍 Market Context
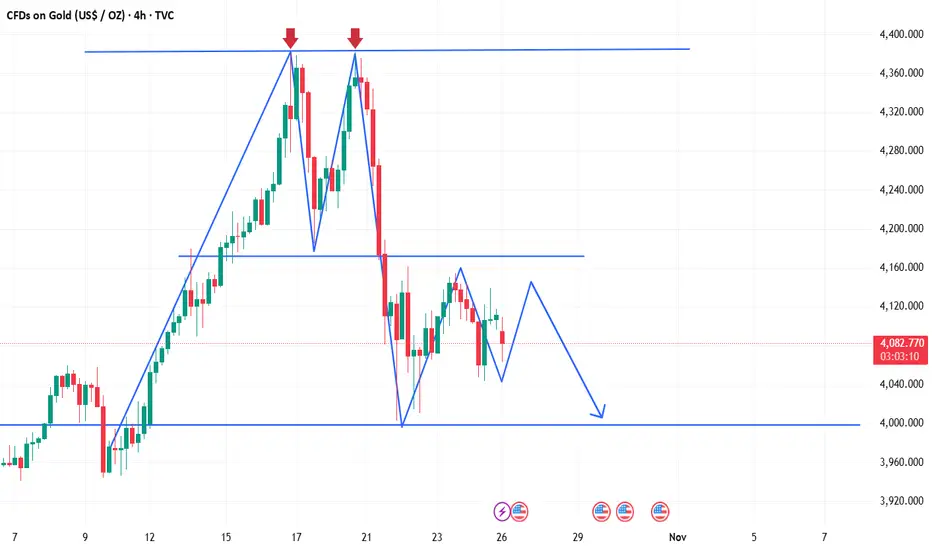
After reaching the historical peak ATH GOLD 4,371 USD , gold underwent a deep correction, breaking the short-term bullish structure (BoS) and retesting the OB Bearish zone above .
However, since the price returned to the 4,040 – 4,060 USD area, the market has shown clear signs of liquidity absorption ($$$) and maintained an internal upward trendline, indicating that buying momentum is returning.
The current structure suggests gold is in a re-accumulation phase before forming a medium-term recovery wave towards the 4,185 → 4,243 USD zone.
Buyers hold the advantage as long as the price does not break the main support trendline.
💎 Key Technical Structure
Support Zone: 4,040 – 4,060 USD → a strong support zone confluencing with the trendline, where institutional buying previously appeared.
Support Trendline: connecting the series of higher lows from 15/10 → short-term trend remains bullish.
Liquidity Zone $$$: 4,060 – 4,080 → supply absorption zone, confirming its role as a “price base”.
Resistance Zone: 4,149 – 4,185 → the first resistance zone to break to confirm the recovery momentum.
Target FVG / Supply Zone: 4,243 – 4,250 → potential profit-taking area or reversal consideration point.
Current structure:
→ Short-term: bullish corrective move.
→ Medium-term: potential for forming an extended recovery wave if holding above 4,040 USD.
📈 Trading Scenarios
1️⃣ BUY Setup – Retest Trendline / Liquidity Zone 4,060 USD
Entry: 4,060 – 4,070
SL: 4,035
TP1: 4,149
TP2: 4,185
TP3: 4,243
✅ Condition:
Price hits the trendline or liquidity zone 4,060 and shows a bullish reversal signal (rejection / bullish engulfing).
➡️ This is a high-probability setup, confluencing trendline structure + liquidity zone support, often where large buyers re-enter the market.
2️⃣ BUY Setup – Break & Retest resistance zone 4,149 USD
Entry: 4,149 – 4,155
SL: 4,130
TP1: 4,185
TP2: 4,243
✅ Condition:
Wait for the price to break the 4,149 resistance zone with strong volume, then lightly retest without closing below 4,130.
➡️ Trend-following setup – confirms the return of buying momentum and extends the target to the FVG zone 4,243 USD.
3️⃣ SELL Setup (Scalp reaction) – FVG 4,243 USD
Entry: 4,240 – 4,245
SL: 4,255
TP: 4,185 → 4,150
✅ Condition:
Only execute if there is a strong reaction at FVG 4,243 without a continuation break signal.
➡️ Short-term technical sell – leveraging the supply zone reaction, not holding the position long.
⚠️ Risk Management
Prioritize trading in the buy direction, avoid selling against the main trend.
If H2 closes below 4,035 → bullish scenario invalidated, wait for a new structure.
Do not FOMO buy in the mid-range (4,090–4,130).
Keep moderate volume, move SL to breakeven when price surpasses 4,149.
💬 Conclusion
Gold is in a gradually ascending accumulation phase after a strong decline.
As long as the price holds the trendline and support zone 4,040 – 4,060 USD, gold is likely to rebound following the liquidity + breakout retest model, with the main target being 4,185 → 4,243 USD .
If it breaks through 4,243 USD, the market could trigger a stronger rally towards 4,300 – 4,340 USD .
👉 Reasonable Strategy:
Buy 4,060–4,070 → TP 4,185 / 4,243 USD
Add Buy when breaking 4,149 USD with volume confirmation.
Technical Sell 4,243 USD if there is no signal to break higher.
🔥 “As long as 4,040 holds, gold remains in accumulation — patience will pay.”
⏰ Timeframe: 2H
📅 Update: 27/10/2025
✍️ Analysis by: Captain Vincent
Xauusdanalysis

Gold Price Outlook – Trade Setup (XAU/USD)📊 Technical Structure
OANDA:XAUUSD Gold (XAU/USD) is consolidating within a symmetrical triangle formation. The resistance zone lies between $4,104 – $4,113, while the support zone is marked at $4,050 – $4,055. The price has repeatedly tested both zones, suggesting market indecision. A breakout from this tightening structure could dictate the next directional move.
📌 Trade Setup
Entry: $4,061 (near trendline support)
Stop Loss: $4,050 (below support zone)
Take Profit: $4,113 (resistance)
Risk–Reward (R:R): ≈ 1 : 4.36
🌍 Macro Background
Renewed optimism surrounding US-China trade talks has reduced safe-haven demand, leading to gold’s decline near $4,065 earlier today. US Treasury Secretary Bessent confirmed that both sides reached a framework for discussion, with China expected to delay its rare earth policy by one year. At the same time, markets are nearly certain the Federal Reserve will deliver a 25 bps rate cut at the October FOMC meeting, with another cut possible in December. While trade optimism weighs on gold, rate-cut expectations continue to provide a safety net for the metal.
🔑 Key Technical Levels
Resistance: $4,104 / $4,113
Support: $4,055 / $4,061
Upside Target (if breakout): $4,130 – $4,150
📋 Trade Summary
Gold is trapped in a tightening triangle between $4,055 and $4,113. Traders may look for long entries on dips near $4,061 with targets at $4,113, aligning with Fed rate-cut expectations. However, renewed US-China optimism caps the upside. A decisive break below $4,050 would invalidate the bullish outlook and open the door toward $4,020.
⚠️ Disclaimer
This analysis is for reference only and does not constitute trading advice. Trading involves significant risk, and proper risk management is essential.

Gold analysis with trading ideasAfter nine consecutive weeks of strong gains, gold has entered a sharp correction phase. Driven by intense selling pressure, its nearly three-month winning streak has officially come to an end. However, given the persistently high levels of global geopolitical and economic uncertainty, the likelihood of a significant further decline in gold prices remains low, as safe-haven trading activity remains robust and dynamic. Currently, trade negotiations between the U.S. and China are still ongoing, while President Trump has announced the termination of all trade talks with Canada. Meanwhile, due to the U.S. Congress’ prolonged failure to pass an appropriations bill, the release of economic data continues to be disrupted, shifting traders’ focus back to central bank policies once again.
From a technical perspective, following the formation of a "double top" pattern on the 1-hour chart, gold has been oscillating under the resistance of the pattern’s neckline. Despite the bullish CPI data last Friday, gold bulls failed to push prices above the 4,160 level, indicating that short-term bullish momentum is still under significant pressure and gold is likely to remain in a wide-range consolidation. Looking at the 4-hour chart, after prices fell from the "double top" pattern, they rebounded with support from the acceleration line: the lower boundary of the range was reclaimed last Thursday, followed by a second bottoming-out and rebound on Friday—signaling that the short-term support at the lower boundary has been basically confirmed.
The key range currently lies between 4,060 and 4,170, and these two levels can be regarded as the dividing lines for short-term bullish and bearish trends. A break above 4,170 would suggest strengthened rebound momentum, potentially leading to a further test of the upper channel edge around the 4,300 area. Conversely, a break below 4,060 may trigger a continued decline toward the 4,000 support level—this forms the core framework for the current market movement.
Today’s trading strategy will revolve around the 4,000–4,170 range, prioritizing short positions at higher levels and long positions at lower levels. If prices break above 4,170, it will indicate that gold bulls have regained control, requiring a timely strategy adjustment to enter long positions on pullbacks.
XAU/USD | Gold Under Pressure, Support & Resistance to WatchGold continues to trade under pressure, holding below both the MA50 and MA200, keeping short-term momentum firmly tilted to the downside. Price is currently hovering just below the 4,095 support level, with the market remaining range-bound within a broader corrective structure.
Buyers will need a confirmed break above 4,137 to trigger a potential recovery toward 4,178 and 4,234.
On the downside, the 4,042–3,987 Support Zone serves as an intermediate area to monitor for short-term reactions. A failure to hold this zone could extend the decline toward the Deeper Support Zone, which remains a major reaction area where dip-buyers are expected to re-enter the market.
📌 Key levels to watch:
Resistance:
4095
4136
4178
4234
4285
Support:
4042
3987
3944
🔎 Fundamental focus:
Gold remains under pressure as traders weigh ongoing U.S. government shutdown risks and delayed economic data, which have limited visibility into the real state of the economy.
While short-term price action remains corrective, safe-haven demand and macro uncertainty are still expected to support gold on deeper dips toward key demand zones.

Gold is weak. Short-term short selling is recommended.Spot gold rebounded on Friday, paring intraday losses after weaker-than-expected US Consumer Price Index (CPI) data, closing above 4,100. However, it remained in a negative trend for the week, ending the previous nine-week winning streak. The weak inflation data reinforced market expectations of a 25 basis point interest rate cut by the Federal Reserve at its October 29-30 monetary policy meeting. Market sentiment improved on hopes of a easing of the Sino-US trade standoff. The White House confirmed on Thursday that US President Trump will meet with the President of Korea on the sidelines of the APEC summit in South Korea on October 30, a development that could help ease recent trade tensions.
Technically, gold is showing initial signs of consolidation after a strong rebound. The short-term outlook has turned bearish, as gold prices are currently trading below the 21-, 50-, and 100-period simple moving averages (SMAs) on the 4-hour chart, suggesting fading bullish momentum. From a wave perspective, the 4-hour chart shows an ABC corrective wave pattern, with 4380 as the starting point for wave A. Currently, gold is in the stage of confirming the high point of a wave B rebound, with a high probability of a subsequent wave C decline.
On the 1-hour chart, after forming a double top at 4380 this week and then retreating, the overall market is currently in a consolidation phase with a more bearish outlook. Resistance lies above 4160-4185, while support lies below 4004. Range-bound trading is expected next Monday. If there is risk-averse news over the weekend or if 4160 is broken directly, the weak trend can be reversed.

Gold (XAUUSD): The Mother of All Traps is Set!🥇 Gold (XAUUSD): The Mother of All Traps is Set! 🤯
Don't let the drop fool you! Gold is meticulously setting up a high-probability reversal. This isn't just a market correction; it's a calculated liquidity grab before the real explosion happens. Smart Money is loading up! 🧠💰
The Current Play: The Turtle Soup Hunt 🐢🥣
Price is dropping towards a critical reversal zone. This drop is designed to liquidate early buyers and trap breakout sellers. Our focus is the precise area where all confluences align:
Liquidity Magnet: The price needs to sweep the BSL (Buy Side Liquidity) around 4,011 and 3,998.
The Entry POI: The ultimate reversal point is the Potential Turtle Soup zone around 4,040.35 to 4,030.51. This is where sellers get trapped! 🪤
The Foundation: This zone is further validated by the CRTL (Candle Rotation Theory Low) and the prior SMT (Smart Money Technique) divergence. This is a fortress! 🏰
🚀 The Massive Rally Target
Once the low is swept and the trap is sprung, we expect an aggressive expansion:
First Target: Reclaim the recent high around 4,122.38 (CRTH + TS high).
Ultimate Target: Price will be magnetized towards the Bearish FVG 4H overhead (starting at 4,161.43). Filling that gap is the ultimate objective.
🔑 Key Trading Rules:
Patience is Profit: WAIT for the wick to pierce the 4,030 area.
Confirmation: Look for a low-timeframe (1m/5m) Market Structure Shift (MSS) after the sweep. That's your entry signal!
Risk Management: Stop-loss safely below the liquidity sweep.
Who's catching this massive XAUUSD reversal? Hit the like button if you're waiting for the sweep! 👇
Greetings,
MrYounity

XAUUSD 1D: Short Setup – Retracement to FVG Before DropKey Observations:
Market Structure Shift (MSS):
A recent large bearish candle (the red candle around October 20th) appears to have broken below a significant short-term low, which is often termed a Market Structure Shift (MSS) in institutional trading concepts. This indicates a potential change from bullish to bearish momentum.
Fair Value Gap (FVG): An unfilled price area (marked by the gray shaded box) has been identified as a FVG.
This zone often acts as a magnet where price is expected to return to "fill" the inefficiency before continuing its main direction.
Liquidity/Return Levels (CRT-L and CRT-H):The Current Range Top CRT-L marks the top of the price inefficiency or the potential area where price could reverse after filling the FVG.
The Current Range Low CRT-H marks the level where price has recently closed.Projected Move: The analysis suggests a short-term relief rally or retracement (dotted line) to move higher into the FVG area 4160$ to 4210$. Once the price moves into or near the FVG and potentially the CRT-L, the expectation is a strong bearish rejection (large green arrow) that would push the price back down, possibly towards or below the recent low CRT-H.
Conclusion:The dominant short-term bias is bearish, but a temporary bullish retracement is anticipated to fill the Fair Value Gap before the bearish continuation.

XAU/USD: Wave 5 is already starting or the bulls' last hope?XAU/USD: Wave 5 is already starting or the bulls' last hope?
📈 Weekly Scenarios
Bullish scenario: Price holds above ~$4,056-4,000, breaks through ~$4,267 → start of waves (5) up → target ~$4,380-4,455+.
Consolidation: Price moves between ~$4,000 and ~$4,267, forming a base before the next major move.
Bearish scenario: Break of support at ~$4,000 with volume confirmation → start of correction → target ~$3,820-3,943.
✅ Conclusion
On the weekly timeframe, gold is at a key milestone: either a strong profitable rally (wave 5) begins, or a correction reverses.
Main signals: holding above ~$4,000 and breaking through ~$4,267 is the way to the upside; a break below ~$4,000 is a signal for caution.

XAU/USD | Day Trade Bullish Map – Can Gold Reach 3800 This Week?🏆 XAU/USD | Metal Market Wealth Strategy Map (Day Trade) 🥇
🎯 Plan: Bullish Wealth Heist
The thief’s map is drawn — and today, the gold vault is our target.
🔑 Strategy Style (Thief Layering Method):
Instead of a single-entry, this plan uses layered limit orders (multiple entry levels). Think of it as planting “buy traps” across the chart to secure the best loot.
📥 Entry Layers (Buy Limits):
3660 💰
3670 💰
3680 💰
3690 💰
3700 💰
(⚡ Add more layers if your style allows — the thief never comes with just one key!)
🛑 Stop Loss (Escape Door):
SL @ 3630 (⚠️ Reminder: This is MY thief escape hatch. You’re free to place your own exit plan depending on risk appetite.)
🎯 Target (Loot Point):
TP @ 3800 (near strong resistance, overbought zone & police patrol 🚨)
— Remember: take profits where you feel safe. The thief escapes when the bag is full!
📊 Thief’s Key Notes
This is a layering strategy, designed for dynamic entries & better position cost-averaging.
XAU/USD often reacts strongly around resistance bands — watch for liquidity hunts before the move.
Don’t marry the trade — grab profit, exit quick, and live to raid another day.
🔗 Related Pairs to Watch (Correlation Check)
OANDA:XAGUSD (Silver): Moves in sync with Gold, but can be more volatile.
TVC:DXY (US Dollar Index): Inverse correlation — if USD weakens, gold often rallies.
FX:EURUSD : Another inverse play against USD, gold strength may reflect here.
SP:SPX / PEPPERSTONE:NAS100 : Risk sentiment cousins — equity weakness often boosts gold.
✨ “If you find value in my analysis, a 👍 and 🚀 boost is much appreciated — it helps me share more setups with the community!”
⚠️ Disclaimer: This is a Thief Style Strategy, shared for educational & fun purposes only. Not financial advice — trade at your own risk.
#XAUUSD #Gold #Forex #DayTrading #TradingStrategy #ThiefTrader #FXCorrelation #Metals #Scalping #TradingView

XAU/USD Metals Outlook: Bullish Path with Layered Buy Entry Plan🔥 XAU/USD: Thief’s Gold Heist Strategy Map (Swing/Day Trade) 💰
🎯 Asset: XAU/USD (Gold vs. U.S. Dollar) — The Shiny Metal’s Wealth Hunt!📈
Market: Metals Market
🏆 Strategy Vibe: Bullish Bandit Plan with a Thief-Style Layering Twist! 😎
🕵️♂️ The Thief’s Bullish Plan: Steal the Gold!
We’re diving into the XAU/USD market with a bullish swing/day trade setup using a slick Thief Layering Strategy. This involves stacking multiple buy limit orders to catch the price at key levels. No boring single entries here — we’re building a multi-layered trap to snag those pips! 🪤
📊 Key Setup Details
🎯 Entry Levels:
Deploy the Thief Layering Strategy with multiple buy limit orders at:
💰 3760
💰 3780
💰 3800
Pro Tip: Feel free to add more layers based on your risk appetite! Stack those limits like a master thief planning a heist. 😏
🛑 Stop Loss:
Thief’s SL set at 3720.
Note: Dear Ladies & Gentlemen (Thief OG’s), this SL is my take — you’re the boss of your trades! Set your stop loss based on your risk tolerance. Trade smart, steal smarter! 💡
🎉 Take Profit Target:
Aim for the Electric Shop High Voltage Trap at 3920. This zone screams strong resistance, overbought signals, and a potential trap for the unprepared. Escape with your profits before the market zaps you! ⚡️
Note: Thief OG’s, this TP is my suggestion. Grab your profits at your own pace and risk level — make it rain when you’re ready! 💸
🔗 Related Pairs to Watch (Dollar-Based Correlations)
Keep an eye on these USD-based pairs for market synergy and correlation:
FX:USDJPY : A stronger USD could pressure gold prices, so watch for inverse moves. If USD/JPY spikes, XAU/USD might dip. 📉
OANDA:USDCHF : Another safe-haven pair. If CHF strengthens, it could signal risk-off vibes impacting gold. 👀
TVC:DXY (U.S. Dollar Index): Gold often moves inversely to the dollar. A rising DXY could cap XAU/USD’s upside — stay sharp! 🧠
OANDA:XAGUSD (Silver): Gold’s shiny cousin often follows XAU/USD’s lead. Check for confirmation in silver’s price action. ✨
Why Watch These? Correlations help you spot market sentiment. If USD strengthens across pairs, gold’s bullish run might face resistance. Use these as your Thief’s Radar to time your entries! 🕵️♀️
🔑 Key Points of the Thief Strategy
Layering Entries: Multiple buy limits spread risk and increase chances of catching a favorable entry. Think of it as setting multiple traps for the price! 🪤
Risk Management: The suggested SL at 3720 keeps losses tight, but adjust based on your account size and risk tolerance.
Resistance Watch: The 3920 zone is a high-voltage trap with overbought signals. Secure profits early to avoid getting caught in a reversal. ⚡️
Market Context: Gold thrives in uncertainty, so keep an eye on global events, Fed news, or inflation data that could spark volatility. 📡
⚠️ Disclaimer
This is a Thief-Style Trading Strategy crafted for fun and educational purposes. Trading involves risks, and past performance doesn’t guarantee future results. Always conduct your own analysis and trade at your own risk. Stay sneaky, stay safe! 😎
✨ If you find value in my analysis, a 👍 and 🚀 boost is much appreciated — it helps me share more setups with the community!
#️⃣ #XAUUSD #GoldTrading #ThiefStrategy #SwingTrading #DayTrading #BullishSetup #ForexTrading #TradingView
XAU/USD Technical Setup ‖ Bullish Momentum or Smart Trap?🏆 XAU/USD: The Golden Heist Blueprint | Swing & Scalp Strategy 💰
📊 Market Overview
Asset: XAU/USD (Gold vs U.S. Dollar)
Market: Precious Metals
Strategy Type: Dual Setup - Swing Trading (Bullish) & Day Trading/Scalping (Bearish)
Risk Level: High Volatility Zone ⚠️
🎯 The Master Plan
🚀 Bullish Scenario: "To The Moon" Setup
Breakout Level: $4,400.00
Action: Direct long entry on confirmed breakout above resistance
Logic: Clean break = institutional momentum shift
🔻 Bearish Scenario: Scalping/Day Trade Setup
Breakdown Level: $4,050.00
Action: Short positions on confirmed break below support
⚠️ Trap Alert: Any pullback above $4,050.00 post-breakdown = potential smart money trap. Watch for false breakouts!
🛡️ Risk Management Zone
Stop Loss (Pullback Buy Plan): $3,950.00
⚠️ Disclaimer: This SL is based on my analysis for the bullish pullback scenario. You're the captain of your own ship! Adjust stops according to your risk tolerance, account size, and trading style. Never risk more than you can afford to lose.
🎖️ Profit Targets
Buy Side Target: $4,600.00
Exit Strategy Notes:
Strong resistance confluence at this level
Overbought conditions likely
Potential trap zone for late entries
Recommendation: Scale out profits gradually rather than waiting for the full target
Sell Side Target: $4,050.00
Exit Strategy Notes:
Major support level - expect bounces
High probability of liquidity grab at this zone
Consider partial profit taking before reaching full target
Recommendation: Trail stops as price moves in your favor
⚠️ Disclaimer: These targets are MY analysis, not financial advice. Take profits when YOUR strategy signals, not mine. Trail stops, scale out, or exit based on YOUR plan. Your money, your rules! 💪
🔗 Related Markets to Watch
Correlated Assets:
DXY (U.S. Dollar Index): Inverse correlation - Dollar strength = Gold weakness
GC (Gold Futures): Direct correlation - Institutional positioning indicator
XAUEUR (Gold vs Euro): Alternative safe-haven flow gauge
US10Y (10-Year Treasury Yield): Inverse correlation - Rising yields pressure Gold
BTCUSD (Bitcoin): Risk-on/risk-off sentiment indicator
Key Fundamental Drivers:
Fed monetary policy & interest rate decisions
Inflation data (CPI/PCE reports)
Geopolitical tensions (safe-haven demand)
Real yields & opportunity cost
🔑 Key Technical Points
✅ Breakout Confirmation: Wait for candle close above/below key levels
✅ Volume Analysis: High volume breakouts = higher probability
✅ Smart Money Traps: Watch for failed breakouts and liquidity grabs
✅ Risk-Reward Ratio: Calculate before entry - minimum 1:2 recommended
✅ Market Structure: Respect higher timeframe trends
🎭 Trading Psychology Reminder
This strategy has a playful "heist" theme for entertainment, but make no mistake — treat your capital with serious respect. The market doesn't care about our plans. Adapt, manage risk, and preserve capital above all else.
Remember:
No setup is guaranteed
Always use stop losses
Never risk your rent money
Emotions are the enemy
The market pays patient traders
✨ If you find value in my analysis, a 👍 and 🚀 boost is much appreciated — it helps me share more setups with the community!
#XAUUSD #Gold #GoldTrading #ForexTrading #SwingTrading #DayTrading #Scalping #TechnicalAnalysis #PreciousMetals #TradingStrategy #RiskManagement #Forex #GoldAnalysis #TradingIdeas #MarketAnalysis #PriceAction #Breakout #SupportAndResistance #TradingView #ForexSignals
Happy trading, and may the pips be ever in your favor! 🎯💎

Gold: Building a bottom, but caution remainsWeekend Greetings!
Over the past week, gold has been consolidating within the 4160–4000 range. Technically, this range suggests a short-term bottoming phase. However, given that prices recently reached new highs and have since formed a double-top pattern, it’s still too early to confirm a bottom. In the upcoming sessions, traders should remain cautious, avoid chasing highs, and be alert for potential bull traps or a fifth-wave decline, as mentioned last week.
On the 4H chart, higher lows are being established, and Friday’s close was above both the MA5 and MA20, with the MACD maintaining a bullish configuration. The MA60 and MA30 are currently positioned around 4180 and 4163, respectively, serving as key resistance zones. If gold can hold above these levels, there’s a good chance it will approach or even reclaim the 4300 level.
On the daily chart, gold remains supported by the MA20, with long lower wicks indicating active bullish participation, which favors further upside. However, the MA5 and MA10, located around 4154 and 4188, still act as short-term resistance. For a stronger bullish confirmation, the price needs to stabilize above 4160, ideally holding firm above 4180.
On the 30M/1H charts, moving averages are closely aligned, showing short-term consolidation. Notably, the last three candles on the 30M chart form a Morning Star pattern, a typical bullish signal. If this formation remains intact after the market opens, prices are likely to move higher.
From a fundamental perspective, no bearish news emerged over the weekend. Unless unexpected developments occur before the market opens, the technical outlook favors an upward move during Monday’s session.
XAUUSD Analysis todayHello traders, this is a complete multiple timeframe analysis of this pair. We see could find significant trading opportunities as per analysis upon price action confirmation we may take this trade. Smash the like button if you find value in this analysis and drop a comment if you have any questions or let me know which pair to cover in my next analysis.

XAUUSD: Structure Broken! Can the Fed Rate Cut Save Gold?Gold has just completed its first losing week in 10, after a historic rally. Following the record peak of $4,381.21, Gold experienced a sharp correction driven by profit-taking and easing US-China trade tensions. However, weaker-than-expected US CPI data has strongly reinforced expectations for an upcoming Fed rate cut, creating a significant market conflict.
I. MARKET CONTEXT ANALYSIS (H4)
Structure: The prior bullish structure has been broken, shifting the bias to bearish in the short term.
Liquidity: Market forces are now targeting key stop-loss zones to collect liquidity before the next major move.
Strategy: We look to Sell when price pulls back to the Supply Zone (Premium) and Buy when price sweeps liquidity into the strong Demand Zone.
II. DETAILED TRADING PLAN
1. SELL Scenario 📉 (At Supply Zones)
Trade 1:
Entry: $4,202 - $4,204
SL: $4,212
TP: $4,194 / $4,184 / $4,174 / $4,164
Trade 2:
Entry: $4,252 - $4,256
SL: $4,272
TP: $4,236 / $4,216 / $4,196 / $4,176
2. BUY Scenario 📈 (At Demand Zones)
Trade 1:
Entry: $4,158 - $4,161
SL: $4,151
TP: $4,168 / $4,178 / $4,188 / $4,198
Trade 2 (Critical):
Entry: $3,966 - $3,969 (Strong Demand Zone, post-liquidity sweep)
SL: $3,949
TP: $3,989 / $4,009 / $4,029 / $4,049
III. RISK MANAGEMENT NOTE
Capital: Always limit risk to ≤ 1% of capital per trade.
Confirmation: Prioritize waiting for reversal confirmation on lower timeframes (M15/M5) to optimize Risk/Reward ratio.
This is the decisive moment! Trade safe and good luck!
#XAUUSD #Gold #GoldAnalysis #Forex #Trading #Fed #Inflation

xauusd's swbig corrective :D
no clearly trend's form here
2 choices for SW -> wait and sell High , Buy low
if the price move into the zone,
then you see trend in the lower TF
follow it ! if you can :D
if you know what is a trend :(
HH HL = bull
LL LH = bear

Gold Weekly Forecast Liquidity Retest or Correction Phase AheadGold is showing early signs of a technical slowdown after a strong bullish wave that tested the 4200–4300 resistance zone. Price may attempt a mild retest of this area early in the week, but if rejection continues, a deeper correction toward the 4000–3900 demand zone could follow. A clear weekly close above 4300, however, may trigger renewed bullish strength toward the 4400 region.
Key Levels:
Resistance: 4200 – 4300
Support: 4000 – 3900
Next Bullish Target (on break): 4400
Reasoning:
Technically, the market structure shows a possible liquidity sweep near 4300, followed by bearish rejection candles, signaling weakening momentum. The Fibonacci retracement between 4000–3960 aligns with the Fair Value Gap, suggesting potential liquidity attraction before another bullish continuation.
Fundamentally, the upcoming U.S. GDP, Core PCE, and FOMC remarks may drive volatility. Strong U.S. data or hawkish commentary could strengthen the dollar and pressure gold lower, while softer readings might offer temporary support to buyers.
Disclaimer:
This analysis is for educational and informational purposes only and does not constitute financial advice. Always perform your own research and manage risk responsibly.
Trading strategy for gold next weekThe callback is in place and the rebound pattern has been established.
The key support has precisely stabilized: Over the past two trading days, the gold price dropped to a minimum of $4085 before quickly rebounding. This position precisely coincides with the 0.618 retracement point of the previous upward trend. The technical support is quite strong. From the time chart, there have been multiple "bottoming and rebounding" trends in the $4085 - $4100 range, indicating that the buying pressure at the lower levels is strong and the short-term selling pressure has been largely released.
The rebound trend has initially formed: Currently, the gold price has closed higher for two consecutive trading days and has broken through the short-term resistance level of $4100, forming a "two consecutive up days" trend. During the rebound process, the trading volume gradually increased, especially when breaking through $4100, the trading volume was 30% higher than that of the same period the previous day, indicating that the long-term funds have actively entered the market, and the short-term rebound trend has been initially established.
Trading strategy for gold next week
xauusd @ buy4060-4080
TP:4110-4130-4200

Review of Gold's Performance This Week📝This week, the gold market experienced severe volatility, showing an overall trend of a sharp decline followed by a volatile rebound. The details are as follows:
📈Price Movement:
On Monday, gold prices fluctuated between 4,218.32 and 4,354.88.
On Tuesday, gold plummeted by 6.3% at one point, marking the largest single-day drop since April 2013.
On Wednesday, it continued to fall, hitting a low of 4,003.43.
On Thursday, gold fluctuated within the range of 4,065.47 to 4,154.52.
On Friday, gold prices fell again, dropping below 4,060 at one stage with an intraday decline of over 1%, and finally closed at 4,110.55.
💡Influencing Factors:
✔The main reasons for the sharp volatility in gold prices this week include the following:
After a rapid rise in early stages, gold was in an overbought state, creating technical correction pressure. Meanwhile, investors had a strong sentiment to take profits, leading to a large number of sell-offs.
✔In addition, the cooling of risk aversion, the strengthening of the U.S. dollar, and the fact that Federal Reserve officials entered a blackout period ahead of the interest rate decision that are resulting in a lack of remarks supporting interest rate cuts in the market also reduced the appeal of gold.
✔However, factors such as the ongoing U.S. government shutdown, geopolitical tensions, and market expectations for further interest rate cuts by the Federal Reserve provided certain support for gold prices.
💎Outlook for the Future:
From a technical perspective:
If gold breaks through 4,161, it may pave the way for a test of 4,200. If it continues to rise, traders may push gold prices above 4,250, or even target 4,300 and higher record highs.
But if gold falls below 4,040, the next target will be the October 22 low of 4,004.

Gold price analysis October 27GOLD ANALYSIS – Bullish wave structure remains intact
From the current wave outlook, gold has started to form a sequence of bullish impulses following a period of corrective movement. The key point of focus right now is the resistance zone at 4146 — this area represents a crucial threshold for the next bullish leg.
If buyers manage to push through this zone with strong momentum, the price could quickly retest or even break the all-time high (ATH) levels in the coming sessions.
For the upcoming week, the BUY setup continues to be the primary strategy as long as the structure remains valid. The 4056 support zone serves as the main base of this bullish setup — a break below it could temporarily weaken the path toward ATH recovery.
📈 Trading Plan:
BUY now: 4114
BUY trigger: Price rejection around 4056
Target: 4375

EURUSD Analysis week 44🌐Fundamental Analysis
Business activity in Germany and the Eurozone continued to improve in October. This positive data helped the Euro maintain its strength in the European session.
However, experts warn that the growth outlook remains fragile, despite the current favorable conditions.
In the US, CPI inflation in September is forecast to increase to 3.1%, with core CPI rising 0.3%. A higher than expected figure could strengthen the USD and put pressure on EUR/USD; conversely, weak data would support the Euro's recovery in the US session.
🕯Technical Analysis
EURUSD is making a strong upside recovery towards the resistance of 1.172. A break above the 1.162 zone would immediately become an important support zone supporting the EURUSD's upward momentum. The BUy strategy will be paid more attention next week. The weekly support zone of 1.158 will play a key role for the buyers, if this zone is broken, the pair will fall into a strong Downtrend.
📉Trading Signals
SELL EURUSD 1.172-1.174 Stoploss 1.179
BUY EURUSD 1.158-1.15600 Stoploss 1.153

Analysis of gold movement on the 4-hour time frameHi traders
Gold has not been able to close a candle above the equilibrium range (4114) for the 4-hour time frame for now, but it can have an upward movement to the resistance areas, pick up the rising liquidity, and then return to close a candle below the 4-hour equilibrium range (it can stabilize below 4067, in which case it will pullback to 4067 and 4090 and towards the sell).
For the resistances in question, 4171 - 4193 and 4208 - 4231 are two one-hour equilibrium resistances that the market has not yet pulled back to these numbers, and the 4-hour candle after the pullback should stabilize below these areas to confirm the continuation of the decline to low liquidity and sellers' TPs

technical analysis for Gold (XAU/USD) based on your provided chaPrice: Around $4,112.53
Timeframe: 30-minute
Trend Structure: Gold is trading within a rising channel, suggesting short-term bullish momentum after rebounding from a support level.
🧭 Key Technical Zones
Support Level: $4,060 – $4,080
→ This zone has held price multiple times and aligns with the channel’s lower boundary.
Immediate Resistance: $4,125
→ Minor horizontal resistance, currently being retested.
Mid-term Resistance: $4,175 – $4,200
→ The upper boundary of the short-term consolidation range.
Main Target Zone: $4,381
→ Marked as the projected bullish target; aligns with the top of the ascending channel.
📊 Pattern & Projections
The chart shows a bullish continuation setup (possibly a flag or channel breakout in progress).
Price recently bounced from support and is respecting the ascending trendline, hinting at a possible push toward higher resistance levels.
A break above $4,125 could trigger momentum toward $4,175, then $4,225, and finally the target at $4,381.
⚠️ Risk Management
Invalidation: A close below $4,075 (support zone) would invalidate the bullish scenario and could push price back toward $4,025 – $4,000.
Stop-Loss (for buyers): Below $4,070.
Take-Profit Levels:
1️⃣ $4,175
2️⃣ $4,225
3️⃣ $4,381
🟢 Summary Signal
Bias: Bullish
Entry Zone: Around $4,100 – $4,115 (after confirmation of support hold)
Target: $4,381
Stop-Loss: $4,070 NASDAQ:TSLA NASDAQ:AAPL CME_MINI:NQ1! CME_MINI:ES1! COMEX:GC1! CBOT_MINI:YM1! COMEX_MINI:MGC1! NYMEX:CL1! COMEX:SI1! CME_MINI:RTY1! CBOT_MINI:MYM1!

Trading strategy for gold next weekThe low-level support has been verified through practical operations, and the rebound momentum is beginning to show.
Strong support is clearly effective: In the past three trading days, the spot price of gold in London dropped to the lowest level of 4044.07 US dollars and then rebounded rapidly. This position has formed a short-term "iron bottom". Although the current price has experienced a correction, it has always remained above the 4100 US dollar threshold, and the trading volume during the correction process did not significantly increase, indicating that the short selling pressure is limited and the buying pressure at the lower level is strong.
The rebound signal is beginning to emerge: After the release of the September CPI data, the gold price briefly rose by 30 US dollars. Although it subsequently fell back, it has broken the previous continuous decline trend. From the time chart, the 4100-4110 US dollar range has repeatedly shown a "bottoming out and rebounding" trend, with obvious short-term stabilization characteristics, and the rebound momentum is accumulating.
Trading strategy for gold next week
xauusd @ buy4060-4080
TP:4110-4130-4200
