Gold Breakdown Alert! Bears Aiming $3980 NextGold is currently showing a descending triangle / bearish channel pattern on the 15-minute chart. After testing the upper trendline resistance around 4113–4115, price has started to reject, indicating potential downward pressure.
The trendlines show clear lower highs and lower lows, confirming a short-term bearish structure. Volume is also decreasing on upward moves, suggesting weakening buying momentum.
📉 Trade Setup (Scalping / Intraday)
Signal: 🔻 SELL XAU/USD below 4105
Entry Zone: 4105 – 4110
Target 1: 4050
Target 2: 3980
Stop Loss: 4135
Risk/Reward Ratio: ~1:2
⚙️ Technical Indicators
Trendline Resistance: 4115
Support Zone: 4050 / 3980
Momentum: Bearish bias
Structure: Lower highs forming under descending resistance
💬 Analyst View
Gold may continue its short-term correction phase if it fails to hold above the 4110 resistance zone. A breakout below 4100 could trigger a fresh wave of selling pressure targeting the 4050 area initially.
If bulls reclaim 4135, this analysis becomes invalid and could shift bias to neutral.
Xauusdanalysis

XAUUSD (Gold) seeking $4,000 region?As my H4 chart shows, gold did make a double top a few days ago and then crashed. You can give credit for this massive 3,800 points move to profit taking or economic uncertainty or any technical reason, maybe a combination but it really does not matter.
What does matter is that we now have a double or triple top indicating that we have more room to the down side. I am seeing a medium term bearish move followed by a consolidation and now it may be that we will get a breakout (to the down side) to give us a bearish continuation.
How far will we go? I have no idea but the round number 4,000 followed by 3,950 do make sense. If all this works out as I anticipate, it may be a good idea to close a partial position, move the stop to a level of small profit and then trail the price action.
This is not a trade recommendation; it’s merely my own analysis. Trading carries a high level of risk so carefully managing your capital and risk is important. If you like my idea, please give a “boost” and follow me to get even more.

Analysis of gold price trends next weekShort-term catalyst: Risk disturbances and technological stabilization form a synergy
Geopolitical "tail risks" continue to escalate: The escalation of US sanctions against Russian energy giants, the intensification of competition in the technology sector between China and the US, coupled with the 23-day government shutdown crisis in the US, have continuously fuelled market risk aversion. What is even more alarming is that the new restrictions in the Russian energy sector have spilled over to the transportation costs of commodities, and if this potential risk unfolds, it will rapidly drive funds into gold.
Stabilization after sharp decline validates support strength: On October 21, the spot price of gold in London dropped by more than 6% from its historical high of 4,381 US dollars, approaching the 4,100 US dollar mark, but then rebounded rapidly. On October 23, the intraday gain was over 1.27%, recovering most of the lost ground. This "sharp decline without collapse" trend fully confirms the strong support effect in the 4,000-4,100 US dollar range and also reflects the market's recognition of the long-term value of gold.
Technical aspect presents "strong consolidation" characteristics: The daily chart shows that after the price decline, it still operates above the middle band (3,964.72 US dollars) of the Bollinger Bands, without disrupting the upward trend; the RSI indicator has dropped from the overbought zone to the middle-high level of 58.19, which is a healthy "cooling without breaking through". Currently, the price is in the stabilization stage after the correction, and as long as the key support is held, the second upward attack momentum will gradually accumulate.
Trading strategy for gold next week
xauusd @buy4040-4060
TP:4110-4150-4200

XAUUSD – CPI Cools, USD Weakens, and Gold Regains MomentumMarket Overview:
Gold has regained bullish traction after the latest US CPI report showed softer inflation data, leading to a weaker USD and renewed buying across metals.
CPI figures came in below market expectations (Core CPI 0.2% vs 0.3%, CPI m/m 0.3% vs 0.4%, CPI y/y 3.0% vs 3.1%), signalling lower inflation pressure and reinforcing bets that the Fed will stay dovish heading into November.
As a result, gold bounced strongly from the 4,050–4,058 support zone, reclaiming key structure levels and stabilising above 4,100 USD/oz.
Market sentiment remains risk-sensitive, but the short-term tone favours further upside correction, as long as gold holds above the trendline and liquidity support zones highlighted on the chart.
Technical Outlook (H2):
The market structure suggests gold has completed its correction phase and is attempting to form a new bullish leg.
Price action shows a clean rejection at the 4,050 liquidity base, and the next immediate objectives are the 4,211 neckline and 4,260–4,342 supply zones.
Key Technical Levels:
Support / Buy Zone: 4,058 – 4,002
Liquidity Sweep Zone: 3,930 – 3,940
Resistance / Neckline: 4,211
Sell Zone Reaction Fibo: 4,260 – 4,342
Trading Plan – MMFLOW View
🔹 BUY Zone #1 (Continuation Play)
Entry: 4,058 – 4,050
Stop Loss: 4,035
Take Profit: 4,155 → 4,211 → 4,260
🔹 BUY Zone #2 (Liquidity Sweep Scenario)
Entry: 4,002 – 3,930
Stop Loss: 3,915
Take Profit: 4,058 → 4,155 → 4,211
Ideal setup if price retests liquidity before CPI-induced recovery continues.
🔹 SELL Zone(Reaction Trade)
Entry: 4,260 – 4,342
Stop Loss: 4,355
Take Profit: 4,211 → 4,100 → 4,058
Weekly Bias & Summary:
With CPI cooling and the USD losing momentum, gold’s structure points to a recovery phase, possibly extending into Wave III of the medium-term cycle.
However, the 4,211 neckline remains the key pivot — a breakout above this zone could trigger momentum extension toward 4,260–4,340, while a rejection may result in another range-bound pullback.
🟡 MMFLOW Bias: Bullish while above 4,050 — dips remain opportunities to buy.
Macro tone favours risk-on rotation, supporting gold’s upside into next week.
📊 Do you think gold will break 4,211 for the next bullish leg, or is another correction incoming before the real move?
👉 Follow MMFLOW TRADING for daily institutional updates and Smart Money Flow structure.

Last trading day. Watch for resistance levels.After the CPI data was released as expected, while the results appear bullish for gold, the market reaction was muted, and the price rebound was relatively weak. This is likely because the current gains may have already overdrawn all positive expectations, and the market needs a period of cooling off.
On the 4-hour chart, gold prices rose on the data, returning to a range of fluctuations. The moving averages are showing a relatively flat trend. The 5-, 10-, and 20-minute moving averages intersect with the middle Bollinger Band in the 4100-4110 range, which also represents a significant short-term support level. The 30-minute moving average is nearing its intersection with the upper Bollinger Band in the 4170-4180 range.
Based on technical indicators, watch for resistance at 4160 in the short term, with a breakout at 4180. Focus on support at 4100-4110 below.
Quaid believes that as the last trading day of the week, the price may also fluctuate slightly around 4130. But if it suddenly starts to break upward, then we need to pay attention to the suppression situation above. When the price first hits around 4160 and fails to break upward effectively, short sell with a light position at this position and make a profit of 30-40 points.
A happy weekend is coming, Quaid hopes everyone reaches their profit targets this week.

Analysis of the trend of gold next weekCurrently, the gold market is in a stage of "shock - upward movement driven by news". Although there is a battle between bulls and bears at the $4112 level, the upward opportunities next week are more worthy of attention. It is necessary to lay out in line with the trend and strictly control risks. The specific strategy is as follows:
I. Core Logic: Key Factors Influencing the Gold Price Trend Next Week
1. **The medium - and long - term support foundation remains intact**: The Federal Reserve has already started the interest - rate - cutting cycle. Judging from the meeting minutes, officials tend to gradually continue to loosen policies. As a result, the cost of holding gold is getting lower and lower, and its attractiveness is naturally increasing. Moreover, global central banks are still continuously buying gold. This long - term and large - scale buying can underpin the gold price, making a significant decline highly unlikely. In addition, the output growth rate of the world's top ten gold - mining enterprises has only been 1.8% in the past three years, and the problem of tight supply will also support the price in the long term.
2. **Short - term positive signals are increasing**: There are new signs of tension in the Middle East situation. The Houthi militia in Yemen has attacked the cargo ships in the Red Sea, resulting in 18% of the world's container ships changing their routes, and the shipping costs have soared. The market's safe - haven demand has significantly rebounded. Once such geopolitical risks ferment, they will drive funds to flow into gold. At the same time, the gold price rebounded after falling to around $4000 this week, indicating that the buying support at low levels is very strong, and much of the previous pullback pressure has been released.
3. **Key events next week will determine the direction**: The market is closely watching the changes in relevant news. Whether it is the new dynamics of the Middle East situation or the policy signals from the Federal Reserve, they will directly affect the gold price trend. Judging from the recent fluctuations, as long as the support near $4000 is not broken, the possibility of an upward trend is greater than that of a downward trend.
Trading strategy for gold next week
xauusd @buy4040-4060
TP:4110-4150-4200

XAUUSD: Head & Shoulders Reversal and Current Consolidation1. Major Trend
The price experienced a strong uptrend starting from approximately 4,000 USD up to a high of around 4,380 USD.
This was followed by a sharp and significant downtrend back towards the 4,000 USD level.
2. Market Structure (Head and Shoulders Pattern)
The shaded circles on the chart suggest the presence of a potential "Head and Shoulders" reversal pattern, a bearish formation:
The first peak (left shoulder) is around 4,320 USD.
The highest peak (head) is around 4,380 USD.
The second major peak (right shoulder) is around 4,380 USD (or slightly lower than the head).
The breakdown from this structure led to the sharp decline.
3. Recent Price Action (Consolidation and Potential Breakout)
The sharp decline has slowed down and the price is currently showing signs of consolidation (choppy, sideways movement) in a tight range, specifically highlighted by the yellow box, between approximately 4,080 USD and 4,120 USD.
This consolidation zone is often referred to as a flag or tight-range base.
The chart includes an upward-pointing green arrow, suggesting an expectation or prediction of a bullish breakout from this consolidation range, potentially targeting the prior resistance/highs of the current range.
The price is holding just above the 4,000 USD psychological support level.

Elliott Wave Analysis – XAUUSD (October 24, 2025)
1️⃣ Momentum
D1 Timeframe:
• D1 momentum is closing within the oversold zone → bearish strength has clearly weakened.
• The probability of a bullish reversal is now very high.
• A strong bullish D1 candle close is needed to confirm the reversal.
• Once confirmed, price may enter a 5-day bullish rally.
H4 Timeframe:
• H4 momentum is still declining.
• If the current H4 candle closes as it is now, we may see a main bearish move today (around 5 H4 candles).
• Since today is Friday, a deeper decline remains possible.
→ Therefore, careful observation and analysis are required before entering any trades.
H1 Timeframe:
• H1 momentum continues to decline.
• Price may drop toward the 4098 liquidity zone.
• If this level breaks, the next potential target is 4050.
________________________________________
2️⃣ Wave Structure
D1 Structure:
• Price has been moving sideways for several days.
• In Elliott Wave theory, when price reaches its target, it often needs time symmetry before the wave completes.
• Therefore, this prolonged sideways phase helps maintain time balance.
• It’s still too early to confirm whether this is yellow Wave 4 or just Wave 4 within yellow Wave 3.
H4 Structure:
• There are two possible scenarios:
1. The blue Y wave is still unfolding.
2. The purple Wave 5 has already started forming.
• To determine which scenario is valid, we monitor the current
H4 bearish phase:
o If price does not break the previous low, and H4 momentum enters the oversold zone, it likely indicates purple Wave 5 has begun, with an upside target near 4476.
o If price breaks the previous low, the blue Y corrective wave is still in progress, or a larger corrective structure is unfolding.
o In that case, we’ll watch the lower liquidity zones, with the ideal completion target for Wave Y around 3927.
H1 Structure:
• On the H1 chart, Wave C appears to have completed in the form of an Ending Triangle.
• According to Elliott theory, after an ending triangle, price should drop sharply and quickly.
• However, such a strong drop hasn’t appeared yet, so we continue to observe the price action carefully.
There are two main scenarios to consider:
1. If price declines slowly toward the 4050 liquidity zone, showing overlapping waves while H4 momentum moves into the oversold region, it’s likely that Wave 5 has already started.
→ In this case, we’ll look for buying opportunities.
2. If price falls rapidly and steeply, it suggests that the blue Y wave is still unfolding, or that the market is inside a larger corrective phase.
→ In this case, price may break below 4004, and we will patiently wait for buy setups around 3953 or 3927.
________________________________________
3️⃣ Trading Plan
• Sell Setup:
o Yesterday’s sell zone at 4149 has already reached about +400 pips.
o No new ideal sell zone for now → wait for liquidity breaks to look for the next sell setup.
• Buy Setup:
o Monitor potential buy reactions at:
4050
3953
3927
⚠️ Note:
Price is currently at a sensitive zone, with each candle showing a range over 200 pips.
→ Therefore, limit orders are highly risky at the moment and could easily get stopped out.

XAUUSD Bearish Retracement Targeting $4,000 SupportContext and Trend
Prior Bullish Trend: The chart clearly shows a strong, sustained uptrend leading up to October 22nd, with the price moving from below $3,920 to a peak near $4,200.
Recent Sharp Reversal: This strong bullish move was abruptly interrupted by a massive bearish candlestick on October 22nd, indicating a sharp and significant sell-off from the high. This move marks a potential shift in the short-term momentum.
Current Price Action and Key Zones
Current Consolidation/Retracement: Since the sharp drop, the price has entered a phase of consolidation or a retracement (a move back up) within the area that saw the sharpest selling pressure.
Supply/Resistance Zone: The blue shaded rectangle, which ranges roughly from $4,080 to $4,120, is a key area. This zone represents an area where the market may have found previous support or, more likely, is now acting as a supply zone (resistance) after the large drop. Traders often look to sell when the price re-enters a zone that previously broke down quickly, anticipating fresh selling pressure.
Price Prediction (The Path): The drawn arrows indicate a predicted move:
The price moves up to test the $4,080 - $4,120 supply zone.
Upon hitting resistance, the price is expected to reverse and fall.
The predicted target for the drop is the dashed green line at $4,009.10 (a level very close to the significant psychological support level of $4,000).
Conclusion
The chart suggests a high-probability short-term selling opportunity (or "short" trade) if the price reaches the supply zone, with the trade aiming for the major support level just above $4,000. The setup is based on the technical analysis pattern of a bearish continuation after a strong impulse move down.

Gold: Double Bottom or Five-Wave Decline?After rising to the MA60 area on the 4-hour chart, gold faced significant selling pressure, and the price has now pulled back to around 4050, which lies near the short-term support zone. Over time, the MA20 support on the daily chart has moved up to around 4055, while the MA30 currently sits near 3942.
On the 1-hour chart, the downtrend appears not yet complete, so pay attention to the next two closing candles. For now, key support levels to watch are 4014–4000, followed by 3978–3937.
If the price stabilizes around 4000, a double-bottom pattern could potentially form. However, if it falls further toward the MA30, a head-and-shoulders pattern may come into play. In case the rebound fails to break above resistance, be cautious of a five-wave decline, as that could trigger another sharp correction, with a high likelihood of filling the gap near 3887.
In terms of trading strategy, the focus should still be on finding buying opportunities.
For medium-term setups, you can hold positions patiently; for short-term intraday trades, pay close attention to the key supports mentioned above, and use the MA20/60 on the 30-minute chart as reference points for resistance.

XAUUSD (Gold): Bearish Breakdown Targets $4,028 SupportKey Observations
Prior Volatility: The period starts with a significant spike (a long red candle), indicating extreme bearish pressure followed by a recovery attempt.
Uptrend Attempt (October 22nd - 23rd): Following the sharp drop, the price began to form a series of higher highs and higher lows (indicated by the small black dots/circles), suggesting an attempted short-term recovery or uptrend. The price moved from a low near $4,020 to a high around $4,150.
Recent Reversal (October 24th): The attempted rally failed after hitting a peak around $4,150. Since that high, the price has been in a clear and aggressive downtrend, forming a series of strong bearish (red) candles.
Current Price Action & Projection: The chart shows the current price at $4,052.95 and an explicit projection (indicated by the green arrow and zig-zag line) toward the previous swing low, marked by a dotted green line at $4,028.03. This suggests that based on the current momentum, the price is expected to test this support level.
Support Level: The horizontal dotted line at $4,028.03 (or possibly the earlier low near $4,020) represents a key near-term support level.
Conclusion
The chart shows a strong bearish momentum dominating the market after a failed recovery attempt. Traders are currently anticipating a test of the support level around the $4,028 to $4,020 area.

Gold 4-hour timeframe analysisHi traders
In the 4-hour gold structure, following the break below the balance zone’s low, we can consider the entry of 4-hour sellers. The pullback zones for these sellers are at 4067 and 4090. The defined take-profit level for this time frame is 3773. As long as this balance remains intact (i.e., no 4-hour candle closes above the zone), the mentioned target will remain valid

GOLD ON SELL#XAUUSD price will continue bearish on 2 times breakout below 4058, we expect price to multiple break there before more dropping.
Entry 4058 2 times breakout, target 4022, stop loss 4075.
Price can sell from Market price also. The bullish depends on the cpi data release.

GOLD HIGH PROBABILITY SETUP SOON!!! 🚨 XAUUSD HIGH PROBABILITY BUY SETUP 🚨
* Here We Can See Clearly The Next Potential Moves For GOLD Coming Hours/Days.
* Keep Your Eyes Close On Your Trading Positions.
* Happy PIP Hunting Traders.
FXKILLA.

XAUUSD Geoplolitical move?Hello traders, this is a complete multiple timeframe analysis of this pair. We see could find significant trading opportunities as per analysis upon price action confirmation we may take this trade. Smash the like button if you find value in this analysis and drop a comment if you have any questions or let me know which pair to cover in my next analysis.

Gold is in a volatile market. Awaiting data releases.In the current market, the critical dividing line of $4,180 is not only a technical resistance level, but also a tipping point for the reshaping of market logic. The surge and pullback have become a shift in market momentum, fueled by an irrational exuberance fueled by bullish sentiment. The surge in gold prices over the past three months is essentially the product of a triple force: policy expectations, geopolitical risks, and central bank gold purchases.
During this process, market sentiment shifted from cautious testing to frenzied pursuit of gains. The RSI indicator briefly crossed the overbought threshold of 80, suggesting that gold prices had broken free from fundamental support. This correction is also inevitable due to a technical correction. When gold prices reached the all-time high of $4,400, market structure shifted subtly: quantitative trading systems triggered stop-loss orders, institutional investors began taking profits, and retail investors' enthusiasm for the rally reached its peak. This pullback is not a trend reversal, but rather a temporary release of upward momentum. Like a spring that rebounds after being compressed to its limit, the market needs to oscillate through fluctuations to clear floating chips and accumulate energy for subsequent breakthroughs.
The market is currently in a fundamentals "information black hole." The US government shutdown has delayed the release of key data such as the non-farm payroll report and CPI, creating a "policy expectations vacuum." In the absence of economic data guidance, investors are increasingly divided over the pace of the Fed's rate cuts. However, central bank gold purchases and geopolitical risks have limited downside potential, creating a volatile market with a "bottom and a ceiling."
In the short term, gold will maintain a volatile pattern centered around $4,180. Quaid recommends buying low and selling high within the $4,180-$4,000 range, monitoring Fed policy signals and geopolitical developments. We should also be wary of data shocks after the US government shutdown ends and the risk of a sudden easing of geopolitical conflicts. A break below $4,000 could trigger a technical sell-off.
Thus, short-term traders seek certainty amidst volatility. The current volatility in the gold market is essentially a technical correction within the bull market, not the end of the trend. The $4,180 level marks both a battleground for bulls and bears and a starting point for reconstructing market logic.
For investors, remaining patient amid volatility and seeking certainty amid disagreements may be the best strategy to deal with the current market.
The last trading day of the week, coupled with the release of CPI data, marks the first major data release since the US government shutdown, potentially triggering significant market volatility.
Strategy implementation will remain in place until the CPI data is released. I will update the strategy in the channel after the data is released.

Today's trading strategy for gold is hoped to be helpful to you.Long-term and Medium-term Bullish Factors Continue to Gather Momentum
The core drivers supporting gold price growth remain intact. The Federal Reserve has launched an interest rate cut cycle, and the market widely expects another rate cut at the end of October, with room for further monetary easing ahead. This continues to lower the cost of holding gold, steadily boosting its appeal. Uncertainties in global geopolitics persist, as potential risks in regions like the Middle East and Eastern Europe have not been eliminated. Coupled with weak performance in U.S. economic data, market demand for safe-haven assets remains robust. More importantly, the global central bank gold-buying spree shows no signs of stopping—central banks of China, India, and many other countries continue to increase their gold reserves, providing solid long-term support for gold prices and making a sharp decline highly unlikely.
Short-term Correction Completed, Rebound Signals Emerge
Previously, gold prices pulled back from highs to around $4,080, which has released the profit-taking pressure accumulated from the earlier rally and constitutes a healthy correction. Currently, prices have rebounded to $4,092, indicating strong buying support at lower levels and a pickup in bullish sentiment. On one hand, the negative news from earlier has been gradually digested. On the other hand, investors are starting to gradually enter the market and build positions in advance to capitalize on expectations of the Federal Reserve's rate cut, driving gold prices to edge higher and accumulating momentum for a short-term rebound.
Today's Gold Trading Strategy
xauusd @ buy4070-4080
TP:4110-4130
sl:4050

Gold:The main strategy is to go shortToday the gold rebounded to a high of around 4144.5 before coming under pressure and declining. It then fluctuated after touching a low of around 4070.
Regarding the current market trend, it is recommended to mainly trade based on technical trends: look for opportunities to go short when rebounds are under pressure. After all, the recent pullback and adjustment of the bullish trend have not yet come to a complete end.
As the U.S. government shutdown continues, some important economic data has entered a vacuum period, leading to widespread market speculation. Currently, a series of major news events—including China-U.S. trade relations, geopolitics, and the Federal Reserve's interest rate cuts—are all affecting market sentiment. After gold plummeted sharply at the start of the week and held the 4000 level, the bulls launched repeated counterattacks.
However, the sustainability of this bullish momentum appears weak for now: gold surged to around 4144 in the morning session but came under pressure again, and has now broken below the 4100 level, turning weak in the short term with further downside potential.
For resistance levels, pay attention to the short-term pressure around 4145-4150; for support levels, keep an eye on the short-term support around 4065-4070,At the same time, we must also be wary of Black Friday. If the support level is broken, gold is likely to continue falling to around 4000.
Since gold is under pressure and struggling to break through, the main trading strategy should be to go short when rebounds encounter pressure. Avoid trading in the middle range adopt a "wait and see" approach and refrain from chasing trades impulsively. Instead, wait patiently for key levels to enter positions.
💎Trading Strategy:
Buy 4060 - 4070
SL 4050
TP 4080 - 4100 - 4120
Sell 4100 - 4110
SL 4120
TP 4080 - 4070 - 4060
Daily-updated accurate signals are at your disposal. If you run into any problems while trading, these signals serve as a reliable reference—don’t hesitate to use them! I truly hope they bring you significant assistance

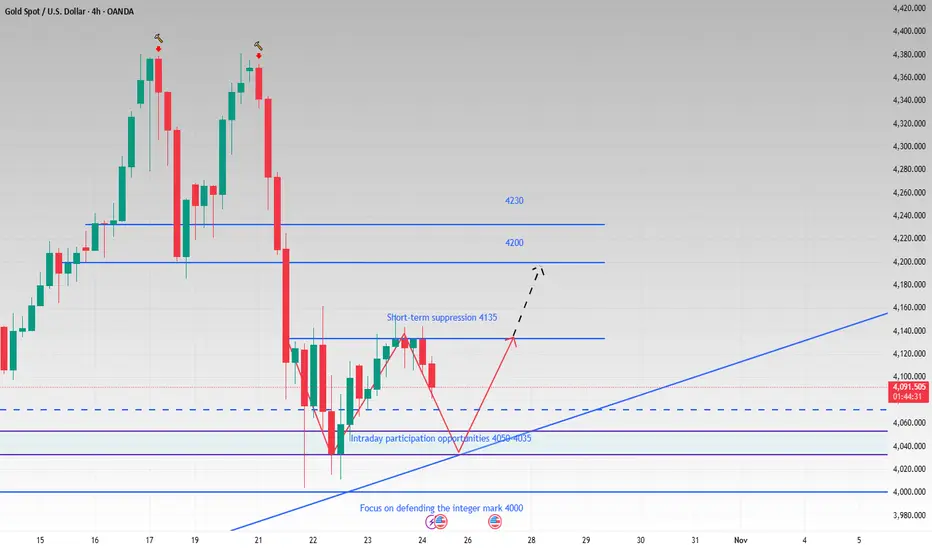
4H see W shape. Support is not broken and it is still bullish.Although gold has experienced a temporary pullback today, we remain bullish as long as the price remains above the upward trend line. While the hourly chart shows a downward trend, with moving averages diverging downward and technical indicators like the MACD forming a death cross, it appears that bears have regained control of the market in the short term.
But from the 4H perspective, if the short-term decline continues and it can effectively rebound after touching the trend line and move out of the W-shaped structure, then gold will be expected to hit the 4135-4145 pressure again, and then gradually hit the 4160, 4200 and other periodic resistance levels until the bulls return. As time goes by, the support points on the short-term trend line are constantly moving up. If it falls back to 4050-4035, try to go long on gold in batches with light positions, and the target is 4090-4130.
OANDA:XAUUSD
Bullish Gold XAUUSD Setup: Breakout, Retest & Trade OpportunityGold is currently bullish and beginning to break market structure 📈. Price is moving toward previous highs, which may act as resistance. Ideally, I’m watching for price to push through these highs, then retest the level for a potential long opportunity ✅.
In the video, I break everything down clearly — including:
📊 Trend direction
🏛 Market structure
💹 Price action
📉 Volume profile analysis
🎯 How to plan the trade step-by-step
⚠️ This is not financial advice — educational purposes only.

XAUUSD 4H Bullish SetupGold shows signs of short-term bullish momentum after forming a double bottom pattern near the lower green EMA ribbon, suggesting selling pressure is fading. The candles are now attempting to close above the short-term EMA cluster, hinting at a potential shift in momentum toward buyers.
Bullish Confluences:
Price has bounced from the lower Fibonacci zone, aligning with previous support around $4,045.
The EMA ribbons are starting to compress, often a precursor to a trend reversal or breakout.
Heikin Ashi candles show smaller wicks to the downside, signaling weakening bearish momentum.
Potential Fibonacci Targets:
Target 1: 4,120 – 4,130 (38.2% Fib retracement / first resistance zone)
Target 2: 4,163 – 4,175 (61.8% Fib retracement / mid EMA ribbon resistance)
Target 3: 4,220 – 4,250 (100% Fib extension / upper channel confluence)
Invalidation:
A 4H candle close below 4,045 would invalidate the bullish setup and suggest continuation of the broader downtrend.

Gold Stuck Near $4,100 Ahead of CPI Market Pulse:
Gold is holding steady around $4,100, caught between uncertainty and opportunity as traders brace for the US CPI release and new developments in US–China trade talks.
The yellow metal has paused its recovery from $4,050 → $4,160, while the US Dollar and bond yields edge higher amid renewed geopolitical tension and surging oil prices.
This is the classic “calm before volatility” moment — the market is simply waiting for data to decide the next wave.
If CPI comes in softer or trade talks disappoint, liquidity could flood back into gold, breaking above 4,155–4,160 and opening the path toward 4,215 → 4,261.
But a strong CPI surprise could flip sentiment fast — dragging price back into the 4,056 and 4,018 buy zones, where the next reaction will decide direction.
📊 Technical Outlook (M30)
Price continues to coil within a tight structure between 4,100 – 4,155, forming a “spring compression” right below trendline resistance.
Market flow suggests accumulation beneath 4,100, hinting that liquidity is building before the next expansion.
Key Structure Zones:
Resistance Pivot: 4,154 – 4,155 → Key breakout level
Breakout Support (CP Zone): 4,056 – 4,060
Liquidity Buy Zone: 4,018 – 4,020
Sell Zone (Fibo Reaction): 4,215 – 4,261
🎯 Trading Plan – MMFLOW Style
🔹 BUY PLAN – Reaccumulation Base
Entry: 4,056 – 4,060
Stop Loss: 4,045
Targets: 4,100 → 4,140 → 4,155
Focus on reaction candles & liquidity grab confirmation.
🔹 BUY PLAN – Liquidity Sweep Setup
Entry: 4,018 – 4,020
Stop Loss: 4,005
Targets: 4,056 → 4,100 → 4,150
If liquidity sweeps this zone clean, watch for a sharp recovery flow.
🧭 Summary – MMFLOW View
Gold is in “decision mode”, waiting for CPI and macro catalysts to trigger the next trend.
The structure stays neutral-bullish as long as price holds above 4,056.
A confirmed breakout above 4,155 may unlock a fast rally toward 4,215–4,260, while a break below 4,018 could open the door for one more liquidity flush.
⚜️ MMFLOW Bias: “No need to predict the move — just follow the flow when liquidity confirms.”
📊 Do you expect gold to break higher after CPI, or trap traders before reversing?
👉 Follow MMFLOW TRADING for daily flow-based setups, structure breakdowns, and institutional insights.

Gold price analysis on March 24XAUUSD – Bears Still in Control
Gold is trading sideways around the key resistance zone of 4145, indicating a strong struggle between buyers and sellers. However, the price has been repeatedly rejected at this zone, indicating that the bearish pressure is still dominant.
If the current trend is maintained, the support zone of 3946 will be the next potential target for the sellers. Only when the price clearly breaks above 4145, the current bearish structure can be broken and the new buying trend is confirmed.
📊 Trading Strategy:
SELL now at 4110
Target: 4022 – 3946
BUY setup: When the price breaks decisively above 4145
