Gold price analysis October 23GOLD UPDATE – Prioritize SELL strategy in the short term
The downward correction of gold continued to extend in yesterday's session, showing that the sellers are still clearly dominant. In the short term, the downtrend may continue, leading the price to lower support zones.
In today's session, the strategy of waiting for SELL following the downtrend is still prioritized. The 4145 zone – the important resistance level of the previous session – will play a key role. If the price cannot overcome this zone and a price rejection signal appears, the possibility of further decline will be reinforced.
Trading strategy:
🔸 SELL trigger when there is a price rejection at the resistance zone of 4145 – 4227
🎯 Target: 3946
Xauusdanalysis

Today's trading strategy for gold is hoped to be helpful to you.Gold Short Trading Strategy Analysis (Current Gold Price: $4,080 per Ounce)
Based on the current market dynamics, gold is in a correction phase following a previous sharp rally. The $4,080 level still has short-term downside potential, presenting an opportunity to go short and capitalize on the short-term adjustment. However, strict risk control is essential. The specific strategy is as follows:
Core Logic for Short Selling
1.Strong Short-Term Correction Demand: Gold has surged from lower levels to a record high above $4,300. The excessively rapid uptrend has led to an "overbought" market, similar to a tightly stretched spring that needs to rebound. It has fallen for three consecutive days recently, with a cumulative drop of nearly 6% in two days, marking the largest single-day decline since April 2013. This correction is a natural "cooling-off" process for the market, and short-term selling pressure has not been fully released yet.
2.Bullish Factors on Hold, Bearish Factors Gaining Momentum: There have been signs of easing in the geopolitical tensions that previously drove up gold prices, as many European countries have expressed support for ceasefire and peace talks, leading to a rapid decline in safe-haven demand. Meanwhile, investors and institutions that profited from the earlier rally are taking the opportunity to sell and lock in profits, further amplifying the downward momentum of gold prices. Although long-term supporting factors remain intact, short-term market sentiment has shifted to cautious.
3.Technical Indicators Signaling a Downtrend: From the price movement perspective, gold has broken below key levels such as $4,100 and $4,200, and the current rebound momentum is very weak. The short-term resistance above is quite prominent; unless the price can rise above $4,160, the correction trend will be hard to reverse, and it is highly likely to continue falling further in the near future.
Today's Gold Trading Strategy
xauusd @sell :4110-4120
pt:4080-4060
sl:4140

Gold: Maintain Bullish Strategy, Target 4180–4220 ZoneYesterday, the market overall remained in a bottom-building phase. There were several intraday rebounds, but each time the price eventually returned near the lows. Compared to recent sessions, the volatility wasn’t extreme, though still relatively large when measured against previous market conditions.
At the moment, the price is approaching the MA20 resistance on the 2-hour chart, with both the structure and indicators leaning bullish. On the 30-minute chart, minor support lies near 4070, with secondary support around 4043, while strong resistance remains in the 4180–4200 and 4250 zones.
The trading strategy remains unchanged — continue to buy in batches near the lows and stay patient while waiting for the price to recover.

Gold: Focus on the 4000 markAfter gold prices recorded a sharp decline on Tuesday, they continued their correction on Wednesday. However, the downward momentum weakened significantly when approaching the 4,000 mark, with no effective break below this level.
The price tested this mark multiple times during the day but stabilized and rebounded each time, indicating that the 4,000 mark has initially formed short-term support. Based on this, today’s focus should be on whether the 4,000 mark can hold: if it remains intact, short-term price action is expected to be a wide-ranging oscillation at higher levels for a correction; if broken, it may open up further downside space.
On Wednesday, gold prices repeatedly tested the 4,010-4,000 range, and candlesticks with long lower wicks were formed each time. This candlestick pattern directly confirms the strong support nature of this range. Today trading should take this range as the core reference: on the premise that the 4,000 mark is not broken and the 4,010-4,000 support range remains intact, it is not advisable to blindly chase short positions at low levels, and short-term rebound risks should be guarded against.
💎Trading Strategy:
@Buy 4010 - 4015
SL 4000
TP 4030 - 4020 - 4070
@Sell 4120 - 4125
SL 4130
TP 4100 - 4080 - 4060
Daily-updated accurate signals are at your disposal. If you run into any problems while trading, these signals serve as a reliable reference—don’t hesitate to use them! I truly hope they bring you significant assistance

Gold Price Outlook – Trade Setup (XAU/USD)📊 Technical Structure
OANDA:XAUUSD Gold extended losses, trading near $4,060–$4,070 after its biggest one-day drop in five years.
Immediate support zone is around $4,060–$4,070, while the resistance zone lies at $4,132–$4,141.
The current chart suggests a potential rebound scenario from support, with upside capped at resistance.
Failure to hold $4,060 could expose the next leg lower toward $4,020–$4,000.
📌 Trade Setup
Entry (Long): $4,070 (near support zone)
Stop Loss: $4,053 (below support)
Take Profit: $4,132 (resistance zone retest)
Risk-to-Reward (R:R): ≈ 1 : 4.26
🌍 Macro Background
Gold remains under heavy pressure after two days of sharp selloff, even as the US Dollar Index (DXY) weakened slightly near 98.80. The move reflects profit-taking following gold’s record rally, while traders are cautious ahead of Friday’s US CPI data (Core CPI expected at 3.1% YoY).
At the same time, Reuters reported that the White House is weighing new export curbs on China’s tech sector, intensifying trade uncertainty. Despite near-term weakness, gold is still up 54% YTD, supported by market bets that the Fed will cut rates by 50 bps at its final two policy meetings this year, with additional easing priced in for 2026.
Thus, while short-term volatility may persist, macro drivers still favor dip-buying strategies.
🔑 Key Technical Levels
Resistance: $4,132 / $4,141
Support: $4,060 / $4,070
Upside Target: $4,132
Downside Risk: $4,020 / $4,000
📋 Trade Summary
Gold is consolidating near $4,060–$4,070 support, with technicals hinting at a short-term rebound opportunity toward $4,132 resistance. However, the broader tone remains cautious ahead of the US CPI release and potential new US-China tech trade restrictions.
⚠️ Disclaimer
This analysis is for reference only and does not constitute trading advice. Trading involves significant risk, and proper risk management is essential.

GOLD Rising Support!
HI,Traders !
#GOLD is trading along
The rising support and is already
making a Local rebound so we are
Locally bullish biased and
We will be expecting a
Further bullish move up !
Comment and subscribe to help us grow !

ElDoradoFx PREMIUM – GOLD ANALYSIS (23/10/2025, ASIA SESSION)Gold (XAUUSD) closed NY around 4,098–4,102 after a constructive rebound from the 4,004–4,024 liquidity shelf. Into Asia, price is coiling just under 4,110–4,113 (intraday high / weak high on 5–15M) with rising short-term MAs beneath (4,083–4,085 cluster), while higher-timeframe EMAs remain overhead on H1/H4. Expect Asia to decide between a continuation leg toward 4,140/4,148 or a controlled pullback into the intraday fib zones before any further move.
⸻
🔍 Technical Outlook
Daily Chart (D1)
• Strong two-day correction off 4,38x followed by attempt to print a rejection tail from 4,00x; macro uptrend still intact above 20/50-DMA.
• RSI cooled to the mid-50s; room either side.
• MACD histogram shrinking but still above baseline → corrective, not trend break.
Bias: Corrective rebound inside a broader bullish trend.
⸻
1H Chart (H1)
• Clear rebound structure: swing L 4,004 → H ~4,113 then consolidation.
• Price is testing a descending trendline and sits below H1 100/200 EMA band ~4,147–4,16x (yellow/white on your chart) → overhead supply remains.
• RSI ~50 with positive slope; MACD turning up from deep negative, confirming recovery but not yet a trend flip.
Intraday Bias: Mildly bullish while 4,083–4,085 holds; watch rejections near 4,113/4,140/4,148.
⸻
15M Chart (M15)
• BOS to the upside from the 4,024–4,030 base; pullbacks bought at 4,096–4,100.
• Current range: 4,096–4,113 with overhead liquidity beacons 4,130 → 4,140.
• MACD green, RSI ~60 → momentum positive but slowing under trendline.
Short-term View: Bullish bias to resistance; pullback likely if 4,113 fails.
⸻
5M Chart (M5)
• Micro down-sloping resistance from the 4,110 peak; price holding above MA cluster 4,083–4,085 and the 5M mid-band ~4,098.
• MACD recently crossed down on 5M (loss of pace), but not yet a structural break.
• A clean 5M close >4,112 typically runs stops to 4,130+.
⸻
✨ Fibonacci Golden Zone
Last confirmed H1 impulse: Low 4,004 → High 4,113
• 38.2% = 4,071
• 50% = 4,058
• 61.8% = 4,046
✅ Golden Zone = 4,058 – 4,046 (prime buy zone)
Confluence: prior NY mid-range, lower channel support, and below the 5M/15M MA cluster (first catch at 4,083–4,071, core at 4,058–4,046).
⸻
🎯 High Probability Scenarios
Bullish Continuation Setup (Preferred if pullback forms)
✅ Buy 4,071–4,058 (scale to 4,046 if swept) on bullish rejection/engulfing.
🎯 Targets → 4,098 (fill) → 4,113 (weak high) → 4,130 → 4,140/4,148
🛑 SL: below 4,040–4,045 (outside 61.8%/structure)
Bullish Breakout Setup (Momentum)
✅ Buy on break & 5–15M retest above 4,113.
🎯 Targets → 4,130 → 4,140 → 4,148 (H1 supply/EMA band)
🛑 SL: back inside 4,103–4,105
⸻
Bearish Correction Setup (Fade resistance)
⚠️ Sell 4,140–4,148 if clear rejection (upper channel / H1 EMA band).
🎯 Targets → 4,113 → 4,098 → 4,083 → 4,071
🛑 SL: above 4,152/4,156
Bearish Breakdown (Continuation lower)
⚠️ Sell below 4,046 (clean break of 61.8% + retest).
🎯 Targets → 4,030 → 4,024 → 4,011 → 4,004
🛑 SL: back above 4,058
⸻
📅 Fundamental Outlook – Asia Session
• No major Asia data on deck; flow-driven session likely.
• Watch DXY drift after NY close; soft DXY favors the pullback-then-buy path.
• Headline risk (Fed speakers later) could cap rallies near 4,14x–4,15x ahead of EU/US hours.
⸻
⚠️ Key Levels to Watch
Resistance: 4,113 (breakout line) / 4,130 / 4,140–4,148 (H1 EMA/supply)
Support: 4,098–4,096 (intraday) / 4,085–4,083 (MA cluster) / 4,071 / 4,058–4,046 (Fib Golden Zone) / 4,024–4,011 / 4,004
⸻
✅ Summary
Asia opens with constructive bullish structure on the intraday, but capped by the H1 EMA/supply overhead. Best-quality long is buying the pullback into 4,071 → 4,058 (core 4,058–4,046 Golden Zone) with confirmation, aiming for 4,113 → 4,130 → 4,140/4,148. If price breaks and holds above 4,113, momentum longs are valid. A hard rejection at 4,140–4,148 or a break below 4,046 shifts bias to corrective sells back into 4,030 → 4,011/4,004.
Break Confirmation:
• Buy above 4,113 (retest)
• Sell below 4,046 (retest)
Golden Zone: 4,058 – 4,046 (with first support catch 4,071)
⸻
🥇 ElDoradoFx PREMIUM 2.0 – PERFORMANCE 22/10/2025 🥇
📊 GOLD TRADE RESULTS:
⚖️ BUY – BE
🟢 BUY +130 pips
🟢 BUY +70 pips
🔻 SELL +220 pips
🔻 SELL +40 pips
🟢 BUY LIMIT +60 pips
⚪️ SELL LIMIT – Deleted (No Entry)
❌ SELL LIMIT –60 pips (SL)
🔻 SELL +40 pips
---
💰 TOTAL GOLD PIPS WON: ✅ +500 pips
📈 RESULT (Executed trades):
8 Active Trades → 6 Wins | 1 SL | 1 BE
🎯 WIN RATE (on active trades): 75%
---
🔥 Consistent upside momentum caught — clean intraday reversals & disciplined exits kept us in control 💎
👏 Congratulations if you profited! ✅✅✅🚀🚀🚀

Gold Analysis for 2026My Idea is A huge Down Trend for Gold in 2026
always take your decision in financial markets

When Everyone Was Hyped, We Warned We called the bearish turn on gold right on time:
After we posted the analysis, gold printed one of its sharpest daily drops in years—momentum the market hadn’t seen in a long time. The core view stands: after brief, counter-trend bounces, the primary path remains down. Revisit the previous analysis; the expectation is continued downside after in-trend corrections.
---------------------------------------------------------------------------------------------
🚀 Who am I?
I'm Mahdi, a prop firm trader with 7+ years of experience in technical analysis, mainly focusing on Smart Money Concepts and Elliott Wave theory.
I specialize in delivering high-quality trading signals, market insights, and educational content tailored for serious traders and investors.
📊 My Tools: SMC, Elliott Wave, Fibonacci, Liquidity Grabs, Order Blocks
💼 Prop Challenge Passed: Yes | Funded Account: In Progress
🔗 Follow for consistent updates and trading insights.

GOLD (XAU/USD) – FINAL GRAND CYCLE ANALYSIS🟡 GOLD (XAU/USD) – FINAL GRAND CYCLE ANALYSIS
“The Rise of Real Money in a Failing Fiat World”
Elliott Waves | Fibonacci | Smart Money | Macro Fundamentals | Market Psychology
📅 Date: October 22, 2025
📍 Current Price: ~$4,039/oz
⏳ Time Horizon: 1970s to post-2050
🎯 Focus: Multi-decade Elliott Wave structure signaling the endgame for fiat currencies
🌐 SUPER CYCLE NARRATIVE – GOLD’S MONETARY METAMORPHOSIS
🔵 Wave I (1971–1980): The Rebirth of Real Money
Gold's first major secular rally began when the Bretton Woods system collapsed and President Nixon ended the U.S. dollar’s convertibility to gold in 1971. Gold soared from around $35 to nearly $875 by 1980. This wave was driven by runaway inflation, the oil embargo, and shattered confidence in fiat money.
🔴 Wave II (1980–1999): The Great Fiat Illusion
Following the 1980 peak, gold entered a brutal 19-year corrective phase, falling to the $250 zone. During this time, the U.S. dollar gained strength, Volcker’s interest rate hikes reined in inflation, and a new era of debt-based prosperity and stock market euphoria unfolded. Gold was dismissed, even by central banks who sold reserves. Structurally, this corrective phase formed a complex WXYXZ pattern , setting the groundwork for the massive Wave III rally.
🟢 Wave III (1999–~2033): The Fiat Reckoning Has Begun
This is the longest and most powerful supercycle wave and the one we are currently in. It is subdivided into five impulsive macro waves. As of now, gold is deep within Wave iii of III , the most explosive phase of the entire structure. The current rally is no longer driven by inflation fears but by existential doubts about the long-term viability of fiat currencies.
📈 Wave I of III (1999–2011): The Institutional Accumulation
Gold rose from around $250 to $1,920 over this period. Triggers included the dot-com bust, 9/11, the 2008 global financial crisis, and the launch of the first gold ETFs like GLD. This wave marked the beginning of institutional interest in gold as a systemic hedge.
📉 Wave II of III (2011–2015): The Disbelief Correction
Gold corrected nearly 45%, bottoming near $1,050. The narrative shifted — QE hadn't caused hyperinflation, the stock market was booming again, and faith in the dollar resurged. Retail abandoned gold, but institutional buyers quietly accumulated from newly created demand zones.
🚀 Wave iii of III (2015–~2026): The True Price Discovery Phase
This is where we are now. Since 2015, gold has exploded upward, driven by COVID-era QE, negative real interest rates, geopolitical instability, and major central banks accumulating gold for cross-border settlements outside the dollar system.
We are currently in the middle of this wave — micro wave (3) of iii — with price around $4,039. According to Fibonacci projections, this wave is expected to peak near $6,552 , corresponding to the 2.618 extension level . If bullish momentum continues, gold could overshoot toward $22,744 , matching the 3.618 Fibonacci extension and marking the likely top of macro Wave III.
In an extreme scenario where fiat trust collapses entirely, the 4.618 extension projects a possible target of $78,940 . All of these levels align with the upper bounds of the long-term logarithmic channel, validating both structure and projections. But most likely this target is for Wave V TOP .
🟣 Wave IV (Projected: 2026–2033): The Great Shakeout
After the parabolic run of Wave iii, a deep multi-year correction is likely. This correction — Wave IV — may retrace toward the long-term red trendline and could coincide with a temporary return to “faith” in fiat through reforms like CBDC rollouts or aggressive fiscal pivots.
This wave could resemble a WXY pattern or large ABC structure and may unfold alongside capital controls, deflationary pressure, and a resurgent tech or dollar narrative. However, this will likely be the last major buying opportunity before gold enters its final, euphoric revaluation.
🟢 Wave V (2033–2045+): The Final Blow-Off Top
Wave V is expected to be driven by an overt crisis of confidence in the global fiat system. Scenarios could include:
Mass adoption of gold-backed or commodity-tied digital currencies
Loss of global trust in the USD as the reserve currency
BRICS or emerging alliances introducing gold into cross-border settlements
Global central banks returning to physical gold as a monetary base
The upside potential here is monumental. The 4.618 Fibonacci extension already targets $78,940 , but under full systemic collapse or monetary reset conditions, gold could reprice toward $100,000–$250,000 per ounce — not as a bubble, but as a return to its role as sound, base-layer money.
📐 Fibonacci Milestones and Structure Alignment
Each major wave has closely respected its corresponding Fibonacci extension. Wave I topped around the 1.618 level ($1,887) . The ongoing Wave iii appears on track to reach the 2.618 level ($6,552) . From there, macro Wave III could stretch toward 3.618 ($22,744) . If Wave V extends fully, a 4.618 projection leads to $78,940 — all within the bounds of the established logarithmic trend channel. In a full-blown systemic reset, price could break even higher.
These levels are not speculative but grounded in structural alignment with Elliott wave geometry , Fibonacci mathematic s, and long-term institutional order flow .
🧠 Smart Money Concepts & Technical Validations
Smart money activity has left clear fingerprints across this cycle. Each break of market structure (in 2016, 2020, and 2023) confirmed higher time-frame bullish continuation. Institutional demand zones — especially during the 2018–2019 consolidation and 2022 pullback — were respected to the dollar.
This cycle isn’t retail-driven mania — it's a stealth institutional accumulation that’s now evolving into price discovery.
📊 Market Psychology Across the Cycle
Investor sentiment has followed classic psychology stages:
From 1999 to 2004, disbelief reigned: “Gold is dead.”
Between 2005 and 2011 came growing awareness: “Gold might work again.”
The 2011–2015 correction brought denial: “It was just a bubble.”
Hope returned in 2016–2020 as price quietly rallied.
From 2022 to 2026, euphoria dominates: “Gold will never go down.”
Wave IV will likely bring fear and capitulation between 2026 and 2033.
Finally, Wave V will ignite mania: “Gold to the moon!”
🚨 Final Synthesis: What This All Means
We are living through the largest repricing of monetary value in modern financial history. Gold is no longer just an inflation hedge — it’s becoming a hedge against the system itself . The structure on the chart doesn't just map price — it maps the collapse of fiat trust and the return of monetary sanity.
Gold is transitioning from:
A commodity hedge →
To a central bank hedge →
To a currency hedge →
And finally, to a system hedge
The current leg — Wave iii of III — is nearing its climax. After a correction in Wave IV, Wave V could take gold into previously unthinkable territory, not because gold changed — but because everything else did.
📌 Final Position Summary
We are currently in wave (5) of iii of III — the most powerful segment of the bull run
The next Fibonacci target is $6,552
The broader Wave III could peak near $22,744
After a correction (Wave IV), the final wave could send gold toward $78,940 , or even into the $100,000–$250,000 zone under extreme monetary reset conditions
This is not a mere forecast — it’s a macro-monetary blueprint for the coming decades.
🌊 "Those who understand the waves will ride them. Those who don’t will be swallowed by the tide." – FIBCOS
📘 Disclaimer: This is an educational market outlook based on technical and macroeconomic structure. It is not financial advice. Always do your own due diligence and risk management.
#XAUUSD #Gold #GoldAnalysis #ElliottWave #Fibonacci #SmartMoneyConcepts #PriceAction #TechnicalAnalysis #MarketStructure #Commodities #InflationHedge #MacroEconomics #CentralBanks #BRICS #MonetaryReset

XAUUSD : What is the expected reversal point for XAU/USD?hi everyone
The drop in gold indicates profit-taking. This can be observed as other XXX/USD pairs continue to move normally. After forming a double top, the decline has now reached around the 0.618 Fibonacci level. I’m more interested in the 0.786 level, which is around 3961.89 or 3818.06
good luck all
**My trading strategy is not intended to be a signal. It's a process of learning about market structure and sharpening my trading my skills also for my trade journal**
Thanks a lot for your support

ElDoradoFx PREMIUM – GOLD ANALYSIS (22/10/2025, US SESSION)Gold (XAUUSD) is currently trading around 4,025, showing bearish continuation after failing to hold earlier London recovery attempts. Price was rejected strongly near the 4,114–4,125 supply zone, leading to a fresh break lower. The pair is now sitting above the 4,004–4,011 liquidity zone, which is a critical decision area for US volume—either to fuel another push lower or trigger a corrective bounce before continuation.
⸻
🔍 Technical Outlook
Daily Chart (D1)
• Gold continues its bearish corrective phase after multiple failed attempts to reclaim 4,381.
• Today’s candle is currently bearish, pressing toward yesterday’s lower wick region around 4,004.
• RSI has shifted downward from prior strength, signaling momentum loss from buyers.
• MACD histogram fading, indicating continued corrective pressure within macro uptrend.
Bias: Bearish corrective continuation unless 4,125 is reclaimed.
⸻
1H Chart (H1)
• Structure is clearly bearish with repeated lower highs from 4,254 → 4,170 → 4,125.
• Current price consolidating near lower support, testing the 4,004–4,011 reaction zone.
• RSI around 35 → bearish with potential for short-term relief bounce.
• EMA stack remains bearish, with 20 EMA and 50 EMA acting as resistance zones near 4,060.
Intraday Bias: Bearish; expecting either rejection on pullback or continuation through 4,004.
⸻
15M Chart (M15)
• Minor bounce attempts observed at 4,011, but structure remains lower high/lower low.
• MACD flattening, indicating possible pullback into premium areas for better sell entries.
• Price currently trapped between intraday minor support (4,011) and resistance (4,037–4,051).
Short-term View: Bearish with potential for short retracement toward resistance before next move.
⸻
5M Chart (M5)
• A small CHoCH occurred after liquidity tap at 4,011, but not enough to shift higher timeframe bias.
• RSI and MACD turning mildly bullish —early recovery anticipation, but only corrective unless key levels flip.
⸻
✨ Fibonacci Golden Zone
Recent impulse leg: High 4,125 → Low 4,011
🔹 38.2% Fib = 4,037
🔹 50% Fib = 4,048
🔹 61.8% Fib = 4,060
✅ Golden Zone = 4,037–4,060, aligning with EMA resistance and prior sell rejection zone.
➡ This is the preferred sell zone if price retraces during the US session.
⸻
🎯 High Probability Scenarios
✅ Bearish Continuation Setup (Preferred)
📍 Sell Zone: 4,037–4,060 (Golden Zone / EMA rejection)
✅ Trigger: Bearish engulfing / rejection wick from zone
🎯 Targets → 4,020 → 4,011 → 4,004 → 3,980
🛑 SL above 4,070
📉 Breakout Sell (Momentum play)
📍 Sell below 4,004 (Break & Retest)
🎯 Targets → 3,980 → 3,960 → 3,940
🛑 SL above 4,020
🟢 Bullish Countertrend Setup (Low probability unless reversal pattern appears)
📍 Buy at 4,004–4,011 (only with strong bullish engulfing + MACD shift)
🎯 Targets → 4,037 → 4,060
🛑 SL below 3,995
⚠ Bullish Breakout Buy (Only if structure flips)
📍 Buy above 4,070 (Break & Retest + H1 structure shift)
🎯 Targets → 4,095 → 4,114
🛑 SL below 4,060
⸻
📅 Fundamental Outlook – US Session
• US session may bring increased volatility, especially around labor market sentiment or Fed expectations.
• DXY remains firm, maintaining pressure on gold.
• If yields climb further, downside continuation is favored.
• If DXY retraces, a relief bounce into Golden Zone may occur before next sell wave.
⸻
⚠ Key Levels to Watch
Type Level Description
Resistance 4,037 / 4,048 Fib 38.2%–50%
Resistance 4,060 Fib 61.8% / EMA confluence
Resistance 4,070 / 4,114 Full structure invalidation
Support 4,011 Minor liquidity bounce
Support 4,004 Key psychological support
Support 3,980 Breakdown target
⸻
✅ Summary
Gold is in a bearish continuation phase, with price consolidating near support before the next move. The Golden Zone at 4,037–4,060 is crucial — rejection here favors selling back into lows. A clean break below 4,004 triggers further downside. Only a strong reclaim above 4,070 would shift sentiment toward bullish recovery.
Session Bias: Bearish – favor selling rallies.
Break Confirmation:
• ✅ Sell below 4,004
• ⚠ Buy only above 4,070
Golden Zone: 4,037 – 4,060

XAUUSD is going downGold (XAUUSD) is showing signs of potential downside continuation after a sharp rejection from recent highs. The daily candle formed a long upper wick and closed below the midline of the green band — indicating profit-taking and emerging selling pressure.
Bearish Influences
Rejection Candle: Strong upper wick signals sellers defending resistance near the 4,180–4,200 zone.
Loss of Momentum: Price slipped below the short-term support band, suggesting weakening bullish control.
EMA / Structure Confluence: The current pullback aligns with the lower trendline slope and prior breakout structure — a likely retracement phase forming.
🎯 Fibonacci Bearish Targets
If price fails to reclaim the 4,180 level and bearish momentum persists, look for these downside targets:
Target 1 (0.382 Fib) → $4,047 – $4,050
Minor support and initial retracement level.
Target 2 (0.618 Fib) → $3,943 – $3,950
Key Fibonacci confluence and previous structure support zone.
Target 3 (1.000 Fib) → $3,814 – $3,820
Full retracement target aligning with the lower green volatility band — potential swing low zone.

GoldXAUUSD
- Change of Characteristics
- Strong Bullish Trend Line
- Completed " 12345 " Impulsive Waves and " ABC " Corrective Waves
- Order Block
- RSI - Divergence

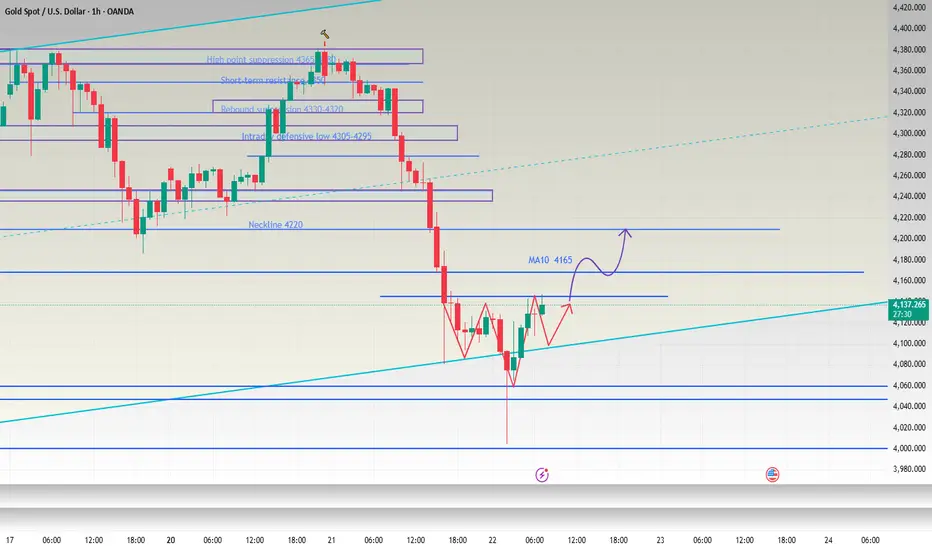
Look for a volatile upward correction of 4200-4220Good morning, bros. Although the market did not provide us with suitable trading opportunities last night, this did not prevent the market from confirming Allen's advanced trading vision. Even if the long orders at 4060-4050 were stopped out, the gold price still fell back to around 4000 as expected. Continuing to go long can not only turn losses into profits in one fell swoop, but also ensure substantial profits. how is it? Although we were unable to participate in this transaction, the final trend and results always prove the high accuracy of Allen's advanced trading vision and strategic analysis.
As the candle chart closed with a long lower shadow that was nearly twice the length of the body, the short-term bottom was found near 4000. Therefore, I believe that gold may be in a state of volatile upward repair today. After a rapid decline and rebound this morning, the current price is once again around 4120-4130. Judging from the hourly chart, there is a rudimentary form of a head and shoulders bottom pattern in the short term. If the gold price retreats again, thus prompting the formation of a head and shoulders bottom pattern, then when the gold price falls back to around 4105-4095, we can also try to go long on gold with a light position. If gold continues to rise, we will pay attention to the performance of 4160-4170 above, which is both a short-term resistance and the daily MA10 moving average. If the bulls want to return to the market, they must first stand firm on the MA10 moving average to have greater hope. Therefore, this resistance range is also the focus of our short-term attention. Once it stabilizes above the MA10 moving average, gold will be expected to rebound to 4200-4220.
OANDA:XAUUSD
COULD GOLD (XAU/USD) BOUNCE TO THE UPSIDE OR DROP?GOLD (XAUUSD) is currently being held by a strong support trend line which is is struggling to breakthrough.. however, it is currently in a new downtrend and could continue to fall to the downside.
If The support trendline has been broken, this will be a great sell opportunity.. if it struggles to break, then it will be a great buy opportunity. Keep an eye!

Double Top Confirmed! Is Gold About to Fall Deeper?As expected from my previous idea , Gold touched its target of $4,183 ( the double top pattern’s target(Small) ). Before reaching that target, it had some ups and downs over the past few days, mainly due to the ongoing US-China tensions .
Gold is trading near a Support zone($4,193 – $4,156) .
From a classical technical analysis perspective, it’s forming a clear double top pattern on the 1-hour timeframe . There’s also a regular bearish divergence (RD-) visible between the two peaks of the double top.
From an Elliott Wave theory standpoint, it looks like Gold has started its corrective wave. If the Support zone($4,193 – $4,156) and the double top pattern’s neckline break , we can expect further downside .
I expect that after breaking the Support zone($4,193 – $4,156) and the neckline , Gold could drop at least to around $4,083(First Target) .
Second Target: $4,057
Stop Loss(SL): $4,385(Worst)
Note: Keep in mind that given the ongoing US-China tensions, any news could invalidate this analysis. So it’s more important than ever to manage your risk carefully these days.
Please respect each other's ideas and express them politely if you agree or disagree.
Gold Analyze (XAUUSD), 1-hour time frame.
Be sure to follow the updated ideas.
Do not forget to put a Stop loss for your positions (For every position you want to open).
Please follow your strategy; this is just my idea, and I will gladly see your ideas in this post.
Please do not forget the ✅ ' like ' ✅ button 🙏😊 & Share it with your friends; thanks, and Trade safe.

Gold 1979 vs 2025 — When History Whispers and Markets Listen
🌕 1. The Echo of 1979
In 1979, the world watched Gold do the impossible. The metal surged from $226 to over $850 per ounce in less than a year, a 275% explosion that turned fear into fortune.
The triggers were seismic.
🇮🇷 The Iranian Revolution disrupted global oil flows.
🏛️ The U.S. Embassy hostage crisis fueled geopolitical panic.
⚔️ The Soviet invasion of Afghanistan reignited Cold War fears.
💸 And double-digit inflation in the U.S. shredded faith in the dollar.
By early 1980, panic replaced logic. Every newspaper screamed, “Buy Gold before it’s too late!” Then came Paul Volcker’s shock therapy as interest rates jumped above 15% and COMEX doubled margin requirements. Within eight weeks, Gold fell more than 40%, marking the end of one of the most dramatic speculative manias in modern history.
🔁 2. Fast-Forward to 2025: The Parallels Are Uncanny
The world of 2025 looks hauntingly similar.
🕰️ 1979 🔮 2025
Iranian Revolution and Cold War tensions Gaza war, U.S.–China decoupling, and regional instability
Oil shock and inflation Energy disruptions and persistent post-pandemic inflation
Dollar under pressure Record U.S. debt and fiscal erosion
Panic buying of Gold Central bank accumulation and retail FOMO
Fed under Volcker turns hawkish Fed under Powell trapped between cuts and control
By late August 2025, gold sat quietly near $3,415, then erupted into a seven-week vertical rally above $4,300, a mirror image of 1979’s euphoric climb. But just like back then, euphoria was the prelude to exhaustion.
⚠️ 3. The Anatomy of the Current Crash
On October 17, 2025, Gold plunged $250 in one day, a shocking 5–6% drop that broke its parabolic structure and sent fear rippling across markets.
What triggered it?
🏦 A hawkish shift in the Federal Reserve’s language as officials hinted rate cuts might be delayed.
💰 Real yields surged, breaking the inverse correlation that had fueled gold’s climb.
🏛️ Institutional profit-taking hit record levels, confirmed by rising COMEX open interest and volume.
🗞️ Sentiment flipped overnight as headlines shifted from “Gold to $5000” to “Gold crashes $250.”
The move marked the first true break of structure (CHoCH) since the rally began, historically the signal that smart money is quietly exiting.
🔍 4. Lessons from 1980 — The Signs of a Top
Before gold crashed in 1980, five clear warning signs appeared.
⚙️ 1979–1980 Signal 💡 2025 Equivalent 🧭 Status
Fed turns hawkish Powell signals “pause / higher for longer” ⚠️ Emerging
Rising bond yields vs. flat Gold Real yield divergence ✅ Confirmed
Parabolic candles Daily range above $100 ✅ Seen
Media frenzy “Gold to $5000” hype ✅ Seen
Margin hikes and record OI Record COMEX participation ⚠️ Rising
Four out of five signals are already flashing. History teaches that when everyone believes Gold can only rise, it’s often about to fall.
🧭 5. What Smart Traders Should Do Now
🟡 Phase 1 – Immediate Protection (Next 24 Hours)
If you’re long, secure 50–75% of gains and protect above $3,950.
If you’re short, trail stops to $4,200 and look for targets at $3,950 → $3,800 → $3,600.
If you’re flat, stay patient and wait for at least two daily candles of stabilization before acting.
🟠 Phase 2 – Stabilization (Next 3–5 Days)
Watch for:
🕯️ Long lower wicks on daily candles show buyer absorption.
📉 Shrinking COMEX volume indicates exhaustion of sellers.
📊 Flat or falling real yields confirming support.
🔵 Phase 3 – Re-evaluation (Next 1–2 Weeks)
If gold reclaims $4,000+ with strength and Fed tone softens, a controlled re-rally may begin. If Gold stays below $3,800, the correction likely extends toward $3,500, the same 30–40% retracement seen in 1980.
🧘♀️ 6. Beyond the Chart — Discipline Over Drama
When a $250 candle appears, instincts scream, “Do something!” But professionals know the truth: reaction destroys capital, observation preserves it. The coming days are not about prediction but about posture. Stay liquid, track sentiment, watch real yields, and remember that even in 1980, Gold’s crash didn’t end its story — it simply reset the cycle for the next era of accumulation.
✨ History doesn’t repeat, but it rhymes. In 1979, Gold taught us that fear creates bubbles. In 2025, it’s reminding us that even truth needs a pullback before it shines again.
If this article helped you today and brought you more clarity:
Drop a 🚀 and follow us✅ for more trading ideas and trading psychology. Thank you.

gold on short reverse#XAUUSD price have been trading between price correction and continuation, now we await for 2 times breakout above 4034 to sell.
2 times breakout at 4034 sell, target 3998, stop loss 4050.
Below the 3998 holds bullish reverse which will target 4070.

Elliott Wave Analysis – XAUUSD (October 22, 2025)
🔹 1. Momentum
D1:
The D1 momentum is preparing to turn bullish, signaling the start of a new upward trend.
→ We can expect at least 3–5 consecutive bullish days ahead.
H4:
We need to wait for the H4 candle to close to confirm the reversal signal.
If confirmed, there’s a strong possibility that today will form an intraday uptrend.
H1:
H1 momentum has already turned upward, but it’s now in the overbought zone.
Therefore, the current rise won’t be strong, and a minor pullback is needed to bring momentum back to the oversold area — creating a foundation for a more stable bullish move.
________________________________________
🔹 2. Wave Structure
D1 Timeframe:
Yesterday saw a sharp decline, but D1 momentum is now preparing to reverse upward.
Counting the correction candles, we already have five candles, suggesting that the market may soon enter a new bullish phase lasting 3–5 days or more.
During this recovery phase, we need to monitor two key scenarios:
• If wave movements overlap and lack strength, and when D1 momentum returns to the overbought zone but price fails to break the previous high, then the Wave 4 (yellow) scenario is still in play.
• If price rises sharply and decisively, the recent correction might only be part of Wave 3 (yellow), meaning the bullish trend is continuing.
H4 Timeframe:
Yesterday’s structure was identified as a Flat correction, and it remains valid.
Price has retraced into the Wave 4 zone of the smaller degree structure, reaching the 2.0 Fibonacci extension of Wave A.
If Wave 5 (purple) is now developing, the ideal target would be around 4476.
However, if price rises with overlapping waves, this could instead represent a corrective move within Wave 4 (yellow), targeting the previous high zone between 4381 and 4476.
H1 Timeframe:
Within Wave W, there is a small Flat correction, where Wave C extended to twice the length of Wave A.
Now, Wave Y (blue) has also declined to 2× Wave W, suggesting weakening buying power.
Even so, in the short term, we still expect an intraday bullish move today.
→ The trading bias remains buy-side until H4 momentum reaches the overbought area and reverses.
________________________________________
🔹 3. Trading Plan
Buy Zone: 4101 – 4098
Stop Loss (SL): 4088
Take Profit 1 (TP1): 4190
________________________________________
🔹 4. Notes
Liquidity and resistance zones are already marked on the chart.
→ Wait for price to break and retest those areas to confirm a valid Buy setup.

Gold: The M-top pattern indicates a downward risk📈Gold’s situation today is quite complex, marked by sharp volatility. Looking at the price trend, after a rare steep drop the previous night, the Gold continued to slide following today’s opening, touching a low of 4004.5. It then staged a short-term rebound of over $100, fluctuating around 4100 and peaking at 4161.It then continued to decline.
📝In terms of influencing factors:
The cooling of safe-haven sentiment is one of the key reasons for Gold’s decline. Europe’s support for Russia-Ukraine ceasefire negotiations, the expected resolution of the U.S. government shutdown crisis, and the easing of Sino-U.S. trade tensions have all led to a significant drop in market demand for safe-haven assets.
📈Gold had risen too sharply in the earlier stage, fueling strong sentiment among investors to take profits at high levels. A large number of sell orders pushed its price down sharply.
Additionally, the strengthening of the U.S. dollar during the day has also exerted certain pressure on gold prices.
📝From a technical perspective:
The Gold closed with a long bearish candlestick on the daily chart, accompanied by a simple M-top formation. This indicates the risk of the market continuing to move downward. The upper resistance zone is between 4150 and 4180, the key lower support level is at the 4000 integer mark, and further downside support lies between 3900 and 3904.
💎Trading Strategy:
Buy 4075 - 4085
SL 4060
TP 4115 - 4125 - 4135
Sell 4150 - 4160
SL 4175
TP 4085 - 4100 - 4115
Daily-updated accurate signals are at your disposal. If you run into any problems while trading, these signals serve as a reliable reference—don’t hesitate to use them! I truly hope they bring you significant assistance

$4,381 WAS THE FAKE TOP? Gold -5.5%: MSS Confirms SELL!XAU/USD In-Depth Analysis: Historic Shock and Structure-Based Selling Opportunity!
1. Fundamental Shock Analysis
Gold's massive 5.5% plunge from its record high of $4,381 was a large-scale profit-taking action following a blistering 60% year-to-date rally. This move was fueled by:
USD Strength: The strengthening US Dollar reduced Gold's appeal.
Market Sentiment: A shift into Risk-On mode, diminishing safe-haven demand.
The Essence: This was a huge Liquidity Sweep, designed to wash out weaker hands before Gold decides its next major trend.
2. Technical Analysis (MSS & Execution)
The price structure has delivered a decisive message: The trend has changed!
MSS Confirmed (Market Structure Shift): The break of the bullish structure occurred at $4,254.549. This level is now a highly critical Supply Zone, acting as the "boundary" for the bears.
Demand Reaction: Gold is currently attempting to hold the Order Block (OB) at $4,077.
Preferred Strategy: SELL based on the confirmed MSS.
Optimal SELL Zone: Wait for a retracement back to the Supply Zone $4,254.549 (Ideal limit entry).
Target (TP): Successive targets are $4,008 (The psychological $4k mark) and the strong support area at $3,944 - $3,904.
Stop Loss (SL): Place above the high at $4,260 (Protecting the MSS point).
Conclusion: Don't be fooled by the bounce. $4,254.549 is the golden entry point for a short trade following the new market structure.
#GOLD #XAUUSD #MSS #Liquidity #SELLSignal #SmartMoneyConcept

XAU/USD 22 October 2025 Intraday AnalysisH4 Analysis:
-> Swing: Bullish.
-> Internal: Bullish.
Analysis and bias remains the same as analysis dated 20 October 2025.
Price has printed as per previous intraday expectation by printing a bearish CHoCH which indicates, but not confirms, bullish pullback phase initiation.
Price is currently trading within an established internal range, however, I will continue to monitor price with regards to depth of pullback.
Intraday expectation:
Price to continue bearish, react at either discount of 50% internal EQ, or H4 supply zone before targeting weak internal high priced at 4,380. 990.
Note:
The Federal Reserve’s sustained dovish stance, coupled with ongoing geopolitical uncertainties, is likely to prolong heightened volatility in the gold market. Given this elevated risk environment, traders should exercise caution and recalibrate risk management strategies to navigate potential price fluctuations effectively.
Additionally, gold pricing remains sensitive to broader macroeconomic developments, including policy decisions under President Trump. Shifts in geopolitical strategy and economic directives could further amplify uncertainty, contributing to market repricing dynamics.
H4 Chart:
M15 Analysis:
-> Swing: Bullish.
-> Internal: Bearish.
Price has printed according to my analysis dated 20 October 2025 where I mention that price is to continue bullish, react at either premium of 50% internal EQ, or M15 demand zone, before targeting weak internal low priced at 4,185.910.
Price has printed a bearish iBOS and subsequently a bullish CHoCH to indicate, but not confirm bullish pullback phase initiation.
Price is now trading within an established internal range.
Intraday expectation:
Price to react at either premium of 50% internal EQ, or M15 demand zone, before targeting weak internal low priced at 4,004.280.
Note:
Gold remains highly volatile amid the Federal Reserve's continued dovish stance, persistent and escalating geopolitical uncertainties. Traders should implement robust risk management strategies and remain vigilant, as price swings may become more pronounced in this elevated volatility environment.
Additionally, President Trump’s tariff announcements, particularly against China, are expected to further amplify market turbulence, potentially triggering sharp price fluctuations and whipsaws.
M15 Chart:
