gold on reverse#XAUUSD we wait price on M15 closure above 4265 to buy.
Entry 4265 M15 closure short target 4278, second target 4302 and last 4320. Stop loss 4250
Below the 4246 on one time breakout will drop the pair till 4206 limit.
4278 holds reverse but breakout above 4283 will continue bullish.
Xauusdanalysis

XAU/USD Intraday Plan | Support & Resistance to WatchGold attempted another run-up yesterday but failed to sustain momentum, leading to a renewed pullback this session. Price is currently trading around 4259, slipping below the MA50 as short-term momentum softens after repeated rejections from the 4362 resistance zone.
Despite the rejection the broader trend remains bullish above the MA200, though short-term momentum has clearly weakened. If buyers manage to reclaim 4321, gold could reattempt the upside toward 4362 and 4406.
However, a break below 4,279 would expose the First Reaction Zone (4,227–4,192), where buyers will likely defend to maintain trend structure. A deeper breakdown beneath this area could open the way toward 4,151–4,117 near the MA200.
📌 Key levels to watch:
Resistance:
4321
4362
4406
Support:
4279
4227
4192
4151
4117
🔎 Fundamental focus:
The U.S. government shutdown continues to pressure risk sentiment, with political negotiations showing little progress. Several key data releases this week, including PMI and durable goods orders, remain uncertain due to the data blackout, adding to market caution.

Gold 1H – Can Gold Hold Above 4247 as Powell Takes the Stage?XAUUSD – Intraday Trading Plan | by Ryan_TitanTrader
📈 Market Context
Gold holds firm near $4,230, with traders cautiously awaiting U.S. Retail Sales data and Fed Chair Powell’s remarks later today.
After a series of softer inflation reports, market sentiment has tilted mildly dovish — yet the U.S. dollar remains steady as investors hesitate to price in early rate cuts.
The Fed’s tone today will be critical: a hawkish Powell could trigger short-term profit-taking on gold, while any dovish signals may reignite safe-haven bids.
Expect choppy intraday movement with liquidity sweeps around key zones before a confirmed directional move emerges.
🔎 Technical Analysis (1H / SMC Style)
• The structure remains bullish, confirmed by previous Breaks of Structure (BOS) and a Change of Character (ChoCH) earlier in the week.
• Price is now approaching a premium supply zone at 4247–4249, where potential short-term sell reactions could appear before retracement.
• Below, the discount demand zone at 4184–4186 aligns with prior BOS support and acts as a high-probability reaccumulation area.
• If price revisits the buy zone and forms bullish confirmation on M15, continuation toward new highs around 4260+ is favored.
🔴 Sell Setup: 4247 – 4249
SL: 4255 – 4257
TP targets: 4210 → 4195
🟢 Buy Setup: 4184 – 4186
SL: 4174
TP targets: 4210 → 4245 → 4260+
⚠️ Risk Management Tips
• Wait for M15 BOS/ChoCH confirmation before executing either setup.
• Watch for volatility spikes around Powell’s speech and U.S. Retail Sales release — spreads may widen.
• Consider partial profits at intra-day liquidity points and trail stops once structure confirms.
✅ Summary
XAUUSD maintains its bullish structure but may face a liquidity sweep above 4247–4249 before a deeper retracement into 4184–4186.
Institutional activity could drive accumulation near the discount zone if macro data supports dovish sentiment.
The intraday bias remains “Buy the Dip”, with tactical sells possible at premium resistance for short-term scalps.

Gold 1H – Slight Correction or Bullish Reaccumulation Ahead?XAUUSD – Intraday Trading Plan | by Ryan_TitanTrader
📈 Market Context
Gold extends its rebound near $4 250 as traders weigh the recent uptick in U.S. Treasury yields against growing expectations of a softer Federal Reserve stance.
After the latest mixed U.S. economic data, markets are leaning toward a mildly dovish outlook — rate-cut bets for early 2026 are gaining traction, while the dollar remains steady.
Today’s focus centers on U.S. housing-starts and jobless-claims data, which could steer short-term volatility.
A stronger-than-expected report may trigger temporary selling pressure on gold, while weaker figures could revive safe-haven demand and extend the rally toward $4 380 +.
Expect liquidity hunts before any clear directional move, as institutional players refine positions near the week’s range extremes.
🔎 Technical Analysis (1H / SMC Style)
• Market structure remains bullish, with previous Breaks of Structure (BOS) confirming continuation after the earlier accumulation phase.
• A short-term Change of Character (ChoCH) signals corrective movement — likely a liquidity sweep before the next bullish leg.
• Liquidity resting below $4 200 has already been taken, aligning with the discount zone around $4 196 – $4 198.
• A potential re-accumulation is forming; buyers may look for confirmation (M15 BOS/ChoCH) inside this demand zone.
• Upside liquidity targets cluster near $4 375 – $4 380, coinciding with a premium supply zone where sellers might re-enter.
🔴 Sell Setup
Entry: 4378 – 4376
Stop-Loss: 4386
Take-Profit Targets: 4325 → 4260
🟢 Buy Setup
Entry: 4196 – 4198
Stop-Loss: 4190
Take-Profit Targets: 4250 → 4370 → 4380 +
⚠️ Risk Management Tips
• Wait for lower-timeframe BOS/ChoCH confirmation before execution.
• Be cautious around U.S. macro data releases — spreads and volatility can widen temporarily.
• Use partial take-profits at nearby liquidity zones and trail stops once market structure confirms continuation.
✅ Summary
Gold maintains its bullish bias above $4 200 after sweeping liquidity.
A short-term correction could retest $4 196 – $4 198 for fresh buy entries, while the broader trend remains upward.
Only a clean structural break below $4 190 would invalidate the bullish continuation scenario.
FOLLOW RYAN FOR MORE USEFUL TRADING IDEAS!!!

GOLD HIGH PROBABILITY SETUP SOON!!!🚨 XAUUSD HIGH PROBABILITY BUY SETUP 🚨
* Here We Can See Clearly The Next Potential Moves For GOLD Coming Hours.
* Keep Your Eyes Close On Your Trading Positions.
* Happy PIP Hunting Traders.
FXKILLA.

Gold is trending, focusing on the 4300-4320 range.On Tuesday, the early Asian session began to confirm resistance at 4375-4372, before rebounding and finding resistance at 4355. From here, a sweeping decline began, with the final acceleration occurring at 4344. We had already entered a short position in the 4340-4337 area. The price then experienced a $100 decline, accelerating to the 4244 area.
The price fell from 4375 to 4244, marking another significant decline, and the European session saw a sharp drop of nearly $100.
Watch the following trends in the short term:
The dual-line channel corresponds to 4260, then 4295-44300, and finally 4302. The price broke below the upper limit of the 1-hour chart at 4268. After confirming support at 4220 in the European session on Monday, the price began to rise. However, it has currently broken down. If the US market continues to experience resistance, there is room for further decline in the short term.
The first resistance area is 4280-4285, and the second resistance area is around 4300-4320. If the price breaks above 4325, pause shorting and wait for resistance to enter.
The price just rebounded to around 4278, but is now under pressure below 4280 and continuing to decline. In the short term, monitor the rebound's strength and wait for the next resistance level before considering shorting.
The support level is around 4245, followed by 4225.
I will post more real-time strategies in the channel, so stay tuned.

XAUUSD – Bearish Scenario ActivatedXAUUSD – Bearish Scenario Activated: watch for sell retest at 4,303–4,305, deep buy at 4,208–4,210 🟡
Gold just hit a historical peak of 4,381, but the subsequent sharp drop opens up the risk of a short-term correction. On H1, the price is blocked by a descending trendline and the sell zone cluster at 4,30x; below are liquidity zones and the bottom trendline waiting to be retested.
Quick chart insights
Structure shifts to a descending triangle pullback after breaking the upward momentum.
Sell zone 4,303–4,305 coincides with the descending trendline + heavy volume (VP).
Below 4,26x is Liquidity Buy; deeper lies the 4,208–4,210 mark near FE 4.236 and the trendline base — the final “shakeout” zone before recovery.
Trading Plan (if–then)
Sell retest (priority in weak rebound)
Entry: 4,305–4,303
SL: 4,310
TP: 4,287 → 4,260 → 4,242 → 4,220
Condition: rebound to 4,30x and the appearance of a rejection/engulfing candle on H1 below the descending trendline.
Deep buy (liquidity sweep + rebound)
Entry: 4,210–4,208
SL: 4,204
TP: 4,225 → 4,242 → 4,270 → 4,298
Condition: deep shakeout to 4,21x, appearance of pin bar/absorbing volume at the bottom trendline.
Invalidation
Sell scenario invalidated if H1 closes above 4,310.
Buy scenario invalidated if H1 closes below 4,204 (risk of deeper trendline range).
Key Levels to Watch (easy on mobile)
Resistance: 4,303–4,305 • 4,320–4,325 (descending trendline)
Support: 4,260–4,255 • 4,242 • 4,210–4,208 • 4,200
Expected move: rebound to 4,30x → sell down to 4,26x/4,24x; sweep 4,21x → rebound to 4,27x–4,29x.
Quick Context (macro)
Expectations of Fed rate cuts + geopolitical risks keep the major trend upward, but after ATH, there’s often a short-term sell-off to rebalance positions.
Monitor USD/yield fluctuations: a strong USD will support the sell retest scenario; a cooling USD creates opportunities for a rebound from buy zones.

XAUUSD Analysis todayHello traders, this is a complete multiple timeframe analysis of this pair. We see could find significant trading opportunities as per analysis upon price action confirmation we may take this trade. Smash the like button if you find value in this analysis and drop a comment if you have any questions or let me know which pair to cover in my next analysis.

XAU/USD 21 October 2025 Intraday AnalysisH4 Analysis:
-> Swing: Bullish.
-> Internal: Bullish.
Analysis and bias remains the same as yesterday's analysis dated 20 October 2025.
Price has printed as per previous intraday expectation by printing a bearish CHoCH which indicates, but not confirms, bullish pullback phase initiation.
Price is currently trading within an established internal range, however, I will continue to monitor price with regards to depth of pullback.
Intraday expectation:
Price to continue bearish, react at either discount of 50% internal EQ, or H4 supply zone before targeting weak internal high priced at 4,380. 990.
Note:
The Federal Reserve’s sustained dovish stance, coupled with ongoing geopolitical uncertainties, is likely to prolong heightened volatility in the gold market. Given this elevated risk environment, traders should exercise caution and recalibrate risk management strategies to navigate potential price fluctuations effectively.
Additionally, gold pricing remains sensitive to broader macroeconomic developments, including policy decisions under President Trump. Shifts in geopolitical strategy and economic directives could further amplify uncertainty, contributing to market repricing dynamics.
H4 Chart:
M15 Analysis:
-> Swing: Bullish.
-> Internal: Bearish.
Analysis and bias remains the same as yesterday's analysis dated 20 October 2025.
I have been mentioning in my alternative scenario for almost 1-month that all higher timeframes are requiring a pullback, and we are seeing a narrowing of internal structure, price could target strong internal low. This is how price printed.
Price has printed a bearish iBOS after a very long duration and subsequently a bullish CHoCH to indicate, but not confirm bullish pullback phase initiation.
The bearish iBOS has also confirmed the swing-high.
Intraday expectation:
Price to continue bullish, react at either premium of 50%, or M15 demand zone, before targeting weak internal low priced at 4,185.910.
Note:
Gold remains highly volatile amid the Federal Reserve's continued dovish stance, persistent and escalating geopolitical uncertainties. Traders should implement robust risk management strategies and remain vigilant, as price swings may become more pronounced in this elevated volatility environment.
Additionally, President Trump’s tariff announcements, particularly against China, are expected to further amplify market turbulence, potentially triggering sharp price fluctuations and whipsaws.
M15 Chart:

GOLD Local Short!
HI,Traders !
#GOLD keeps growing but
will soon hit a
Horizontal resistance
Of 4371.16 so after the
Retest we will be expecting
A local pullback and a
Local move down!
Comment and subscribe to help us grow !

XAUUSD 4H Double top - Bearish setup📉 Technical Overview – Bearish Confluences
Double Top Formation:
Price rejected twice around the 4380–4385 zone, forming a potential double-top structure — a classic reversal pattern signaling exhaustion in bullish momentum.
Break Below Support Zone:
Price is now trading below the short-term support (~4330–4340), confirming a potential neckline break and bearish continuation signal.
Momentum Shift:
Recent candles show strong bearish bodies with increased volatility, indicating sellers taking control. The upper channel rejection also aligns with this bearish bias.
Fibonacci & Channel Confluence:
The rejection occurred near the 61.8% retracement zone of the last swing, and price is now heading toward lower channel support levels — further confirming downside pressure.
🎯 Fibonacci Bearish Targets
Target 1 – 38.2% level: $4,377 → $4,324 zone
(Short-term corrective target; minor support zone)
Target 2 – 61.8% level: Around $4,193
(Mid-term support aligning with previous demand area)
Target 3 – 100% extension: Around $4,068
(Full double-top measured move completion and major support area)

GOLD: BUY $4235, TARGET $4450! (FED RATE CUT PLAY)📰 MACRO & NEWS: Low-Interest Rate Tailwinds
Gold prices are strongly supported by fundamental factors:
Fed Rate Cuts: The market is pricing in a 99% probability of a Fed rate cut next week. Low rates = An ideal environment for Gold.
Safe-Haven Demand: Political uncertainty (extended US Government shutdown) and lingering trade tensions boost safe-haven appeal.
Key Data: Delayed CPI data, expected on October 24th, will serve as a major market catalyst.
Summary: The fundamental momentum for an upside move is dominant and ready for a breakout.
📈 TECHNICAL ANALYSIS: The Perfect LONG Setup!
The chart shows Gold is correcting towards a powerful Demand Zone, where the Uptrend Line converges with a critical structural low.
🎯 Detailed Trading Strategy
We are looking to initiate a buy position as the price hits this demand zone:
Position: LONG (BUY) - Following the primary bullish trend
BUY ZONE (Entry):
$4,237
$4,235 (Key Demand Zone)
SL (Stop Loss):
$4,227 (Protecting the bullish structure's low)
TP (Take Profit Targets):
TP1: $4,245
TP2: $4,255
TP3: $4,265
TP4: $4,275
Final TP: Open (Expecting a New ATH around $4,450+)
REMINDER: This buy opportunity in the demand zone is strongly backed by macro factors (Fed & Instability). Always manage your risk!
#GOLD #XAUUSD #Fed #ATH #TechnicalAnalysis #TradeSetup

Correct projection for GoldAfter breaking through 4280, gold has continued to rise and shows no signs of peaking so far. This fully aligns with our prediction that a breakthrough above 4280 would form bottom support and further test 4362. If it breaks through the previous high of 4379, it will open the channel for further upward movement.

XAUUSD short ??Price has rejected the intraday resistance near 4368– 4370, showing exhaustion and forming a lower-high structure. Liquidity above the previous swing has been taken, this shows potential shift from accumulation to distribution.
selling below 4356 .
safe book @4339
if the level breaks below 4337 then trailing to 4300 - 4295
FXOPEN:XAUUSD

ElDoradoFx PREMIUM – GOLD ANALYSIS (21/10/2025, LONDON SESSION)📊 1. Market Overview
Gold (XAUUSD) is currently correcting after a strong bullish daily run, forming a rejection from the Weak High around 4,381. Momentum has slowed, and the London session opens with price trading below intraday moving averages on lower timeframes, indicating short-term bearish pressure. However, the higher timeframe trend (Daily) remains bullish unless a deeper retracement occurs.
⸻
🕰️ 2. Technical Breakdown
📅 Daily (D1)
✅ Strong bullish trend still intact.
❌ However, current candle shows rejection near the Weak High 4,381.
📍 RSI overbought (78+), signaling possible correction risk.
📉 Probability: Short-term correction inside bullish macro trend.
⸻
⏰ H1
📍 Price failed to hold above 4,350 and formed a lower high after sweeping liquidity.
📉 Currently testing 50 EMA → temporary bearish control.
🟦 Discount zone below 4,330 is being tested.
📍 If 4,317 (Weak Low) breaks, deeper sell phase confirmed.
🟢 If reclaimed above 4,350–4,362, bullish continuation resumes.
✅ Fibonacci (H1 latest swing):
From recent swing low (approx. 4,292) to swing high (approx. 4,375):
📌 Golden Zone (61.8–50%): 4,318–4,336 → currently in play.
⸻
📉 15M–5M (Entry Timeframes)
🔻 Structure shows lower highs forming after a liquidity grab.
📉 MACD momentum fading after small bullish correction.
📍 Price is hovering around 200 EMA area → Decision point.
🔍 Needs break/retest confirmation to define direction.
⸻
📐 3. Fibonacci Analysis (H1 Swing)
Level Price Approx
38.2% 4,341
50% 4,336 ✅
61.8% 4,318 ✅
78.6% 4,304
📍Currently reacting inside 50–61.8 zone → potential bounce or continuation down.
⸻
📍 4. High-Probability Trade Scenarios
📉 SELL Scenario (Higher Probability if bearish confirmation)
🔻 Ideal Sell Zone: 4,341–4,350 (15M LH + EMA rejection + RSI midline failure)
🔻 Sell Confirmation Trigger: Break & retest below 4,330
🎯 Targets:
• TP1: 4,318 (Golden Zone bottom)
• TP2: 4,305 (78.6% level)
• TP3: 4,292 (swing low)
🛑 Invalidation: Clean H1 candle close above 4,362.
⸻
📈 BUY Scenario (Only if bullish confirmation)
🟢 Buy Zone: 4,318–4,330 (Golden Zone + trendline confluence)
✅ Trigger: Bullish engulfing or CHoCH on 5M–15M
🎯 Targets:
• TP1: 4,341 (38.2 retracement)
• TP2: 4,350 (intraday LH)
• TP3: 4,362 (EMA reclaim / structure flip)
🛑 Invalidation: Break below 4,304 (78.6% level).
⸻
📛 Breakout Play (If volatility spikes)
📍 Bullish breakout → Buy above 4,362 with retest → Target 4,381/4,400
📍 Bearish breakdown → Sell below 4,304 → Target 4,292 → 4,270
⸻
📆 5. Fundamental Watch (London Drivers)
🕘 No major UK releases early session.
🕛 Watch for USD sentiment ahead of NY session.
⚠️ Any Fed-related speech could trigger breakout from Golden Zone.
⸻
📍 6. Key Technical Levels
Type Price
Strong High 4,381
LH Resistance 4,350–4,362
Golden Zone 4,318–4,336
Weak Low 4,317
Breakdown Key 4,304
Swing Low 4,292
⸻
🧠 7. Analyst Summary
London opens with price inside the H1 Fibonacci retracement zone. Short-term bearish structure persists unless 4,350–4,362 is reclaimed. Momentum indicators show fading buying pressure, making a bearish retest from premium zones more likely before any bullish continuation.
⸻
🎯 8. Final Bias Summary
Scenario Probability Bias Action
Sell from LH (4,341–4,350) ✅ High Bearish Preferred
Buy from 4,318–4,330 Golden Zone Medium Bullish Only if strong CHoCH
Breakout above 4,362 Medium Bullish Trend continuation
Breakdown below 4,304 ✅ High Bearish Deep correction
⸻

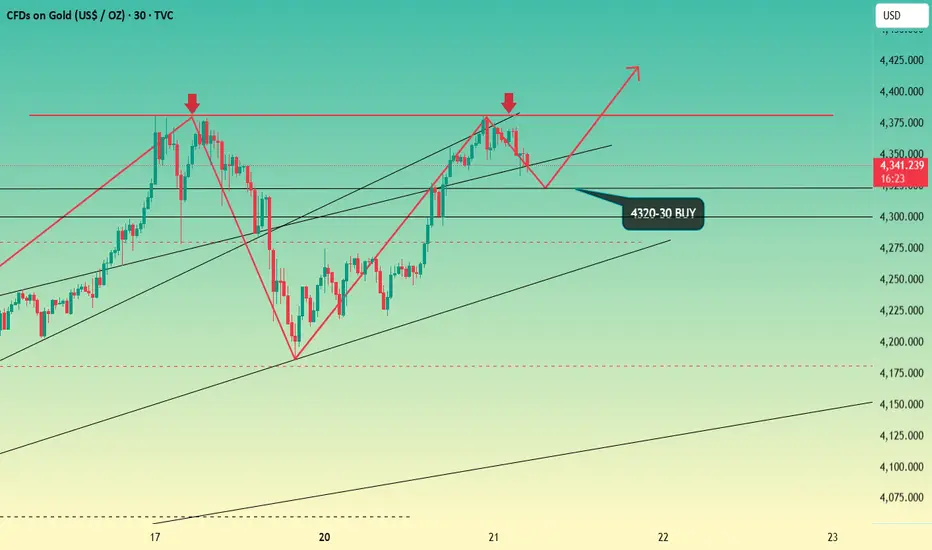
XAU/USD – Bullish Reversal Setup from Buy Zone within DescendingLME:CA1! LME:NI1! LME:MC1! LME:SN1! LME:LH1! LME:SC1! LME:CO1! LME:ZS1! LME:HC1! LME:MA1! LME:MZ1! LME:EA1! Market Structure Overview
The price is currently moving inside a descending channel (marked as TRADE LINE).
A Buy Zone is identified between $4,315 – $4,325, which acts as a strong support area.
Price has touched the lower channel line and rebounded upward, indicating buyer interest around that zone.
📉 Short-Term Trend
The short-term trend is bearish due to lower highs and lower lows inside the channel.
However, momentum shows weakening selling pressure near the buy zone.
🟢 Bullish Scenario
If price holds above the Buy Zone and forms bullish candles, expect a potential reversal toward the upper channel line.
A breakout above the upper channel would signal a trend shift, targeting:
Target: $4,381 – $4,385 (as marked on your chart).
🔴 Bearish Scenario
If price breaks below $4,315, it would invalidate the buy zone setup.
Next potential support could be around $4,300 or lower.
📊 Trade Plan Example
Entry: Near $4,320 – $4,325 (Buy Zone)
Stop-Loss: Below $4,310
Take-Profit: $4,380 – $4,385
Risk-to-Reward: Approximately 1:4
⚙️ Summary
Gold is currently consolidating within a descending channel.
A bullish breakout from this structure could open the path toward the $4,381 target zone, confirming short-term bullish reversal momentum.

XAUUSD - Signal#XAUUSD - Signal
H4 - Double top formation + potential rebound from the level. Stop loss beyond the local maximum. Reduce risks.
Entry: 4345.714
TP: 4283.916 - 4186.789 - 4066.133 - 3991.360
Stop: 4386.930

Big cycle M double top, beware of big pullbackGood morning, bros. Last night we proposed a strategy of short selling in batches if gold rises first and touches the upper pressure level of 4365-4380, and achieved good profits. After today's opening, gold rebounded to this range several times, and it can be said that it has basically recovered the losses since last Friday. However, the intraday rebounds have failed to effectively break through this resistance range. If the bulls want to fully counterattack and move towards the 4400 mark, they need to break through the upper resistance. Judging from the long-term trend, the market has a tendency to form an M-shaped double top, so be cautious in chasing the rise in intraday trading and beware of possible large market corrections.
Judging from the short-term trend, the resistance near 4350 is still obvious. If the European session rebounds to this level again without breaking through, the bull market will be difficult to sustain in the short term. We can consider trying a light short position once, but be sure to set a stop loss. At the same time, if the short-term support of 4330-4320 below cannot be held, gold will fall further to test yesterday's rebound low of 4305-4295. Once 4305-4295 is breached, it may trigger a technical sell-off, pushing the gold price to accelerate its correction to 4240 or even the 4220 neckline.
Trade intraday at key levels, but be wary of market whipsaws.
OANDA:XAUUSD

XAU/USD – Gold Technical Rebound Prepares for Next Waveb]🔍 Market Context
After reaching a peak at the ATH GOLD 4,391 USD region, gold has undergone a technical correction — reflecting temporary profit-taking following a strong upward trend.
The market structure still maintains a bullish bias as the support zones below (FVG + OB) remain intact and untested.
Currently, the price is hovering around 4,325 USD, indicating that selling pressure has weakened.
Buyers are likely to return at two strategic zones below — where institutional money (Smart Money) typically accumulates positions before the next upward wave.
💎 Technical Analysis
ATH GOLD: 4,391 USD
Liquidity Zone $$$: 4,465 – 4,424 USD → the upper liquidity zone, the main target for the next upward wave.
FVG Zone: 4,284 – 4,267 USD → an unfilled gap, likely to be retested.
Order Block Zone: 4,244 – 4,230 USD → deep discount zone confluence with Fibo 0.786, high probability of strong reaction.
Liquidity Clear $$$: 4,186 – 4,190 USD → the last defense zone of the main upward trend.
Overall structure remains bullish ; the current decline is merely a phase of adjustment to “accumulate liquidity” before continuing the upward momentum.
📈 Trading Scenarios
1️⃣ BUY Setup #1 – FVG Zone 4,267 USD
Entry: 4,267 – 4,270
SL: 4,255
TP: 4,330 → 4,366 → 4,391
✅ Condition: Confirming bullish candle (rejection / engulfing bullish) at the FVG zone or a small BoS appears on M15.
➡️ Short-term “buy-the-dip” setup, leveraging the unfilled FVG zone — where technical buyers often initiate positions first.
2️⃣ BUY Setup #2 – Order Block Zone 4,244 USD
Entry: 4,244 – 4,230
SL: 4,210
TP: 4,284 → 4,366 → 4,391 → 4,424
✅ Condition: Strong confirming candle (engulfing bullish) or a retracement pattern breaking a small BoS back up.
➡️ Swing-buy setup at deep discount zone — confluence of OB + Fibo 0.786, high probability and optimal R:R.
⚠️ Risk Management
Avoid FOMO buying in the middle of the range (4,320–4,340).
Prioritize waiting for clear reactions at 4,267 and 4,244 before entering trades.
If the price closes an H1 candle below 4,210 → pause all buy orders, re-evaluate price action at 4,186.
Maintain moderate trading volume during the current rebound phase.
💬 Conclusion
Gold is in a phase of healthy technical correction within a major upward trend.
The two zones 4,267 USD (FVG Zone) and 4,244 USD (Order Block Zone) are key “accumulation” areas for large capital.
When bullish confirmation signals appear, these will be safe buy positions before gold heads back to the peak 4,391 – 4,465 USD .
👉 Reasonable Strategy:
Buy at 4,267 – 4,270 USD if reversal confirmation occurs.
Buy at 4,244 – 4,230 USD if a strong OB reaction signal appears.
🔥 “Smart money waits at precise levels — not at the top. The next gold wave will emerge between 4.267 and 4.244.”

Gold 1H – Bullish Rebound After Strong Correction🟡 XAUUSD – Intraday Trading Plan | by Ryan_TitanTrader
📈 Market Context
Gold is attempting to rebound near $4,320 after a sharp correction earlier this week, as traders weigh the recent pullback in U.S. Treasury yields and renewed expectations of a dovish Federal Reserve tone.
Markets are now positioning ahead of key U.S. housing and manufacturing data, which could shape short-term sentiment for both the dollar and real yields.
• Softer economic numbers may reinforce the case for policy easing in early 2026, supporting gold’s safe-haven appeal.
• Conversely, stronger data could momentarily pressure XAUUSD, yet the broader uptrend remains intact amid central-bank accumulation and geopolitical tension.
Expect a liquidity-driven environment, with price potentially sweeping lower before reclaiming bullish momentum.
🔎 Technical Analysis (1H / SMC Style)
• Structure: Overall bias remains bullish following consecutive Breaks of Structure (BOS) and a confirmed Change of Character (ChoCH) indicating corrective retracement.
• Discount Zone: The $4,270–$4,272 demand area sits within the discount zone of the recent range (swing low to 4454 high), ideal for re-accumulation.
• Liquidity Sweep: Recent wicks near $4,300 suggest liquidity has been collected, potentially setting up for another bullish push.
• Premium Zone: Upside liquidity clusters near $4,454–$4,452, aligning with a premium supply area where short-term selling may appear.
🔴 Sell Setup
• Entry: 4454 – 4452
• Stop-Loss: 4463
• Take-Profit Targets: 4400 → 4330
🟢 Buy Setup
• Entry: 4270 – 4272
• Stop-Loss: 4260
• Take-Profit Targets: 4340 → 4380 → 4450 +
⚠️ Risk Management Notes
• Wait for M15 BOS/ChoCH confirmation before triggering entries.
• Avoid entries during high-volatility windows around U.S. data releases.
• Secure partial profits near intermediate liquidity zones, trail stops after BOS confirmation.
✅ Summary
Gold maintains a bullish re-accumulation structure following a healthy correction.
A retest into the discount zone around $4,270 offers potential long entries targeting the premium zone near $4,450+.
Only a decisive break below $4,260 would invalidate the intraday bullish scenario.
FOLLOW RYAN_TITANTRADER for more SMC trading insights ⚡

XAUUSD Pullback in Play Focus on 4330 SupportXAUUSD shows early signs of bearish correction after failing to hold above 4380. The pair is forming lower highs on intraday charts, signaling a potential swing move toward 4330 if momentum continues to favor sellers.
Key Levels:
Sell Entry: 4365
Take Profit: 4330
Stop Loss: 4380
Reasoning:
Technically, the structure has shifted to the downside, with bearish candles confirming pressure under 4380 resistance. A break below short-term support suggests the start of a corrective leg toward 4330.
Fundamentally, gold remains under pressure as U.S. dollar strength and firm Treasury yields weigh on investor sentiment. Traders await key U.S. inflation data, which could further influence gold’s short term direction.
Disclaimer:
This content is for educational purposes only and not financial advice. Trade at your own risk and follow your individual plan.

Gold Holding Gains Ahead of Key US CPI DataGold extends its bullish momentum in early Asian trading, hovering near $4,370, supported by rate-cut expectations from the Fed and ongoing US government shutdown concerns, which continue to pressure the USD.
According to CME FedWatch, markets are now pricing in a 99% probability of another rate cut next week — a strong catalyst for gold bulls.
Lower interest rates reduce the opportunity cost of holding non-yielding assets like gold, reinforcing the medium-term uptrend.
However, all eyes are on the US September CPI report due later this week.
A hotter-than-expected reading could temporarily lift the USD and trigger short-term volatility in gold prices.
🔍 MMFlow Technical Outlook
Gold is currently consolidating around the $4,320–$4,370 range after reaching the ATH zone.
Price action shows a clear liquidity sweep at the highs, followed by a minor retracement — still within the bullish structure.
The main trendline remains intact, suggesting that any dip toward $4,305–$4,260 may attract new buyers.
⚙️ Trading Plan (MMFlow View)
BUY SCALP Setup
Entry: 4,302 – 4,300 (½ volume)
Stop Loss: 4,292
Take Profit: 4,310 → 4,315 → 4,320 → 4,330 → 4,340 → 4,350+
BUY ZONE (Swing)
Entry: 4,260 – 4,258
Stop Loss: 4,252
Take Profit: 4,265 → 4,270 → 4,280 → 4,290 → 4,300+
📈 Buy setups remain favored as long as price holds above 4,260.
Intraday sell reactions near 4,360–4,378 are short-term only — watch for liquidity grabs and bullish re-entry opportunities.
⚡️ Key MMFlow Zones
CP Down Zone / OBS Sell Zone: 4,360
ATH Liquidity Sell Zone: 4,448
Retest Trendline / OBS Buy Zone: 4,305
End FVG Uptrend / OBS Buy Zone: 4,260
Sentiment: 🟢 Bullish Bias
Bias Confirmation: CPI Data & Fed Rate Expectations
Strategy: Buy-the-Dip → Target Liquidity Above 4,370–4,380
🔥 Stay patient — let liquidity drive the next leg. MMFlow tracks smart money zones, not emotions.

Gold bulls hit new highs, go long on dipsGold directly recovered Friday's losses and hit a new high yesterday, which undoubtedly reflects the strength of the bulls. As mentioned in my post yesterday, with the support level of 4218 held, the low points have been gradually moving up, and a breakthrough above 4280 was only a matter of time. After breaking through 4280, the price surged all the way to a high of 4381, before starting to decline slowly. The gold bulls have risen again, and the current correction ended in the form of a rapid adjustment, allowing gold to return to the bull market.
From a technical perspective, the short-term correction has been repaired, and the price has moved back above all major moving averages, indicating that the market has regained its strength. The 1-hour moving average is still diverging upward in a bullish trend, leaving room for further upside in gold. Additionally, factors such as the U.S. debt crisis, the U.S. dollar credibility crisis, risk-aversion sentiment, and the interest rate cut cycle are driving gold prices higher. As long as these issues are not resolved or mitigated, the escalating contradictions will inevitably push the price to rise further.
Today's Strategy: If gold pulls back to the range of 4320-4330, consider going long on gold appropriately and set up a stop-loss order for risk protection.