Gold prices fluctuate. Betting on extraordinary rate cuts.Precious metals continued their previous surge last week. Gold set new records for five consecutive days, reaching a high of nearly $4,380, a new all-time high.
The ongoing US government shutdown, the Federal Reserve's renewed interest rate cut cycle, high debt levels, escalating Sino-US trade frictions, and the ongoing Russia-Ukraine conflict continue to fuel demand for gold as a safe haven, de-dollarizing, and asset allocation.
Last Friday, gold also fell sharply by nearly $200 to a high of around 4380, and hit a low of around 4188. Despite the sharp market decline, the price still rose by nearly 6% last week, marking its ninth consecutive week of gains. Mainly due to the bad loan problems of two US banks, global demand for safe-haven assets has surged.
From the daily chart, gold is still maintaining a slight upward trend. Last Friday's pullback coincided with the MA5 support level. This is most likely the maximum extent of gold's pullback. A complete shift from a bullish to a bearish trend is currently difficult. At the very least, it must first fall below the MA5 moving average before there will be further room for retracement. As it remains above the moving average and there is no particularly negative information for gold, the trend may continue to remain at a high level.
From the 1-hour chart, the Bollinger Bands are gradually narrowing, and prices are likely to remain range-bound. Current support lies near the lower Bollinger Band at 4215, while upward pressure is expected in the 4270-4280 range.
Although prices fell below the lower Bollinger Band last Friday, they subsequently rebounded. This trend continued in the Asian session on Monday, reaching near the middle Bollinger Band. Prices are still holding above the lower Bollinger Band and trading at a high level.
Overall, the trend remains relatively strong until the price breaks below 4215. With prices trading above this level, buying on dips in the short term is still a viable option.
More real-time trading strategies are being released in the channel, so stay tuned.
Xauusdanalysis

LiamTrading - XAUUSD: Mid-Term Correction Begins ...LiamTrading - XAUUSD: Mid-Term Correction Begins - Watch for Selling at Key Resistance Zone
Hello traders community,
After a surge due to geopolitical tensions, XAUUSD (Gold) is starting to show signs of a mid-term correction. The upward momentum has stalled, and prices are showing weakness from the peak region.
The market is currently in a state of tug-of-war, influenced by various macro factors, creating clear two-way trading opportunities.
📰 Macro Analysis: Interwoven Market
Gold prices are currently caught between three main streams of information:
Support (Bullish): The Israel–Hamas conflict and escalating geopolitical risks remain the main "safe haven" factor, keeping Gold prices anchored at high levels.
Pressure (Bearish): Signs of "cooling down" in US-China trade tensions reduce the demand for safe haven assets and restrain Gold's upward momentum.
Long Term (Bullish): Expectations that the Fed will soon cut interest rates continue to support Gold in the long term, although it does not have a strong short-term impact.
This contradiction makes it difficult for the market to break further, instead necessitating a technical correction.
📊 Technical Analysis
The M30/H1 chart clearly shows the correction structure forming:
Declining Structure: Prices have formed a distinct peak and dropped sharply, breaking short-term upward structures. The current uptrend is merely a technical recovery wave.
Dominant Sell Zone: The $4306 zone is an extremely important confluence area. This is:
The 0.382 Fibonacci Retracement level, a common retracement ratio.
An old support zone that has been broken, now becoming strong resistance ("Sell fibonacci and support" on the chart).
A large previous liquidity area, where sellers will strongly defend this region.
Price Decline Target: The main target for this decline is the VAL (Value Area Low) zone of the Volume Profile indicator, around $4180. This is a high-volume trading area, where buyers are likely to return.
🎯 Detailed Trading Strategy
The main priority is to watch for selling at Fibonacci resistance zones.
Scenario 1: Sell Correction (Sell) 📉
Entry: $4306
Stop Loss (SL): $4312 (A tight, safe SL above the resistance zone)
Take Profit (TP): $4288 - $4265 - $4233 - $4210 - $4190 (Final target is the VAL zone)
Scenario 2: Buy at Strong Support Zone (Buy) 📈
Entry: Watch for buying when prices correct deeply to the VAL $4178 zone.
Stop Loss (SL): $4170
Take Profit (TP): $4198 - $4225 - $4246 - $4270
Summary
Although long-term macro factors continue to support Gold, technically, a mid-term correction has begun. The optimal strategy is to watch for selling (Sell) when prices recover to the confluence resistance zone $4306 and take profits at the targets below, especially the VAL $4180 zone.
Always manage your capital tightly. Wishing traders a successful week!
Note: This article is for reference only and is not investment advice.

XAUUSD analysis – 1H OB SetupThe overall market structure remains bullish, forming consistent higher highs and higher lows.
Currently, price is showing signs of a controlled pullback after a strong impulsive leg, and the most probable scenario is a retest of the 1H Order Block around 4110–4130.
That zone holds unmitigated buy orders and sits right below local equal lows — a perfect liquidity pocket before continuation.
We’ll wait for price to sweep that area and confirm a new bullish leg through a lower timeframe confirmation (BOS + FVG + OB alignment) before entering longs.
If the zone reacts cleanly, the next target will be the recent highs (around 4270–4300).
Only a clean break below 4100 would invalidate the bullish scenario for now.
📊 ProfitaminFX | Gold, BTC & EUR/USD
📚 Daily setups & educational trades

XAU/USD 20 October 2025 Intraday AnalysisH4 Analysis:
-> Swing: Bullish.
-> Internal: Bullish.
Price has printed as per previous intraday expectation by printing a bearish CHoCH which indicates, but not confirms, bullish pullback phase initiation.
Price is currently trading within an established internal range, however, I will continue to monitor price with regards to depth of pullback.
Intraday expectation:
Price to continue bearish, react at either discount of 50% internal EQ, or H4 supply zone before targeting weak internal high priced at 4,380. 990.
Note:
The Federal Reserve’s sustained dovish stance, coupled with ongoing geopolitical uncertainties, is likely to prolong heightened volatility in the gold market. Given this elevated risk environment, traders should exercise caution and recalibrate risk management strategies to navigate potential price fluctuations effectively.
Additionally, gold pricing remains sensitive to broader macroeconomic developments, including policy decisions under President Trump. Shifts in geopolitical strategy and economic directives could further amplify uncertainty, contributing to market repricing dynamics.
H4 Chart:
M15 Analysis:
-> Swing: Bullish.
-> Internal: Bearish.
I have been mentioning in my alternative scenario for almost 1-month that all higher timeframes are requiring a pullback, and we are seeing a narrowing of internal structure, price could target strong internal low. This is how price printed.
Price has printed a bearish iBOS after a very long duration and subsequently a bullish CHoCH to indicate, but not confirm bullish pullback phase initiation.
The bearish iBOS has also confirmed the swing-high.
Intraday expectation:
Price to continue bullish, react at either premium of 50%, or M15 demand zone, before targeting weak internal low priced at 4,185.910.
Note:
Gold remains highly volatile amid the Federal Reserve's continued dovish stance, persistent and escalating geopolitical uncertainties. Traders should implement robust risk management strategies and remain vigilant, as price swings may become more pronounced in this elevated volatility environment.
Additionally, President Trump’s tariff announcements, particularly against China, are expected to further amplify market turbulence, potentially triggering sharp price fluctuations and whipsaws.
M15 Chart:

Can Gold Still Reach 4400? Focus on the 4280 WatershedGold opened slightly higher at 4251 this morning, but immediately crashed and fell back below 4239. However, this didn't trigger a further sell-off, instead it stalled and saw a strong rally. Gold therefore broke through 4273 before retreating. The pullback was also quite strong, directly reversing gains and heading towards 4220. This aligns with the signal mentioned in yesterday's article, suggesting a short position below 4280.
Gold's 30-minute moving average has begun to turn downward. If it forms a downward death cross, the 30-minute moving average could see further downward movement. Even with the risk-averse approach, gold failed to break through the resistance at 4280 this morning, indicating that 4280 remains the current dividing line between bulls and bears.
Resistance levels: 4260, 4280
Support levels: 4200, 4180
Trading strategy:
1. If gold retreats to the 4200-4180 area, consider going long on gold and setting up a protective position.
2. If gold rebounds to the 4265-4275 resistance area, consider shorting gold.
3. If gold breaks through and holds above 4280, consider going long on gold after a pullback.
If you're feeling lost and unsure about the market, follow my updates and channel. I'll provide daily updates, including details on long- and short-term trade execution. If you're interested, please share your current positions and we can analyze whether it's safer to hold on or adjust and change your positions.

XAU/USD: Bullish Surge to 4400?As the previous analysis worked exactly as predicted, OANDA:XAUUSD is setting up for a bullish surge on the 4-hour chart , where price is bouncing off a solid upward trendline, converging with the EMA 50 as dynamic support and a key support zone, signaling potential continuation of the uptrend amid recent consolidation. This confluence creates a strong buying opportunity if buyers hold the line against short-term pullbacks.
Entry zone between 4090-4165 for a long position. Targets at 4380 (first) and 4400 (second) near the resistance zone, delivering a risk-reward ratio close to 1:3 . Set a stop loss on a close below 4090 to mitigate downside risks. 🌟 Monitor for confirmation via a bullish candle close above the entry with building volume, capitalizing on gold's safe-haven appeal in uncertain markets.
Fundamentally , no major news events are observed in the economic calendar today. However, key Chinese data releases such as the PBoC interest rate decision and Q3 GDP could indirectly influence gold through global risk sentiment and commodity demand. 💡
📝 Trade Plan:
✅ Entry Zone: $4,090 – $4,165 (buy zone near trendline + EMA 50)
❌ Stop Loss: Close below $4,090
🎯 Targets:
TP1: $4,380 (initial resistance)
TP2: $4,400 (major resistance / extended target)
💎 Risk-to-Reward: Approx. 1:3, offering a strong technical edge.
What's your take on this gold setup? Comment below! 👇

4,200 or 4,285? Gold’s Next Move Decides It All📊 Market Overview
Gold remains under pressure at the start of the week, trading below last week’s record highs, after a sharp correction from the 4,380s down to the 4,240 zone.
Investor sentiment is cautious as the market navigates a mix of uncertain U.S. economic data, a still-closed U.S. government, and renewed geopolitical tensions across multiple regions — all of which are fueling both fear and indecision in the market.
During early Asian hours, gold showed a mild recovery but continues to move sideways in a tight consolidation range, reflecting indecisive liquidity buildup before the next major move.
🧠 Technical Structure (MMFLOW View)
Gold is consolidating between short-term support near 4,206–4,204 and resistance around 4,285–4,287.
Liquidity has started to cluster above and below the current range, suggesting that a breakout is imminent.
The 4,166 – 4,140 region remains a major Smart Money re-entry zone, aligned with the CP BUY ZONE + OBS demand block.
On the upside, 4,313 – 4,342 stands as a key supply zone where large sellers previously stepped in.
Until price breaks out decisively, traders should expect choppy intraday conditions with limited follow-through.
🔑 Key Levels to Watch
🟢 BUY ZONE (Liquidity Re-entry Zone)
Zone: 4,206 – 4,204
SL: 4,200
TP: 4,210 – 4,215 – 4,220 – 4,230 – 4,240 – 4,250 – ???
🔴 SELL ZONE (Liquidity Reaction Zone)
Zone: 4,285 – 4,287
SL: 4,292
TP: 4,280 – 4,275 – 4,270 – 4,260 – 4,250 – ???
⚙️ MMFLOW Scenarios
1️⃣ Bullish Scenario:
If gold sustains above the 4,200 – 4,210 support area, a short-term rebound toward 4,270 – 4,285 can be expected.
Breaking above 4,287 would open room toward 4,313 – 4,342 (OBS Sell Zone), where Smart Money may begin distributing again.
2️⃣ Bearish Scenario:
A clean break below 4,200 could trigger a deeper retracement toward 4,166 – 4,140 (CP BUY ZONE).
This would still represent a healthy correction within the broader bullish macro structure.
⚡ MMFLOW Insights
Market remains neutral-to-bullish, but current movement reflects accumulation within a compression range.
Sideway structure indicates the market is loading liquidity for the next impulsive leg.
Patience is key — traders should wait for clean breakout confirmations before scaling positions.
⚠️ Trading Notes
✅ Use tight Stop Losses — gold’s volatility remains unpredictable during macro uncertainty.
✅ Avoid over-leveraging while price stays inside the sideway channel.
✅ Focus on reaction zones (CP, OBS, and liquidity sweeps) for precise entries.
🧭 Quick Summary
Gold trades sideways below record highs.
Key support: 4,206 – 4,204, key resistance: 4,285 – 4,287.
Short-term bias: Range-bound with bullish undertone.
Best approach: Buy dips at liquidity zones; wait for breakout confirmation before trend trades.

GOLD:Ranging between 4200-4280,awaiting guidance from news flows📈Gold exhibited a trend of surging higher and then pulling back today. In the early session, stimulated by news of localized conflicts in the Middle East, risk-aversion sentiment picked up, driving gold prices higher. After the opening, prices surged rapidly to 4,273.99. However, signs of de-escalation emerged afterward, cooling risk-aversion sentiment.
Meanwhile, factors such as early signs of a decline in U.S. auto loan rates and fading expectations of a Fed rate cut led some funds to shift from gold to U.S. dollar assets, resulting in a drop in gold prices.
📝From a technical perspective, the key resistance level above is around 4280. If gold can hold firmly above this level, it may form a short-term bottom structure and further test the 4362 level. A break above the previous high of 4379 would open the door to further upside. The support level below is near 4200; if this support fails to hold, gold prices may fall further to 4150 or even lower.
📝From a fundamental perspective, there are many uncertain factors in the market. While there are hints of news such as a Russia-Ukraine ceasefire and China-U.S. trade negotiations, the outcomes remain uncertain. If the negotiations do not go smoothly, it may once again benefit gold. Additionally, the probability of a U.S. government shutdown has increased, which provides some support for gold prices.
♦Overall, the Gold is likely to fluctuate within the 4200–4280 range in the short term, waiting for further guidance from fundamental news.
Buy 4220 - 4225 TP 4235 - 4245 - 4255 SL 4210
Sell 4270 - 4275 TP 4265 - 4255 - 4245 SL 4280
Daily-updated accurate signals are at your disposal. If you run into any problems while trading, these signals serve as a reliable reference—don’t hesitate to use them! I truly hope they bring you significant assistance

ElDoradoFx PREMIUM – GOLD ANALYSIS (20/10/2025, LONDON SESSION)Gold is currently trading around 4,228 after failing to sustain above 4,260 in the previous session. The pair has entered a corrective phase, forming a near-term lower high structure on intraday charts. Despite the pullback, the broader bullish trend remains intact, but momentum has temporarily shifted bearish. The upcoming London session will determine whether buyers step in from key retracement zones or if a deeper retracement develops.
⸻
📊 2. Technical Breakdown
✅ Daily (D1)
• Overall trend remains bullish with a corrective dip.
• Last candle shows a bearish wick from the 4,260 rejection zone.
• RSI cooling from overbought territory → indicating controlled correction.
✅ Bias: Bullish long-term, corrective near-term.
✅ 1H Chart (H1)
• Price broke minor intraday support and is currently consolidating near 4,228.
• Trading below 50 EMA, indicating reduced short-term momentum.
• Minor lower highs forming → sellers in control short-term until a bullish reclaim occurs.
📉 Bias: Neutral to bearish below 4,241, bullish above 4,241.
✅ 15M–5M
• Price structure shows intraday descending sequence.
• Small bullish attempts seen near 4,220–4,230, but no confirmed reversal yet.
• Momentum (MACD) still bearish but stabilizing.
📌 Bias: Waiting for either rejection or continuation signal around key zones.
⸻
📐 3. Fibonacci Analysis
Swing Low: 4,197
Swing High: 4,260
Level Price Confluence
38.2% 4,241 Minor intraday resistance & EMA zone
50% 4,229 Current consolidation price
61.8% 4,220 Trendline + previous demand
78.6% 4,209 Liquidity sweep zone
✅ Golden Zone: 4,229 – 4,220 → key reaction area for bullish continuation.
⸻
🎯 4. High-Probability Trade Scenarios
✅ A) Bullish Continuation (Primary Bias if Golden Zone holds)
✔ Entry Trigger: Bullish confirmation inside 4,229–4,220
🎯 TP1 → 4,241 | TP2 → 4,250 | TP3 → 4,260
🛑 SL: Below 4,209
⸻
✅ B) Momentum Buy (Break & Retest)
✔ Trigger: Break & retest above 4,241 (Fib + EMA reclaim)
🎯 TP1 → 4,250 | TP2 → 4,260 | TP3 → 4,279
🛑 SL: Below 4,229
⸻
⚠️ C) Bearish Continuation (Countertrend)
✔ Trigger: Break & retest below 4,220
🎯 TP1 → 4,209 | TP2 → 4,197 | TP3 → 4,180
🛑 SL: Above 4,236
⸻
📰 5. Fundamental Watch
Time Event Impact
All day Middle East sentiment risk Supports gold if tensions rise
London open DXY reaction Strong USD = pressure on gold
Later US session PMI data expected Can shift intraday direction
DXY currently weak near 104.50 → supports possible rebound in gold if structure holds.
⸻
📌 6. Key Technical Levels
Resistance Support
4,241 4,229
4,250 4,220
4,260 4,209
4,279 4,197
📍Trendline support aligns strongest around 4,220.
⸻
📣 7. Analyst Summary
Gold is in a corrective pullback phase inside a long-term uptrend. The Golden Zone (4,229–4,220) is the key battleground between bulls and bears. If price reacts positively and H1 structure shifts bullish above 4,241, continuation toward 4,260 is likely. However, failure to hold above 4,220 could extend the retracement toward 4,197.
⸻
🎯 8. Final Bias Summary
Condition Outlook
✅ Holds 4,229–4,220 Expect bullish continuation
📈 Breaks & retests above 4,241 Momentum reversal confirmed
❌ Breaks below 4,220 Bears take control toward 4,197
⚠️ Break above 4,260 Bull run continuation resumes
📌 Awaiting London confirmation from Golden Zone for bullish re-entry.

Elliott Wave Analysis XAUUSD – October 19, 2025
1️⃣ Momentum
D1 Timeframe:
Daily momentum is showing early signs of bearish reversal.
As mentioned in the previous plan, a daily reversal could occur on Friday or Monday.
The strong bearish D1 candle on Friday reinforces this signal.
If another bearish D1 candle appears on Monday, it will confirm that the main trend for the coming week is likely to turn bearish, pushing D1 momentum toward the oversold zone.
H4 Timeframe:
H4 momentum is preparing to turn upward, suggesting that the initial downside movement on Monday may not be too strong.
A short-term recovery bounce is likely.
However, if this bounce fails to break the previous high and momentum reverses downward again, it will confirm the start of a more stable downtrend.
H1 Timeframe:
H1 momentum is currently in the overbought zone, which indicates a short-term pullback may occur early in Monday’s session.
2️⃣ Wave Structure
D1 Structure:
We can see a strong bearish candle — the largest since the beginning of the uptrend, signaling the first warning of exhaustion.
Together with the D1 momentum reversal, this suggests the yellow wave 3 is likely coming to an end, and yellow wave 4 is starting to form.
In terms of time, wave 4 could take more than a week to complete.
H4 Structure:
A sharp decline has pushed the price back inside the ascending channel, indicating that the extended wave 5 may have already ended.
If confirmed, the market could continue down toward at least the previous blue wave 4 area.
However, because H4 momentum is preparing to rise, a short-term upward correction may occur early Monday.
If this upward move is slow and overlapping, fails to break the previous high, and H4 momentum turns down again, that will confirm the completion of blue wave 5.
H1 Structure:
On the H1 chart, the blue wave 5 from H4 is detailed into five smaller red waves.
The recent steep and fast decline suggests a five-wave bearish pattern, possibly wave 1 of a new downtrend or wave A of a corrective move.
There is also a possibility of a Flat correction, where wave C extends to 1.618 × wave A (as discussed in the October 17 plan).
Overall, the market may present a short-term recovery bounce, providing a buy opportunity early in the week.
3️⃣ Trading Plan
Buy Zone: 4153 – 4151
Stop Loss: 4141
Take Profit: 4193
Alternative Scenario:
If price fails to break below 4193, monitor H1 momentum as it enters the oversold zone and turns upward — that will be a potential buy signal.
In that case, key support areas to watch include: 4243 – 4226 – 4207 – 4194.

20/10/68 : XAUUSD ( Europe / London Session )Using it from Europe Session until 7.00PM , I'll new analysis and update at 8.00PM
Resistance
4287-4292
4276-4281
4271
Support
4260
4250-4255
4239-4245

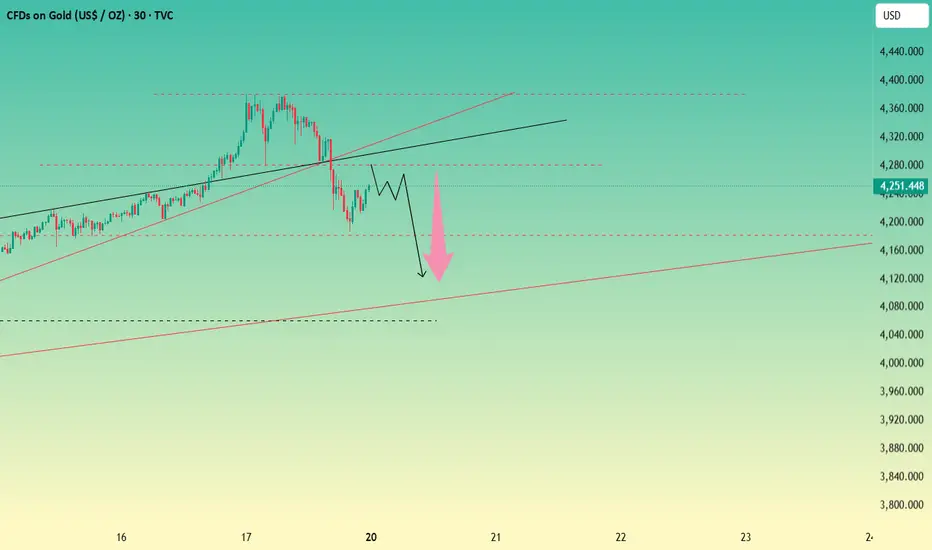
4,000 Pips Up, 2,000 Down – Gold’s Wild Ride Continues!Last week has been a wild ride for Gold traders, with the price rallying aprox 4,000 pips (around 10%), only to sell off 2,000 pips on Friday in what many expected to be a well-deserved correction.
The big question now is: was that correction enough, or is Gold preparing for another leg down before continuing higher?
In my view, this was just the first leg of the correction, and I expect another wave of selling to come this week.
Currently, Gold is recovering from Friday’s sharp drop, and this rebound could potentially push prices back above 4,300.
If that happens, I’ll be watching closely for signs of weakness to position myself short.
Overall, I believe a new test of the 4,200 area is likely before any sustainable recovery can take place.

Gold (XAUUSD) – 20 Oct | Watching Key Sell & Buy Zones🟡 Gold (XAUUSD) Analysis – 💫20 October💫
Hello Disciplined Traders,
Welcome to the Chart Is Mirror Community 👋
✨ Wishing you all a Happy Diwali! ✨
May this festival of lights illuminate your trading mindset — replacing fear with clarity , greed with discipline , and impulsiveness with stillness . Trade like a lamp — steady, calm, and bright from within.✨
Market Context
Gold is currently in an H4 pullback phase after marking a new all-time high around 4381 .
M15 has shown a ChoCh confirmation , indicating short-term weakness and aligning with the H4 pullback structure.
If BoS below 4186 occurs, we can expect further continuation to the downside.
However, without BoS, this could just be a liquidity grab before the trend resumes upward.
Key Observations
Since M15 is showing an internal bullish structure, we will observe both sides of the market for potential opportunities.
• Sell Zone: 4287.5–4316.7 (OB zone).
If price pulls back to this zone and respects it with LTF confirmation , we will plan a short-term sell setup accordingly.
If the market fails to respect this zone and breaks above it, we may see a continuation of the bullish momentum — so stay still and observe the structure closely.
• Buy Zone: 4207 (Unmitigated Internal Key Level).
If price first comes down to retest this level and respects it with LTF confirmation , we’ll plan a long setup targeting the sell zone.
Execution Plan
For today’s session, we will observe both POIs carefully.
If any zone is invalidated, we will reassess the price action as per the structure and plan accordingly.
Discipline brings clarity — let the market confirm before you act.
📘 Shared by @ChartIsMirror

Gold Trade Breakdown | Price Is Setting Up Something Big… Don’t GOLD (XAUUSD) – Super Clean Setup Forming.
I’m sharing how I’m looking to execute on this move – where price is reacting, what it’s trying to do next, and how I plan to manage my entry, stop loss and targets.
🔹 Market Structure: Price is tapping into a key zone – buyers/sellers are clearly fighting here. I’m waiting for confirmation before entering.
🔹 Idea Behind the Entry: price already retested at the extreme pont of 4h-1h structure.. not only that we clearly seeing 3 pin formation forming idea a swing low forming.. all my trade on gold is giving the same entry criteria.. but mainly just focus on price action and go with the trend and what i use most right now with gold price movement is the psychological number..
🔹 Trade Management: If price gives me my entry, I’ll secure partials at the first target and move stop loss to breakeven. Let runners target higher.
🔹 What Price Is Telling Us: Clearly building orders – this could be preparing for a strong move if momentum confirms.
Not financial advice – just sharing how I see the market and how I plan to execute it.
If you find this helpful, leave a like/comment. I’ll update if entry gets triggered ✅

ElDoradoFx PREMIUM – GOLD ANALYSIS (20/10/2025, ASIA SESSION)Gold (XAUUSD) closed the previous US session with a rebound from the lower H1 liquidity sweep around 4,186 and is currently pushing back toward the intraday structure resistance near 4,252–4,263. The broader uptrend remains intact but momentum has weakened, suggesting the market is deciding between bullish continuation or deeper retracement. The daily timeframe printed a bearish rejection wick from the previous high at 4,379, showing potential exhaustion but not yet a confirmed reversal.
⸻
🧭 2. Technical Breakdown
✅ D1 (Daily)
• Strong bullish structure remains intact.
• Last candle shows rejection from 4,379 high with moderate selling pressure.
• RSI cooling from extreme (77 → mid 70s), still bullish but losing momentum.
✅ Bias: Bullish unless 4,186 is broken.
✅ H1 (1-Hour)
• Price rebounded strongly after sweeping 4,186.
• Currently consolidating under 4,263 intraday resistance.
• MACD shows early bullish cross but lacks strong histogram expansion (watch momentum).
✅ Bias: Neutral to bullish above 4,216.
✅ 15M–5M (Intra-session)
• Short-term bullish structure forming higher lows.
• Clear break/retest setup forming around 4,252–4,263.
• If bulls fail here, next liquidity target is lower at 4,216–4,200.
✅ Bias: Reactive — breakout or rejection zone incoming.
⸻
📐 3. Fibonacci Analysis (Last swing move)
Swing Low: 4,186
Swing High: 4,252
🎯 Golden Zone (61.8–50%) = 4,216 – 4,225
✅ This aligns with EMA50 H1 zone & previous liquidity rejection → highly reactive zone.
⸻
🎯 4. High-Probability Trade Scenarios
✅ A) Bullish Continuation (Main Setup)
📍 Break & Retest Buy Above: 4,263
🔁 Retest Zone: 4,252–4,256
🎯 TP1 4,279 | TP2 4,300 | TP3 4,320
🛑 SL Below: 4,240
📉 B) Pullback Buy (Golden Zone)
📍 Wait for pullback into 4,216–4,225 (Fib + EMA + demand zone)
🎯 TP1 4,252 | TP2 4,263 | TP3 4,279
🛑 SL Below: 4,200
⚠️ C) Bearish Intraday Sell (Countertrend / only if confirmed)
📍 Break & Close Below: 4,216
🔁 Retest Zone: 4,216–4,225
🎯 TP1 4,200 | TP2 4,186 | TP3 4,171
🛑 SL Above: 4,235
⸻
📰 5. Fundamental Watch (Asia Session)
Factor Impact
DXY sideways Neutral
Yields cooling Supports gold
No major Asian news Technical flow will dominate
Market awaiting US session catalysts Potential low volatility early
⸻
📍 6. Key Technical Levels
Level Type
4,379 Major High
4,263 Intraday Resistance
4,252 Current intraday cap
4,225 Fib support
4,216 Fib confluence
4,200 Key psychological support
4,186 Last liquidity sweep low
⸻
📘 7. Analyst Summary
Gold is stabilizing after a retracement from 4,379 and currently retesting mid-range liquidity. The bias remains bullish, but continuation requires a clean break above 4,263. A healthy corrective entry lies at 4,216–4,225 if price dips first. A strong bearish case only activates if price breaks and sustains beneath 4,216.
⸻
✅ 8. Final Bias Summary
Bias Why
✅ Bullish above 4,225 Aligned with Fib + trend structure
⚠️ Neutral between 4,225–4,263 Waiting for breakout or pullback
❌ Bearish only below 4,216 Would trigger deeper retracement
📌 Game Plan → Buy Break At 4,263 or Wait For Golden Zone 4,216–4,225.
📌 Only sell below 4,216 with confirmation.
----------------------
🥇 ElDoradoFx PREMIUM 2.0 📱
📆 WEEKLY PERFORMANCE: 13/10/2025 → 17/10/2025
---
✅ MONDAY 13/10/2025
🔻 SELL +30 pips
🟢 BUY +210 pips
🟢 BUY +360 pips
---
✅ TUESDAY 14/10/2025
🟢 BUY (Swing) +2,970 pips
🟢 BUY +50 pips
🟢 BUY +210 pips
🔻 SELL +20 pips
🔻 SELL LIMIT +160 pips
🟢 BUY +20 pips
❌ BUY –40 pips (SL)
🟢 BUY LIMIT +40 pips
🔻 SELL +110 pips
🔻 SELL +60 pips
---
✅ WEDNESDAY 15/10/2025
🔻 SELL +60 pips
🟢 BUY +60 pips
❌ SELL –40 pips (SL)
🟢 BUY +60 pips
🟢 BUY +50 pips
🟢 BUY (Swing) +1,970 pips
🔻 SELL +20 pips
🔻 SELL +110 pips
---
✅ THURSDAY 16/10/2025
🟢 BUY +210 pips
🟢 BUY +75 pips
🟢 BUY +230 pips
🟢 BUY LIMIT +210 pips
🔻 SELL LIMIT +210 pips
---
✅ FRIDAY 17/10/2025
🔻 SELL +20 pips
🟢 BUY +20 pips
🟢 BUY +210 pips
🟢 BUY LIMIT +20 pips
🔻 SELL LIMIT +110 pips
🟢 BUY +50 pips
❌ BUY –30 pips (SL)
🟢 BUY +200 pips
🟢 BUY +100 pips
🟢 BUY +400 pips
---
🤑 BTC/USD WEEKEND TRADES
🟢 BUY +2,400 pips
🔻 SELL +400 pips
---
📊 WEEKLY TOTALS
🏆 GOLD NET PIPS +8,565 pips
💰 BTC/USD NET PIPS: ✅ +2,800 pips
🚀 TOTAL GAIN +11,365 pips
📈 TOTAL SIGNALS: 38
✅ WINS: 35
❌ SLs: 3
🎯 WIN RATE: ✅ 92%
---
🔥 Massive GOLD swing wins + strong intraday consistency + BTC power = another high-performance week!
If you stayed disciplined and followed our strategy — you banked big 📈💎
👏 Congratulations if you profited! ✅✅✅🚀🚀🚀

XAUUSD Bullish Continuation Setup: Post-Correction Rally to ?Key Observations and Strategy:Prior Momentum: The market showed a strong, rapid bullish move throughout October 2025.Current Price Action: The price is undergoing a healthy pullback (correction) from its recent high, currently sitting around 4,246.78.
Support Zone: The critical demand area is highlighted in light blue, acting as a Support zone roughly between 4,155}$ and 4,223. This is where buying pressure is expected to resume.
Trade Setup (Long/Buy): The strategy is to enter a long position (buy) on a rebound from the support area, banking on the continuation of the primary uptrend.
Stop-Loss: The trade is protected by a Stop-Loss placed just below the support at 4,155.67. This is the point where the bullish view would be invalidated.
Target (Take Profit): The anticipated peak for this move is the Target at 4,426.70.
Conclusion: This setup represents a high-probability trade for a bullish continuation pattern following a recent, significant rally.

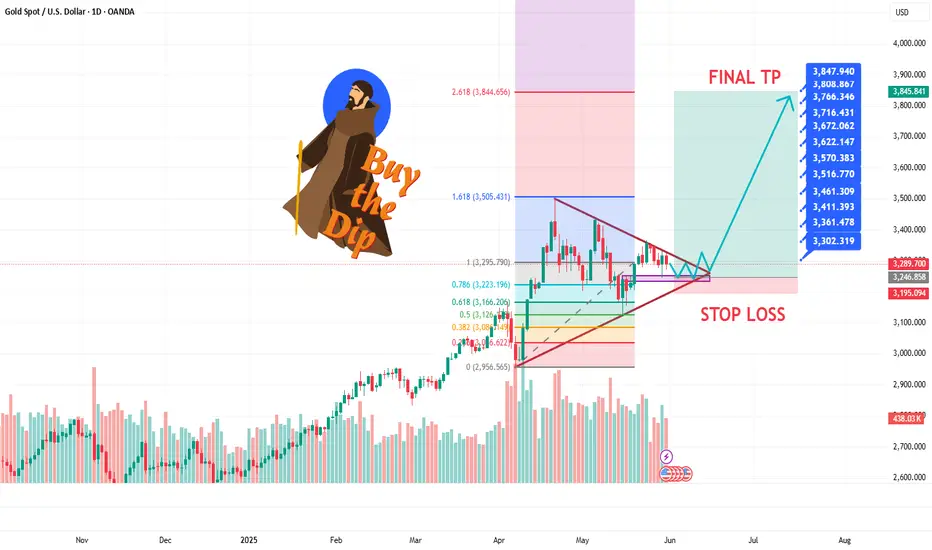
GOLD AND WAR NEXT TO 4K$Hello traders
as i can see gold is trading in a Decending Triangle zone and it had tested Fibo 0.61 ratio in month of may dip as we can see gold close monthly candle above 3280 zone which is a clear sign that big players and banks are still prefer Safe haven we can see US econmey in a bad recession zone unemployment and higher inflation is a big problrm for $ and on all these things Mr. Trump Tariffs is a game changer in commodities markets if we see Geopolitical issues around the world it esculating more war in diffrent regions of the world.. Now Israiel & US have a new biggest problem Iran which is showing us a attack on Iran can be happen incoming days as we can see 6 meetings was unsucessful in Oman for a Deal to Stop Iran's Nucler Enrichment Program which is not good... other then fundamental Charts are crystal clear and showing us a clear view for a New ATH on Gold our Risk reward ratio is prefect for us have a proper research before taking any trade its just an trade idea share your thoughts with us it will help many other traders Comments are open we love your comments and support the channel so it can diliver to many other new traders Stay Tuned for new updates ..
Xauusd Gold Next SetupXauusd Gold Next Setup
This Analysis is based on Educational Purposes on base of technical Analysis
Key Point : 4236 - 4221.00 for bullish

Is the sharp drop in gold a sign of a bearish trend?Gold rallied to 4379 after opening on Friday, then rebounded above 4370 after experiencing two crashes. The market generally expected gold to break through the 4400 mark. Although one of the two crashes resulted in a drop of over 100 points, this did not spur a further return of bears. Instead, the strength of the rebound gave the market bullish confidence. The subsequent crash immediately wiped out all the buying. As I mentioned in my previous two articles, everyone expected the price to rise again after falling.
The crash after the surge was actually expected. Whether it was the US government shutdown, rising expectations for an October rate cut, or the trade war and Russia-Ukraine spurring risk aversion, bullish momentum was constantly building. It was primarily driven by capital seeking to push up gold prices. Otherwise, the news had some impact, but not this significant. It's true that the Russia-Ukraine conflict hasn't escalated out of control. While a Fed rate cut is highly likely, the market had already priced in the news. Unless it's a significant rate cut, the impact will be limited. As for the US government shutdown, while it has an impact on the US economy, it's more of a civil war between the two parties, so the impact is also limited. As for tariffs, after all, they haven't been implemented, and there's no question of how much risk aversion they'll generate. Negotiations will happen anyway. Even combined, these various pieces of information wouldn't have spurred gold prices that much. After all, this month's rise from 3819 to 4379 is 560 points, and this week's rise from 4002 to 4379 is nearly 380 points. This is purely a malicious push.
So is this bull market in gold over? This recent correction has been particularly strong, prompting many to question whether gold has peaked. However, it's premature to call it a peak, and we shouldn't blindly dismiss the current strong trend. After all, the news hasn't yet signaled a significant decline, and the aforementioned events haven't been effectively addressed. Looking at the one-hour and four-hour charts, support remains near 4180 and 4160. Only a break below these levels will trigger further downside, two areas we need to watch in the short term. Upward pressure is currently at 4280-4300. If it breaks through these levels again, it's likely to revisit the previous highs. A break below these levels could lead to a push towards 4500.
Next Week's Trading Strategy:
Gold's focus is now on the 4280 area, which is currently the dividing line between bulls and bears. If gold fails to break through 4280 in a rebound next week, continue shorting gold on rallies. If gold ultimately breaks through and stabilizes at 4280 amidst the weekend's risk-averse rally, then bulls will return. Currently, gold is still trading below 4280, so continue shorting on rallies at the beginning of next week while under pressure at 4280.
If you're feeling lost and unsure about where to go in this market, follow my updates and my channel. I'll provide daily updates for your reference, including details on the execution of long- and short-term trades. If you'd like, please share your current positions so we can analyze whether it's safer to hold on or adjust and change positions in a timely manner.
Next week's trading plan is about to begin. If you have any trading questions (wanting to recover losses or increase profits), please feel free to contact me.
Thank you to everyone.
Gold is Ready for a Selling Retracement Hello Traders
In This Chart GOLD HOURLY Forex Forecast By FOREX PLANET
today Gold analysis 👆
🟢This Chart includes_ (GOLD market update)
🟢What is The Next Opportunity on GOLD Market
🟢how to Enter to the Valid Entry With Assurance Profit
This CHART is For Trader's that Want to Improve Their Technical Analysis Skills and Their Trading By Understanding How To Analyze The Market Using Multiple Timeframes and Understanding The Bigger Picture on the Charts

XAUUSD Analysis todayHello traders, this is a complete multiple timeframe analysis of this pair. We see could find significant trading opportunities as per analysis upon price action confirmation we may take this trade. Smash the like button if you find value in this analysis and drop a comment if you have any questions or let me know which pair to cover in my next analysis.

BUY GOLD - XAUUSD- Amazing low risk high reward trade!Based on our deep analysis we can see that GOLD - XAUUSD will head to the upside. Great time to buy - it has broken major resistance levels + trends.

#XAUUSD:$4200 Almost Hit, Our New Target Is $4500! Dear Traders,
Gold has been extremely bullish since our previous analysis. The US has imposed a 100% tariff on China which has caused fear within the global trading community. Our next move is to wait for the price to retest whether minor or major. Once we have confirmation, we can target our next move.
Team Setupsfx
