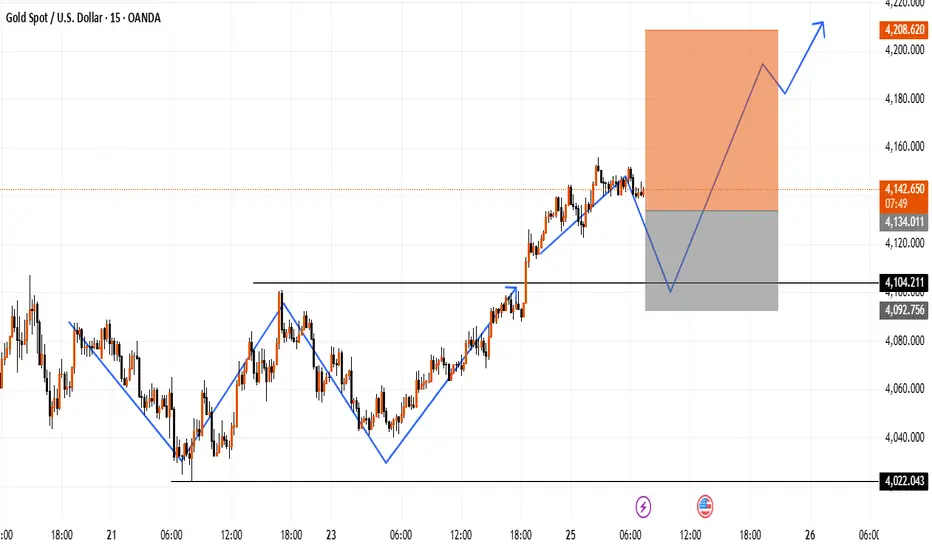
XAUUSD 1h chart levels for the coming week 24 to 28 November
FOREXCOM:XAUUSD
Hey Everyone,
Please see My updated 1h chart levels and targets for the coming week 24 to 28 November
The price closed on 4065 so If the price BREAKOUT UP this area for will open 4093.
The 4061 & 4067 reversal zone and key decision points; if breached, it becomes the path to 4125.
Weekly close at a 90-degree angle from the peak of 4036
If it breaks through with momentum, it will head towards 4004-3998 as it shown on the chart
The week should move like this
Monday should move to 135° degrees (down to 4036 or up to 4093)
Tuesday 150° degrees (if it moved down we will see 4006 & if up will see 4102) First move 150° and We will see rejection of a Strong price when the (moon & sun & Mercury meet I call it = Test Price Day)
Wednesday 160° degrees ((if it moved down we will see 4004 & if up will see 4125 and then 4157) If the price touches the 180-degree angle, it is heading towards a volatile day followed by a strong rise or fall.
Thursday 170° degrees (the price will move between 4125-4157) and if the price moved down wee will move 225° degrees between 4036-4006) A day approaching the peak or undermost, not a reversal day.
Yousif
H-k-O-r-E
Xauusdanalysis

XAUUSD – Bullish Structure Retest Zone and Potential Upside ContXAUUSD is currently holding a clean bullish market structure. Price has completed a pullback toward a previous reaction zone, where buyers have shown interest before. If the structure remains intact, the market may continue moving upward after stabilizing above the highlighted support region.
The chart shows:
A clear sequence of higher highs and higher lows
A corrective move approaching the support area
A potential continuation path toward the upper zone if momentum strengthens
This is a technical observation only, based strictly on structure and levels shown on the chart.
Prices are trending upwards. Continue to break through.The hourly chart for gold shows that after a sustained price increase, it rose again to around 4156 in the Asian session, approaching a key trend resistance level. Due to the recent market consolidation and lack of momentum after the continuous rise, a pullback occurred as expected during the European session, reaching a low of 4109, close to the 38.2% Fibonacci retracement level of Monday's gains. Currently, the price has rebounded but failed to break through the Asian session high, and the overall trend remains consolidating.
The 1-hour moving averages have formed an upward golden cross and are diverging, indicating that gold bulls still have some upward potential. Even though safe-haven demand has eased, the price is holding firm around 4100, where a strong support level has formed.
In terms of trading strategy, it is recommended to pay close attention to the performance of the support area below. If the price stabilizes at 4109 and forms a double bottom, long positions can be considered, corresponding to the support of the 5-day and 10-day moving averages on the daily chart.
The upside resistance level to watch is the 4155-4160 area. If it can be broken through effectively, it may further test the 4200 level. In the short term, prices are expected to remain above 4100, indicating a continued strong market. However, if this level is breached, the market may shift to a weaker, more volatile trend, increasing the risk of short-term market corrections.
Trading Strategy:
Buy gold at 4110-4120, with a stop-loss below 4100, targeting 4150-4160; after a breakout, watch the 4200 level.
If gold breaks and holds above 4150 again, it may challenge the 4200 level. Is gold poised for a rally? I will adjust my strategy flexibly based on market fluctuations and update the information in the channel.

gold await breakout#XAUUSD price have shown its still on bullish zone, now we await for rejection above 4160 to sell, also the 4140 holds sell-4127.
Sell limit at 4160, target 4100, SL 4172
Below 4140 on H1 reverse can sell, also 4127 breakout continuation.
Above the rectangle 4174-75 holds bullish H1 close till 4200.

Awaiting data release. Short-term strategy.On Monday, gold consolidated above 4040, then maintained a slow upward trend throughout the European session, briefly surging above 4090 in the US session. Reaffirmed support for a December rate cut by two Federal Reserve officials provided momentum for a new round of gains, accelerating after breaking through the key 4100 level, reaching a high above 4130. The current correction appears to be over, and gold prices may be poised for a new upward trend.
On Tuesday, at the Asian open, gold prices retreated slightly from around 4133 to 4122 before rebounding, reaching a high of 4155 before pulling back. The short-term strategy is to buy on dips.
The 1-hour chart shows that the price has rebounded strongly and is generally trading above the MA10 moving average. The best short-term strategy is to go long around this moving average, with the best entry point around 4125-4135. It is important to note that the bullish defense should be set below 4120. If the price retraces below this level, it indicates that the market is not as strong as it seems. A further decline could test the 4105 area, which would present a second buying opportunity.
If a rebound begins around 4125, 4155-4160 will be a strong resistance level. A break above 4160 could accelerate the upward movement to 4180-4190.
Short-term trading strategy:
Buy gold on pullbacks to 4125-4130. As time progresses, if the European session doesn't see a pullback to this level, consider buying at 4130-4135, with a stop-loss below 4120. Profit targets are 4160-4170.
A crucial point to note is the large amount of data released today. Timely profit-taking is essential to avoid losses due to trend reversals caused by the data releases.

XAUUSD – Bearish Reversal Setup Toward Liquidity TargetsChart Analysis
Your chart shows a potential bearish reversal on XAUUSD with a clear smart-money structure. Here’s the breakdown:
1. Market Structure
Multiple Breaks of Structure (BOS) and Change of Character (ChoCH) indicate a shift from bullish momentum to bearish intent.
Price made a final sweep / liquidity grab at the recent high before sharply dropping into your marked entry zone.
2. Entry Zone
The “ENTRY” mark aligns with:
A bearish mitigation zone from the last up-move
A distribution pattern forming (rounded top + BOS)
This suggests institutional selling activity.
3. Target One – 4,080.064
This level is a logical first target because:
It aligns with previous demand acting as newly created liquidity.
You expect a corrective pullback before continuation—your white zig-zag path reflects this.
4. Target Two – 4,040.652
A deeper liquidity pool and the next major imbalance area.
If price breaks Target One, momentum likely accelerates.
This is the main downside liquidity sweep zone.
5. Context
The shaded half-circle structures highlight swing points where price formed lower highs, reinforcing the bearish narrative.
The clean equal-lows and imbalances under price give strong bearish draw-on-liquidity.

XAUUSD – TUESDAY PRIORITIZE BUYING ON BREAKOUT, WATCH FOR ...💛 XAUUSD – TUESDAY PRIORITIZE BUYING ON BREAKOUT, WATCH FOR REACTION AT FIBO 1.618–2.618 🎯
🌤 Overview
Hello everyone, Lana here 💬
After several days of being compressed in a triangle pattern, gold has broken the downtrend line on H1, reclaimed liquidity around the FVG area, and continues to hold above the breakout zone. This indicates that the money flow is prioritizing a short-term upward scenario, targeting the upper Fibonacci extension areas.
Today the market awaits a series of important data: CPI, PPI, sales figures… – these numbers can cause strong volatility, especially when gold is in an "overcrowded trade" state. If US consumer data is positive, the price may experience a deep correction after sweeping liquidity.
💹 Technical Analysis (ICT perspective)
On H1, the price has: Broken the downtrend line of the accumulation triangle.
Retested the FVG area + liquidity repurchase around 4.101–4.105 and bounced back.
The 4.133–4.135 area is now a resistance that has been breached and is turning into support – suitable for a buy on dip strategy.
Technical target: Fibonacci Extension 1.618 of the current upward move is around 4.16xx,
Fibonacci Extension 2.618 + large liquidity zone is above the 4.23xx–4.24xx area, coinciding with the old peak – where a strong reaction from sellers is likely to occur.
Overall, as long as the price remains above the 4.10–4.11 area, the short-term upward structure is maintained.
🎯 Reference Trading Plan
💖 BUY Scenario – prioritize following the trend
Buy on breakout – current price area
Entry: 4.130–4.133
SL: 4.125
TP: 4.150 → 4.175 → 4.198 → 4.230
Buy when price retests deeper
Entry: 4.100–4.103
SL: 4.095 (you may consider a tighter SL instead of 3.995 to optimize R:R)
TP: 4.125 → 4.150 → 4.175 → 4.198
💢 SELL Scenario – only a short-term reaction at resistance
Sell: 4.167–4.169
SL: 4.175
TP: 4.150 → 4.133 → 4.110 → 3.990
This Sell order is only for scalping against the trend, prioritize quick profit-taking when reaching nearby TP areas.
⚠️ Important Notes
Today there are CPI, PPI, sales figures, and other US data – spreads may widen, prices can swing both ways.
Gold is a crowded trade, so after hot upward moves, a deep sell-off is likely to shake off weak positions.
Reasonable strategy: Prioritize buying with the trend at identified support areas.
Reduce volume before news time, do not hold through the release of important data.
Sell should only be considered as a short, quick trade.
🌷 5. Conclusion & Interaction – with LanaM2
In summary, the breakout from the triangle on H1 supports the scenario of gold continuing to rise towards the Fibo 1.618–2.618 area, as long as the price stays above the 4.10–4.11 area 💛
Today, focus on finding a good buying point instead of chasing the price, and be especially cautious when CPI, PPI data is released.
If you find this useful, please 💛 Like – 💬 Comment – 🔔 Follow LanaM2 to update the gold perspective with me every day on TradingView ✨

Gold Price Outlook – Trade Plan (XAU/USD)📊 Technical Structure
OANDA:XAUUSD Gold (XAU/USD) has extended its rebound and is now trading above $4,140, firmly recovering from last week’s weakness. Price has successfully reclaimed the broken descending trendline and is stabilizing above the $4,124–$4,135 support zone, turning the short-term structure into a bullish continuation pattern.
Key observations:
Support is located at $4,124–$4,135, where trendline retest + horizontal demand converge.
Resistance sits at $4,171–$4,182, the key zone from November highs.
As long as the price holds above $4,124, buyers remain in control and dips are likely to attract bids.
A pullback toward the support zone is expected to bring buyers back into the market, aiming for a retest of the $4,170–$4,180 zone.
🎯 Trade Plan
Bias: Buy-the-dip near support, targeting continuation toward resistance.
Entry: $4,124 – $4,135
Stop Loss: $4,120 (below support & structure invalidation level)
Take Profit 1: $4,171
Take Profit 2: $4,182
Risk-Reward Ratio: ~1 : 2.82
Short-term bias:
Above $4,120 → Bullish continuation valid
Below $4,120 → Bullish structure invalid, stand aside
🌐 Macro Background
Gold extends its rally to a 1.5-week high, supported by rising expectations of a Federal Reserve rate cut in December. FXStreet notes:
New York Fed President John Williams signalled rates could fall in the near term.
Fed Governor Christopher Waller said the labour market is weak enough to justify another 25 bps cut in December.
CME FedWatch now shows ~80% probability of a December cut, suppressing USD strength and supporting Gold.
Meanwhile, geopolitical tensions continue to fuel safe-haven demand:
Russia launched new strikes on residential and energy facilities in Kyiv.
The US is modifying its Ukraine peace plan, which may be unacceptable to Russia.
Gaza ceasefire allegedly violated multiple times, sustaining market uncertainty.
While equities remain broadly positive (limiting upside momentum), the macro environment still favours buying dips on Gold.
🔑 Key Technical Levels
Resistance Zone: $4,171 – $4,182
Support Zone: $4,124 – $4,135
Pivot Zone: $4,150
Bullish Invalidation: $4,118 – $4,120
📌 Trade Summary
Gold maintains a bullish short-term structure, supported by Fed rate-cut expectations and heightened geopolitical risk. The preferred strategy is buying dips into $4,124–$4,135, targeting a retest of $4,171–$4,182.
As long as price stays above $4,120, bulls maintain an advantage.
⚠️ Disclaimer
This analysis is for reference only and does not constitute trading advice. Trading involves significant risk, and proper risk management is essential.

HOW FAR WILL GOLD RISE?1. MARKET CONTEXT
Yesterday, during the Asian and European sessions, gold prices mainly moved sideways – accumulating within a narrow range.
In the U.S. session, gold prices broke strongly through the 413X region and formed:
Inverse Head and Shoulders pattern (iH&S)
The upward structure returns → buyers dominate
This indicates that the upward momentum has returned, and the market leans towards continuing to rise if it does not break the important support area.
Fundamental factors supporting buyers
The market is expecting the Fed to cut interest rates in December.
Tonight there is PPI news — an important indicator directly affecting inflation expectations and Fed expectations.
→ This could be a catalyst for strong volatility in the U.S. session.
2. MAIN TRADING DIRECTION FOR THE DAY
➡️ Prioritize BUY (look to buy) according to the main trend.
➡️ SELL is only reactive – for retracement, not the main trend.
3. POTENTIAL BUY ZONES
Beautiful support areas to look for buying opportunities today:
📍 BUY zone 1 – Nearest
413X (early day resistance and yesterday's breakout area)
→ Beautiful entry area for scalping or buy follow trend.
📍 BUY zone 2
4100 – 4103
→ Psychological support & structural confluence area.
📍 BUY zone 3
4088 – 4090
📍 BUY zone 4
4060 – 4065
→ Strong support area, look to catch the bottom in case of deep price correction.
4. REACTIVE SELL ZONES (ONLY SELL FOR RETRACEMENT)
Only sell when price hits the area — clear rejection signals appear:
📍 SELL zone 1 (nearest)
4180 – 4186
📍 SELL zone 2
4190 – 4195
📍 SELL zone 3
4202 – 4205
Safe SELL conditions:
Only sell counter-trend, prioritize scalping.
If these areas are strongly broken + H1/H4 candle closes, consider buyers winning, then do not sell anymore.
5. CAPITAL MANAGEMENT – RISK MANAGEMENT
SL = 10 points
TP = 10 points
RR ratio = 1:1.2
Do not hold positions through PPI news if not really sure about the pattern.
6. NOTES ON METHOD
Buy orders will dominate the day.
Sell only when there is a strong reaction at resistance.
Scalping: open orders on smaller timeframes (M1–M5–M15) to optimize Entry.
Always wait for price action confirmation (pinbar, engulfing, retest…) before entering orders.
7. SUMMARY
Today's tendency is mainly BUY, based on:
The return of the upward trend
Inverse Head and Shoulders pattern
Expectations of a dovish Fed
PPI news triggering volatility
Wishing everyone an effective trading day — total victory! 🔥💹

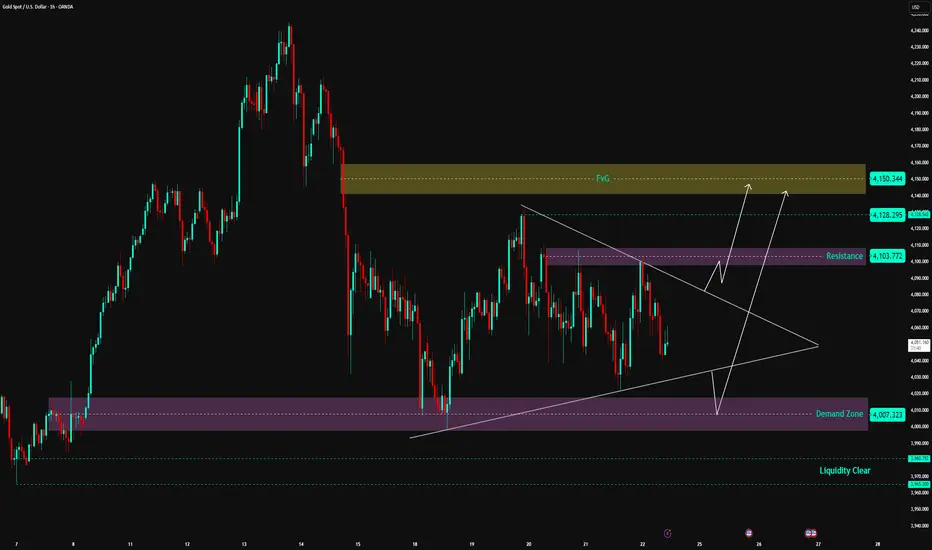
XAUUSD | Gold Set to Explode from Triangle Pattern—Act Now!📊 Market Structure
Gold is entering a tight accumulation phase within a Symmetrical Triangle pattern – indicating compression before a strong breakout.
On the downside, the price is still supported by the Demand Zone 4,007 – 4,020 USD , which is the main support area for the medium-term uptrend structure.
On the upside, the Resistance Zone 4,103 – 4,110 USD continuously exerts pressure, causing price rejection.
Currently, gold is trading right in the middle of the compression triangle → the market is preparing to choose a direction.
Looking at the wave structure, the trend slightly leans towards a break up to sweep liquidity in the high area.
💎 Key Technical Zones
• ⭐ FVG Supply Zone: 4,128 – 4,150 USD → expected strong reaction area if price breaks up
• 🟣 Resistance Zone: 4,103 – 4,110 USD → decisive area for direction
• 🟪 Demand Zone: 4,007 – 4,020 USD → strong base maintaining structure
• 🟦 Liquidity Clear: 3,980 USD → risk area if price collapses the triangle
🎯 Trading Plan – Two Possible Scenarios
1️⃣ BUY – Wait for Breakout from Triangle (priority scenario)
If the price breaks the resistance zone 4,103 – 4,110 with a strong H1 closing candle:
• Entry: 4,112 – 4,115
• SL: 4,095
• TP1: 4,128
• TP2: 4,145
• TP3: 4,150 (reach FVG)
→ This is a trend-following setup, with a high probability of sweeping liquidity above after the break.
2️⃣ BUY – Retest Demand Zone 4,007 – 4,020
If the price continues to follow the triangle pattern and falls to the trendline + demand zone:
• Entry: 4,010 – 4,017
• SL: 3,990
• TP1: 4,103
• TP2: 4,128
• TP3: 4,150
→ This is a very strong confluence area between Demand Zone + Trendline + pattern base.
❌ SELL? When is it valid?
Currently, selling is not prioritized, as the price is still above the Demand Zone and the larger structure still favors an uptrend.
Selling is only valid if the price:
• Breaks strongly below 4,007 USD
→ At this point, the market turns bearish, with a distant target of 3,980 USD.
🧠 Vincent’s View
Gold is under strong compression. When the triangle pattern is broken, the move will be extremely fast and decisive.
The current trend leans towards breaking up and heading straight into the FVG area 4,128 – 4,150 USD.
Just be patient and wait for the confirmation candle — don’t predict, react to the market.
⚡ “Breakout is born from pressure — patience profits.”
⏰ Timeframe: 1H
📅 Update: 24/11/2025
✍️ Analysis by: Captain Vincent
XAUUSD Wait for the pull back for the next long entry Gold surged to the nearest resistance, XAUUSD Wait for the pull back for the next long entry

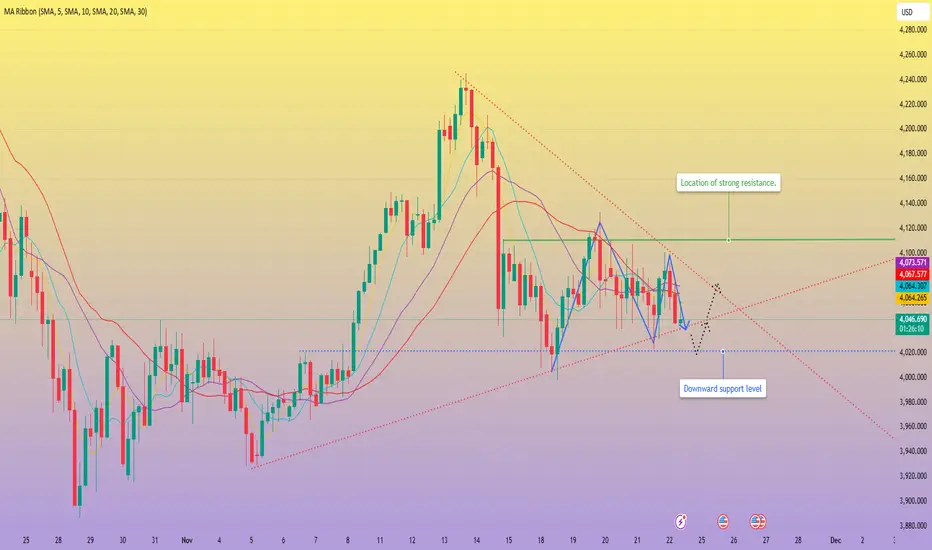
Gold continued its upward trend. Watch for key resistance levelsThe current 4-hour chart for gold shows that short-term moving averages are continuously overlapping and the trend is flat, indicating that the market's bullish and bearish forces are in a state of temporary equilibrium.
Price fluctuations are mainly confined to a large range of 4000-4130. Looking at the 1-hour chart, the previous Fibonacci retracement levels remain valid, with the key resistance level still at the psychological level of 4100. Therefore, a shorting strategy can be considered at this level.
If the price breaks through 4100, pay close attention to the 4130 level. This level is both a key resistance point from the previous period and a key resistance level of the daily trend line. Therefore, you can look for this level to enter a short position after the first resistance is broken.
Looking at the MACD indicator, no clear trend has emerged, which means that the direction of gold's price movement is still uncertain. We should pay attention to the divergence in the market going forward.
In terms of trading, it is recommended to focus on the adjustment and correction process of short-term technical indicators. Selling on rallies within the range is advisable. The first resistance level to watch is around 4100. If a significant breakout fails to occur, the price will likely return to range-bound trading.
Trading Strategy: Short positions can be initiated in batches around 4100-4110, with a stop-loss at 4120 and a profit target of 4070-4060.
If the price breaks through 4110 decisively, consider shorting again around 4135.

XAUUSD | The Art of the Trap: Mastering Bearish Model #1Trading isn't about guessing where the price goes next; it's about reading the story every candle tells. Today, we are breaking down a classic Candle Range Theory (CRT) setup on Gold (4H), combining structural liquidity runs with Smart Money cues.
Here is the breakdown of the Bearish Model #1 shown in the chart:
1. The Trap: Turtle Soup 🐢
The first step of this setup is the "Turtle Soup." As seen on the chart, price briefly stabs into an old high to trap breakout traders and run buy stops. As the CRT method teaches, "Turtle Soup is when the market tricks traders by briefly breaking through a level, then reversing". This provides the fuel for the move down.
2. The Secret Signal: SMT Divergence 📉
Notice the line marked "SMT: XAG". This stands for Smart Money Technique. While Gold (XAU) pushed higher, Silver (XAG) likely failed to confirm that high.
The Rule: "When two related markets don't move together, it's a secret signal from smart money".
The Implication: This hidden weakness suggests big players are distributing positions.
3. The Entry: Model #1 Confirmation 🚪
We aren't just selling blindly at the top. We are waiting for the Model #1 confirmation.
The Setup: We identify the "thick up-close candle" (the strong white candle) that formed prior to the drop.
The Trigger: The entry activates when price closes BELOW this specific candle. This confirms the reversal is real.
The Confluence: This setup is occurring inside a Fair Value Gap (FVG). As the CRT guide states: "When Model #1 appears with an FVG... it becomes even more powerful".
4. The Objective: Range Low (RL) 🎯
Once the trap is set and the entry is confirmed, we target the opposing liquidity. In a Bearish Model #1, we "target the next lows below". The chart marks this clearly as RL (Range Low).
🧠 Trader's Mindset: Remember the golden rule of CRT: "Wait for the close. Don't enter early!". The market is designed to trap impatient traders during the "Manipulation" phase of the candle. Let the candle close confirm your bias.
Disclaimer: This analysis is based on Candle Range Theory concepts for educational purposes. Past performance is not indicative of future results.
Next Step for You: Look at your current charts—can you spot a "Turtle Soup" (fake breakout) that happened recently on the 1H or 4H timeframe? Let me know in the comments! 👇

ElDoradoFx – GOLD ANALYSIS (24/11/2025, ASIA SESSION)1. MARKET OVERVIEW
Gold pushes into Asia with strong bullish momentum after the US session rally that broke above multiple intraday structures and tagged the $4,140 High.
The market is currently showing:
• A bullish continuation structure, but overextended on short-term TFs.
• Daily trend intact above $4,032, with price building compression for a larger breakout.
• Asia likely to retrace toward discounted zones before continuation.
Bias: Bullish but expecting pullback first.
⸻
2. TECHNICAL BREAKDOWN
🔹 Daily (D1)
• Price respecting the daily support zone $4,032–$4,040.
• RSI mid-range (~52) = room for continuation upward.
• Structure remains bullish; compression could lead to a breakout toward $4,200–$4,308.
🔹 H1
• Strong breakout above EMA200 + trendline confluence.
• Price tapped $4,140 Weak High, now pulling back.
• As long as price holds above $4,120–$4,122, bulls remain in control.
🔹 15M–5M
• Clean bullish BOS chain.
• Indicators show exhaustion after the US rally.
• Expect retracement to FVG / Golden Zone before next leg up.
⸻
3. FIBONACCI ANALYSIS (Golden Zone)
Last swing:
$4,099 → $4,140
• 38.2% → $4,124
• 50.0% → $4,119
• 61.8% → $4,114
🎯 Golden Zone: $4,124 – $4,114
→ Primary discounted buy area for Asia session.
⸻
4. HIGH-PROBABILITY TRADE SCENARIOS
📈 BUY SCENARIOS (Primary Bias)
A) Standard Buy Setup (Pullback)
Buy Zone: $4,124 – $4,114
🎯 Targets:
• TP1 → $4,132
• TP2 → $4,140
• TP3 → $4,148
• TP4 → $4,161
🛑 SL: Below $4,109
⚡ Confirmation: 5M CHoCH + EMA retest.
⸻
📈 BUY BREAKOUT SETUP
Trigger: Break & H1 close above $4,140
Retest: $4,135–$4,137
🎯 Targets:
• $4,148
• $4,161
• $4,176
🛑 SL: Below $4,132
⸻
📉 SELL SCENARIOS (Countertrend only)
A) Sell From Supply Zone
Sell Zone: $4,140 – $4,148
🎯 Targets:
• $4,132
• $4,124
• $4,114
🛑 SL: Above $4,161
⚡ Look for divergence + rejection wick.
⸻
📉 SELL BREAKOUT SETUP
Trigger: Break below $4,114
Retest: $4,118–$4,120
🎯 Targets:
• $4,109
• $4,099
• $4,088
🛑 SL: Above $4,124
⸻
5. FUNDAMENTAL WATCH
• Asia expected to be quiet → lower volume → cleaner pullbacks.
• Market preparing for mid-week US macro events.
• DXY showing weakness, supporting gold’s bullish bias.
• Watch for manipulation around $4,140 (weak highs often swept).
⸻
6. KEY TECHNICAL LEVELS
Resistance: 4,140 / 4,148 / 4,161 / 4,176
Support: 4,124 / 4,119 / 4,114 / 4,109
Golden Zone: 4,124 – 4,114
Breakout Buy Trigger: > 4,140
Breakout Sell Trigger: < 4,114
⸻
7. ANALYST SUMMARY
Gold remains in a bullish continuation structure with higher targets unlocked after the US rally.
Asia session is likely to produce a retracement into discounted zones before any attempt to break the $4,140 high.
As long as $4,114 holds, the bullish narrative remains intact.
⸻
8. FINAL BIAS SUMMARY
📌 Bullish above $4,114
📌 Bearish only if price breaks and closes below $4,114
⸻
🥇 ElDoradoFx PREMIUM 3.0 – PERFORMANCE 24/11/2025 🥇
⚡ Precision Trading. Zero Drawdown.
📉 SELL +40 PIPS
📉 SELL LIMIT +70 PIPS
📈 BUY +210 PIPS
📈 BUY +20 PIPS
🕐 BUY LIMIT – Not Activated
━━━━━━━━━━━━━━━
💎 SWING TRADES – STILL RUNNING
🔵 BUY (from 05/11) → +2,850 PIPS
🟣 BUY (from 05/11) → +1,320 PIPS
📊 Long-term precision continuing to deliver massive momentum.
━━━━━━━━━━━━━━━
💰 TOTAL PIPS GAIN: +340 PIPS
🎯 5 Signals → 5 Wins
🔥 100% Accuracy Today
━━━━━━━━━━━━━━━
Congratulations if you profited!
✅📈🔥 Let’s keep dominating the market this week! 🚀
— ElDoradoFx PREMIUM 3.0 Team 🚀

XAUUSD: Running flat, bias is bearish.
Wave count targets 3890.64 and 3745.24, invalidation at 4134.32. Structure is unresolved risk entries are possible, but confirmation still needed. If invalidation occurs, support may develop near 0.618(4154.04) and 0.764(4188.76) Fibonacci retracement.
Count valid below 4134.32
Bearish bias
Monitoring fib pivots for alternate scenario

Gold (XAUUSD) – H1 Market OutlookOn the H1 timeframe, Gold is currently showing consolidation around the 4120 zone, reflecting a pause after recent volatility. This area is acting as a short-term decision point where buyers and sellers are balancing out.
From a structural perspective, the current candles are leaning toward bearish momentum, suggesting that sellers are gradually building pressure. If this momentum continues, the price may revisit key intraday levels such as the 4100 zone as the first area of interest. A sustained move below this region could open the way toward deeper liquidity areas around 4080, and potentially extend into the broader demand zones near 4050–4030, where market participants have previously shown reaction.
For risk management in scenario-based analysis, the 4150 region remains an important invalidation zone, as a clear break above this structure may signal a shift in momentum or trend strength.
This outlook is shared purely for educational and analytical purposes, based on observable chart structure and price behavior. It should not be taken as financial advice or a buy/sell signal. Always confirm direction with your own analysis and risk approach.

How to choose a direction at the end of a triangular formation#XAUUSD TVC:GOLD OANDA:XAUUSD
Although gold is still in a volatile market in the short term, its current trend has entered the end of a converging triangle pattern, and the market is getting closer to choosing a direction.
The market has recently been driven primarily by news, and the current geopolitical tensions, coupled with the stalled Russia-Ukraine peace talks, may trigger a new wave of risk aversion. Therefore, during the European session, we can consider going long on gold when it retraces to the 4040-4030 range.

Elise : XAUUSD 2H — Breakout Retest Accumulation Setup |OANDA:XAUUSD
Key Scenarios
✅ Bullish Case (Primary)
A confirmed break and hold above 4135–4150 supply opens the door for bullish continuation toward:
🎯 Target 1: 4281
🎯 Target 2: 4374 (extended trendline & previous rejection zone)
Bullish structure remains valid above 4035.
❌ Bearish Case (Invalidation)
A clean close below the demand zone 4030–4000 would signal weakness, potentially sending price toward:
Current Levels to Watch
Demand Zone: 4035–4060
Supply / Breakout Zone: 4135–4150
Extended Resistance: 4281 / 4374
⚠️ Disclaimer:
This analysis is for educational purposes only — not financial advice. Always manage risk.

GOLD Bullish Bias!
HI,Traders !
#GOLD is making a bullish
Rebound from the support
Cluster of rising and horizontal
Support levels so as Gold is
Trading in an uptrend we are bullish
Biased and we will be expecting
A further bullish move up !
Comment and subscribe to help us grow !

Data week. Focus on trend continuation.This week's intensive data release could be a catalyst for market volatility:
Due to data delays caused by the government shutdown, a large amount of economic data will be released this week. Tuesday: September PPI, September retail sales, October pending home sales. Wednesday: Durable goods orders, Q3 GDP preliminary estimate, PCE price index, new home sales, initial jobless claims. The market will be closed on Thursday for Thanksgiving, and there will be no major data releases on Friday.
Market Analysis:
Gold initially fell before rising on Friday, briefly dipping to the 4022 level before a bullish reversal, and has been hovering around the previous resistance level of 4100 for an extended period. Currently, there is no clear direction.
The daily chart shows that since encountering short-term resistance at 4110, each attempt to bottom out has been followed by a rebound. Therefore, this is a strong rebound, not a reversal. However, without significant positive news, further upward movement at the previous resistance level of 4110 will be difficult.
In the short term, the key level to watch is the breakout of the triangle pattern. Support is at $4020, and resistance is at $4110. A breakout from this range will likely lead to further continuation of the trend.
After rebounding last Friday, it failed to hold $4,100. The highs have been moving lower and the lows have been moving higher, and the trading range has begun to narrow. This is a good thing, meaning that a one-sided trend is coming soon.
Short-term trading strategy:
Buy in batches between 4020 and 4030, with a stop loss at 4010. The profit target is the resistance level at 4100.
Short sell with a small position when the price first touches around 4110, aiming for a profit of 40-50 points.
goldawaitbreakout#XAUUSD we await price for breakout above the 4077 to buy, above 4087-89 holds confirmation on buy once M15-H1 close above.
Buy limit 4077, target 4095-4109, SL 4065.
Below 4063 holds strong bearish continuation which will target 4031.

Elliott Wave Analysis XAUUSD – November W4, 2025
1. Momentum
W1 – Weekly timeframe
Weekly momentum is showing early signs of a reversal. If next week forms a confirmed bullish weekly candle, the market may enter 4–5 consecutive bullish weeks, pushing weekly momentum into the overbought zone.
D1 – Daily timeframe
Daily momentum continues to rise, suggesting the market may experience 1–2 more days of upward movement before reaching the overbought region.
H4 – 4-hour timeframe
H4 momentum remains bullish, indicating that Monday is likely to show a continuation of upward movement or sideways consolidation.
________________________________________
2. Elliott Wave Structure
Weekly Structure (W1)
The last three weekly candles are bullish, but not strongly decisive:
• Two candles have short bodies
• One is a bullish candle with an upper wick
This behavior suggests the market is completing wave X (purple). Therefore, the main expectation is a continued decline to complete wave Y (purple) toward the lower target zones. Once wave Y finishes and weekly momentum confirms reversal, a new major bullish trend is likely to begin.
________________________________________
Daily Structure (D1)
• Wave X (purple) is likely complete.
• Price is now progressing within wave Y (purple).
Inside wave Y:
• Wave 1 (red) appears to have finished.
• Price is currently in wave 2 (red) or has already started the early phase of wave 3 (red).
🔸 Key confirmation level:
A break below 4001 would confirm that the market has entered wave 3 (red), leading to a sharp and decisive decline.
🔸 Alternative scenario:
Because D1 momentum is still rising, wave 2 (red) may be forming a WXY corrective pattern (green zigzag), meaning the market may still produce a final upward swing before the next strong decline.
________________________________________
3. H4 Wave Structure
At the moment, there are two scenarios in line with the D1 structure:
• The market may already be in the early phase of wave 3 (red).
• Or price is completing the final leg of the WXY correction of wave 2 (red) (indicated by the green zigzag).
The zone around 4081 currently acts as the balance area, also the region with the highest traded volume (green POC line).
• If price stays below 4081 during Monday, the probability favors wave 3 (red), meaning strong support zones 4020 and 3958 are likely to break.
• If price stays above 4081, upside targets at 4145 and 4184 become ideal levels for completing wave 2 (red).
________________________________________
4. Trading Plan
📌 Preferred Limit Sell Zones:
• 4145
• 4184
📌 Direct Sell Zone:
• 4020 → only valid if a strong H4 candle closes below 4020, followed by a retest.
A more detailed trading plan will be updated on Monday, once fresh market data becomes available.

XAUUSD - Time to buy gold!XAUUSD (GOLD) was recently in a short term downtrend for a few weeks but has now shown some clear bullish movements ahead. XAUUSD (Gold) has broken out of a downward trend channel that was acting as strong resistance, The price is very likely to head to the next strong resistance level which is marked as the take profit zone (green line). Time to buy!
