Gold Analysis Today 3 Nov | XAUUSD Forecast | Smart Analysis🟡 GOLD ANALYSIS What’s Moving the Market Today?
📅 Updated: November 3, 2025
💎 Trade with DECRYPTERS
⚡ Market Snapshot
Gold is holding steady near the $4,000 pivot after Friday’s weaker jobs data.
📉 DXY slips to 99.73 after a soft October payrolls print (+22K vs. 150K exp).
🏦 Fed’s 25bps cut to 3.75–4.00% with no clarity on December weighing on yields.
🌍 Central banks continue heavy gold buying: +19t in August, +220t in Q3 (Poland & Azerbaijan lead).
💥 Geopolitical tensions & tariff risks are keeping safe-haven demand elevated.
📈 ETF inflows: +222t in Q3 offset jewelry weakness investment demand remains strong.
🧠 Smart Money & Technical Framework
🟧 Gold Sell Area: 4026 – 4038
🔴 Smart Money Sell Zone: 4071.8 – 4085
🟨 Gold Buy Area: 3964 – 3978
🟢 Smart Money Buy Zone: 3912 – 3922
💬 Millions of orders clustered across these zones watch for liquidity sweeps before reversals.
📊 Live Market Context
💰 Current Price: ~$4,017/oz (+0.16%)
📉 Daily Range: High ~4,015 / Low ~3,991
🔁 Structure: Gold consolidating within key SMC range; breakout above 4,038 opens path to 4,071+, while rejection near 4,085 favors short setups back to 3,978–3,964.
🔍 What to Watch Next
📆 Nov 13 CPI (core ~3.0% exp)
Hot print → Fed pause → bearish for gold
Soft print → renewed cut bets → bullish continuation
🏦 ECB & BOJ meetings this week:
Dovish tone = USD weakness → supports gold
🌏 US–China trade rhetoric:
Optimism fades → safe-haven spike
Renewed deal talks → short-term pullback
🧭 Trading Plan — Keep It Simple
🔹 Buy Zone (3964–3978): Look for bullish reaction; smart money likely absorbing liquidity.
🔹 Sell Zone (4026–4038): Ideal to fade rallies if momentum stalls.
🔹 Smart Money Extremes (3912 / 4085): Expect deep liquidity grabs before reversals.
🎯 Targets: 4,071 (resistance) / 3,964 (support).
❗ Bias: Mildly bullish above 4,000 dips to buy, rallies to fade.
🏁 Conclusion
Gold remains range-bound between $3,964 and $4,038, anchored by central bank demand and weaker US data.
As long as $4,000 holds, bias leans bullish toward $4,071–$4,085.
Break below $3,964 shifts short-term tone bearish toward $3,922.
Xauusdanalysis

Above 4000, continue to be bullish on gold.#XAUUSD OANDA:XAUUSD TVC:GOLD
Gold prices fell after opening lower in Asian trading today, but rebounded after touching the key support zone of 3960-3950 and then entered a narrow range of fluctuation. Judging from the current trend, gold is still in an upward channel, and the price is still stabilizing above the daily MA5. Therefore, as long as it does not break below the daily MA5 of 3985, we can continue to maintain a bullish view.
Observing the 1H and 4H charts, we can see that the moving average support is basically maintained in the 4010-4000 range. If the gold price retraces to this range in the short term, we can consider going long on gold. Meanwhile, the first resistance level to watch is 4035-4045, which is both the rebound high point that gold prices repeatedly tested last Friday and the location of the daily MA10 moving average. Only by breaking through and stabilizing above this level will gold prices further test the upper resistance of 4050, or even higher.

XAU/USD – Gold Accumulates Before Breakout, Target 4,096 USD🔍 Market Context
Gold is trading within a symmetrical triangle pattern , reflecting short-term accumulation before forming a new breakout wave.
After a sharp decline from the peak of 4,096 USD, the market has shown two instances of Change of Character (ChoCH) – an early sign indicating the return of buying pressure.
As long as the price holds above the 3,959 – 3,917 USD range, the short-term bullish structure remains intact. This support zone serves as a crucial “discount zone” in the current accumulation cycle.
💎 Key Technical Zones
• Support Zone 1: 3,959 USD → main structure holding area, coinciding with the lower trendline.
• Support Zone 2: 3,917 USD → final liquidity reaction zone.
• Resistance Zone: 4,040 USD → potential break & retest area.
• Liquidity Zone: 4,096 USD → expansion target if the peak is broken.
🎯 Trading Scenarios
1️⃣ BUY Setup – Favoring the bullish structure
• Entry: 3,959 – 3,917 USD
• Stop Loss: 3,905 USD
• Take Profit:
– TP1: 3,985
– TP2: 4,040
– TP3: 4,072
– TP4: 4,096
✳️ “Buy the discount” – prioritize buying orders at the confluence support zone of trendline + FVG to follow the SMC flow.
2️⃣ SELL Scalp – Secondary strategy when price reacts at the peak
• Entry: 4,096 USD
• Stop Loss: 4,108 USD
• Take Profit:
– TP1: 4,072
– TP2: 4,040
– TP3: 3,985
✳️ “Sell the premium” – only activate if there is a strong price rejection signal at the liquidity peak.
💬 Conclusion
The short-term trend of gold remains bullish as the price stays above the trendline and continuously forms higher lows.
The main strategy is buy the dip – sell reaction around the 3,959 → 4,096 USD range.
The confirmation point for a strong bullish trend will be when the price closes steadily above 4,040 USD .
“Smart money accumulates in silence before the market makes noise.”
⏰ Timeframe: 1H
📅 Update: 03/11/2025
✍️ Analysis by: Captain Vincent

#XAUUSD(GOLD):We are still bearish, this week is decider! Gold experienced a decline during today’s Asian session before recovering sharply to the 4030 area. Currently, the price is consolidating within a narrow range between 4010 and 4030. This behaviour suggests a period of accumulation, where buyers and sellers are unable to establish a clear directional advantage. Given the anticipated volatility in the coming week, particularly with macroeconomic data releases, traders should exercise caution and implement disciplined risk management strategies.
The initial decline in the Asian session may have been driven by short-term profit-taking and liquidity searches by major market participants. However, the swift recovery to 4030 indicates strong buying interest at lower levels, suggesting that gold remains in a bullish trend on larger timeframes. This range-bound movement between 4010 and 4030 is forming a temporary consolidation zone.
A detailed examination of the 1-hour chart reveals multiple touchpoints within this range, indicating strong short-term support at 4010 and resistance near 4030. Candlestick patterns suggest indecision, with several doji and spinning-top formations, further confirming the likelihood of price manipulation and liquidity grabs throughout the week.
Like and comment for more such chart analysis!
Team Setupsfx_

XAUUSD 4H Bearish setupThe price has tested the brown EMA ribbon (a dynamic resistance area) several times and failed to close above it. This indicates strong selling pressure near 4,045–4,065.
The latest rally failed to break the prior swing high, maintaining the bearish market structure.
Entry Zone: Around 4,035–4,045 (rejection zone)
Stop Loss: Above 4,065 (structure + EMA rejection area)
Targets:
TP1: 3,983 Minor support within prior structure – short-term profit-taking zone
TP2: 3,941 Mid-level Fibonacci extension; key liquidity zone
TP3: 3,901 Full measured move of the prior swing; strong bearish continuation target

Today's gold trading strategyCentral bank gold purchases + Diversification away from the US dollar
Global central banks increase holdings to record levels: In the third quarter of 2025, global central banks' net gold purchases reached 220 tons (up 28% compared to the previous period), and 95% of the surveyed central banks plan to continue increasing their holdings in the next 12 months. Central banks in China, Kazakhstan, and others have been increasing their purchases continuously, forming a "buying buffer" at the $4,000 level, which provides a long-term supporting logic that is irreversible.
The acceleration of de-dollarization is beneficial: 73% of the surveyed central banks predict that the share of US dollar reserves will decrease in the next five years. The substitutive value of gold as a non-credit asset is prominent, and the willingness of central banks in emerging markets to increase their holdings is particularly strong (48% plan to increase holdings). Structural demand supports the upward movement of the gold price median.
Investment demand experiences explosive growth: In the third quarter of 2025, global gold investment demand reached 537 tons (up 47% compared to the previous year), and the "fear of missing out" (FOMO) mentality pushed individual and institutional funds to continuously flow in, forming a positive cycle of "fundamental factors + capital factors".
Today's gold trading strategy
buy:3990-4000
tp:4010-4020
sl:3980

Gold Price Breakout Toward 4,037 Target(XAU/USD) is forming a symmetrical triangle pattern on the 1-hour chart, suggesting potential breakout momentum. The price is currently trading near $4,014, with an upside target of $4,037 if bullish momentum continues. Key support zones are located at $3,960, $3,920, and $3,880.

XAUUSD, BUY TILL 4045XAUUSD, if this running M5 Candle will clsoe above the 4016, market will surely going to touch 4045 level very easily,

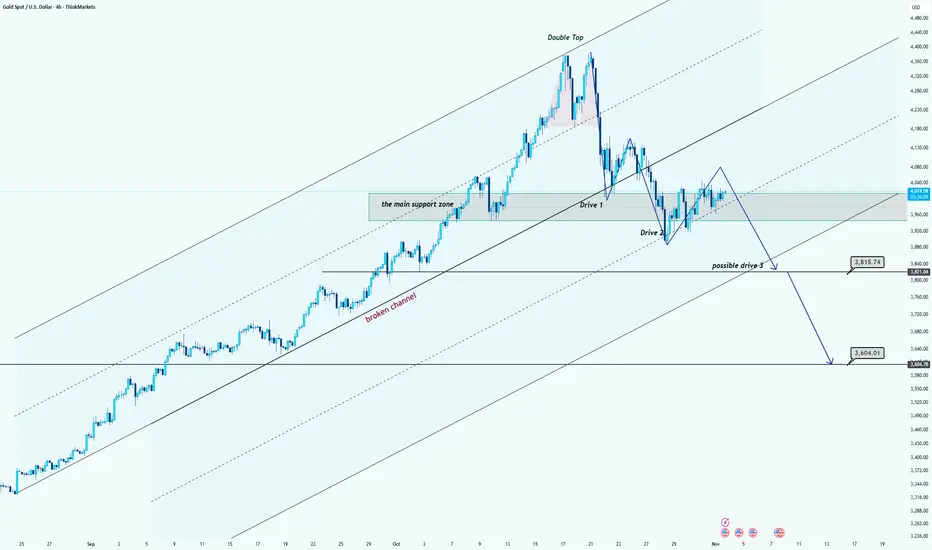
Gold Forming Bearish Three Drives Pattern Below Channel MidlineHi team!
Gold has formed a double top near the upper boundary of a long-term ascending channel, signaling potential exhaustion of the bullish momentum. After breaking below the local support and retesting it, price created a lower high, which confirms a short-term bearish structure.
Currently, the market is consolidating below the midline of the new channel. The recent sequence of moves is forming a potential Three Drives pattern, where Drive 1 and Drive 2 are already complete, and a possible Drive 3 could be developing.
If price fails to reclaim the main support zone around $4,000–$4,050, we can expect a continuation to the downside toward:
$3,815 – the first key support level and measured target for Drive 3.
$3,604 – the next major support zone and lower boundary of the broader channel.
As long as price remains below the recent swing highs, the bearish scenario remains valid. A clear break above the midline of the channel would invalidate this setup and suggest a potential reversal.
Disclaimer: As part of ThinkMarkets’ Influencer Program, I am sponsored to share and publish their charts in my analysis.
SELL XAUUSD (GOLD) - the bearish trend begins!GOLD (XAUUSD) has been struggling to stay bullish in the last recent weeks and has completely reversed. GOLD was in a clear uptrend but eventually broke a powerful trendline which acted as support for several weeks. Gold also tried to test resistance to the upside but struggled to break through it. Time to sell and take profit at the next major support zone!

Gold price analysis November 3🟡 XAUUSD – Recovery Signal Forming
Gold prices are showing signs of returning to an uptrend after a short-term correction. The 4026 area is now acting as an important key level – a stable price above this area would be a confirmation signal that buying pressure is returning to the market.
With recent economic data still supporting the gold uptrend, the current priority strategy is to wait for BUYs following the trend. The sellers can only regain control if the price breaks through the support trendline around 3970, then the downtrend can be re-established.
📈 Sample trading plan:
Buy early around: 4000
Buy intensified when the price breaks above: 4026
Expected target: 4150
Risk: The uptrend is negated when the price closes below the 3970 trendline

With Bears in Control, Gold May Fall Toward 3800Gold has been trading in a low-level consolidation recently. Although the price briefly broke above the MA5 on the daily chart, the overall structure remains bearish. Only a breakout and firm hold above 4080–4100 would offer bulls a genuine trend opportunity; otherwise, under bearish control, the current sideways movement should still be viewed as a bearish continuation pattern.
Price is currently moving within a triangle consolidation:
Resistance: 4013 / 4030 / 4063-80
Support: 3986-75 / 3948-21
Under the continuation-downtrend scenario, the strategy remains focused on selling into rebounds or entering short positions in staged batches. If Wave 5 unfolds, gold could push below 3800.
Patience is key during this phase. Should major bullish news emerge, the market may trigger a sharp upside move (potentially a bull trap), so stay flexible and adapt to price action rather than locking into one bias.

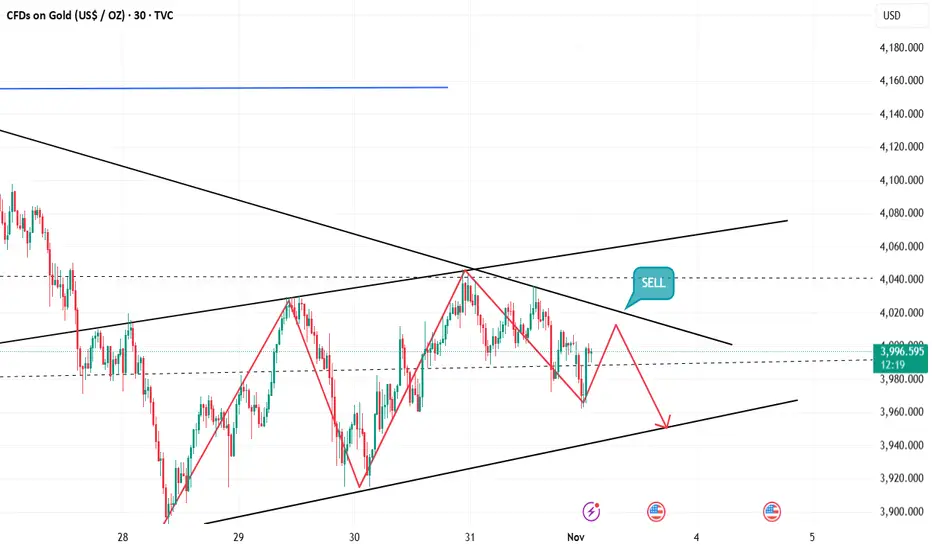
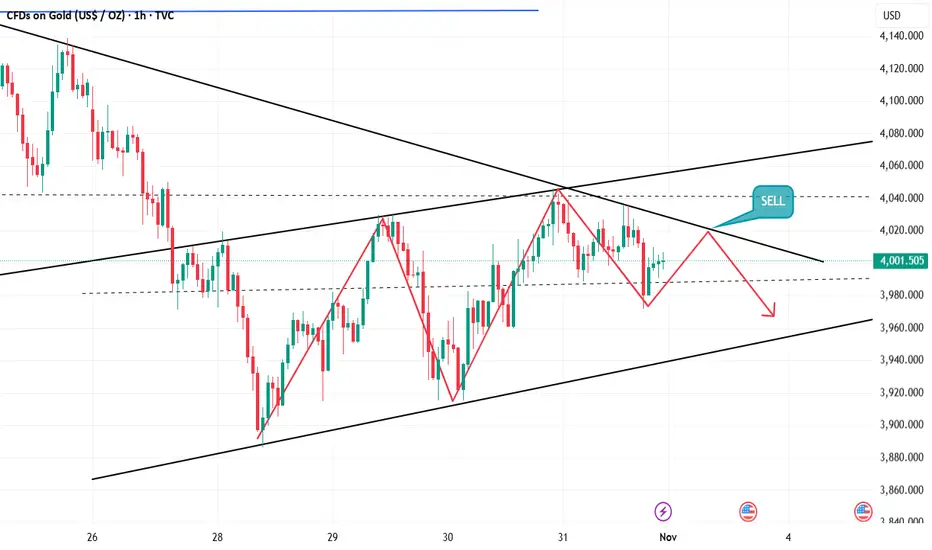
GOLD (XAU/USD): SELL/BUY Zones Await ISM Data!I. MACRO OVERVIEW (The Tug-of-War):
Gold is currently in a tight consolidation, caught between two powerful macro narratives:
⬆️ BULL CASE (Buy Pressure): Safe-Haven demand is buoyed by US Political Risk (government shutdown concerns) and global uncertainty (e.g., Nvidia chip export curb).
⬇️ BEAR CASE (Sell Pressure): Persistent USD Strength as hawkish Fed commentary continues to push back on rate cut expectations, capping Gold's upside.
🔥 CATALYST: All eyes on the US ISM Manufacturing PMI release tonight. This data point will be the decisive trigger for Gold's next short-term direction.
II. TRADING PLAN (Actionable Zones):
We are zoning in on two high-probability Liquidity Zones where we will await a Price Action Confirmation before entry:
🔴 SELL SCENARIO
SELL ZONE (Supply/FVG): $4,050 - $4,055
Rationale: Targeting a strong rejection where Smart Money is likely to distribute.
SL: $4,065
TP Targets: $4,045 - $4,035 - $4,025 - $4,015
🟢 BUY SCENARIO
BUY ZONE (POI/Demand): $3,952 - $3,948
Rationale: Looking for sustained support and reaction at a major Point of Interest.
SL: $3,940
TP Targets: $3,958 - $3,968 - $3,978 - $3,988
🚨 FINAL CHECK:
Risk Management is Paramount. Always wait for a strong Price Action Confirmation (e.g., strong rejection candles) within the designated zones before triggering an entry. DO NOT trade the news.
#XAUUSD #Gold #ISM #PriceAction #TechnicalAnalysis #Forex #TradingPlan #SmartMoneyConcept #USD #SafeHaven #TradingSignals

You can short gold after it fills the gap.Gold opened lower at the start of the week, having closed near 4002 on Friday, but opened at 3983, falling as low as 3962, a drop of nearly $40. Currently, the market is range-bound with no clear trend in either direction. Trading should focus on buying low and selling high based on support and resistance levels, rather than chasing the market. The overall market is still oscillating within the 3850-4150 range. The 3880 area, which has been tested twice without a breakthrough, has become a key support level for the decline.
Gold opened lower and filled the gap. Short-term selling pressure is warranted, as bullish momentum is weak and further weakness is possible in the short term. The overall market remains in a large range-bound pattern. The short-term bullish movement is merely a rebound and has failed to drive a significant upward trend. The market opened lower this morning following weekend news and continued to decline. After filling the gap this morning, the bears may continue to exert pressure. Short positions can be considered on rallies to 4005-4015.
XAU/USD Daily Structure – Bullish Reversal Targeting BPR ZoneA potential bullish reversal after a recent pullback, aiming for a retest of higher price levels.
Prior Price Action: The price experienced a strong uptrend (sequence of large green candles) leading up to the mid-October high, followed by a sharp pullback (red candles) which broke below a previous low, labeled as BOS (Break of Structure). This BOS confirms a short-term bearish shift or the start of a deep correction within the larger uptrend.
Current Price Level: The price is currently near $4,008.10, having shown recent bullish momentum (the last green candle) off a recent swing low.
Key Levels and Concepts:
D/FVG (Daily Fair Value Gap): There are two Fair Value Gaps marked on the chart.
The lower D/FVG (around $4,000 - $4,060) acted as an initial target or point of interest during the decline. The price has started to move up from this area.
The upper D/FVG (around $4,170 - $4,220) represents a future potential target.
BPR (Balanced Price Range): This blue area (around $4,160 - $4,180) is an area where a previous down move's FVG overlaps with a subsequent up move's FVG (or vice versa), suggesting a zone where the market might find temporary balance or resistance/support.
Projected Path: The black arrow illustrates a bullish projection. The price is expected to continue its upward move, potentially targeting the lower D/FVG for a re-entry/retest before making its way towards the BPR and the upper D/FVG as the final target of this short-term analysis.

GOLD (XAU/USD): Bulls Eye $4,125 – Breakout Imminent?Gold dropped to a significant horizontal support level last week.
The price subsequently rebounded from this level, forming a rising triangle pattern on a 4-hour timeframe.
The neckline of this triangle is defined by an intraday horizontal resistance.
Its bullish violation (4H candle close above) can be a nice trigger to buy Gold with a confirmation.
Should this occur, a bullish continuation towards 4125 would be anticipated.
Conversely, a bearish movement and a break below the vertical support level could potentially lead to a further decline in price.

XAU/USD Analysis — Awaiting Breakout Confirmation for Bull Entry🏆 XAU/USD GOLD vs U.S. DOLLAR 🏆
📊 Swing/Day Trade Opportunity Guide
🎯 THE THIEF STRATEGY SETUP
Market: Precious Metals | Pair: XAU/USD (Spot Gold)
Timeframe: Multi-Timeframe Confirmation
Strategy Type: Breakout + Dynamic Support/Resistance
💡 BULLISH CASE CONFIRMED ✅
The bulls are on patrol! 🚨 Multiple confluences suggest an upside move:
✨ LSMA (Least Squares Moving Average) acting as dynamic support with multiple touch confirmations — classic reversal signal for swing traders. The metal is respecting this lower boundary like a fortress wall.
⚠️ Breakout Confirmation Required: Watch for a decisive close above 4,060.00 — this level marks a critical moving average resistance zone. Once breached, this becomes our green light for layered entries.
💰 ENTRY STRATEGY: "THE LAYERING THIEF METHOD" 💎
Instead of FOMO-ing into one position, we deploy the layered entry approach — multiple limit orders like a professional accumulator:
📍 Buy Limit Layers (After Breakout Confirmation):
Layer 1️⃣: 3,920.00 ← Initial dip catch
Layer 2️⃣: 3,960.00 ← Continuation entry
Layer 3️⃣: 4,000.00 ← Mid-zone accumulation
Layer 4️⃣: 4,040.00 ← Final confirmation level
⚡ Pro Tip: Scale these layers based on your account size and risk tolerance. You can add more layers every $20-$40 intervals.
🔔 CRITICAL:
✋ Wait for breakout confirmation above 4,060.00 before placing any buy orders. Premature entries = Stolen profits going nowhere! ❌
🛑 STOP LOSS (Risk Management)
Thief SL Level: 3,880.00 🎯
This is where the heist ends if the plan fails. Close below this support = Exit the building! 🚪
⚠️ Disclaimer Note: This stop loss is suggested as a reference point. Your SL placement depends on your risk appetite, account size, and trading personality. We're not financial advisors — only fellow traders sharing our playbook! Trade at your own risk. 💪
🎪 PROFIT TARGET: "THE POLICE BARRICADE" 🚔
Target Zone: 4,360.00 🏁
Why this level? Multiple reasons converge here:
📈 Strong historical resistance acting as a "police barricade"
🔴 Overbought conditions signal potential pullback territory
⚠️ Trap zone detected — this is where smart money takes profits!
Strategy: Scale out your positions as price approaches this zone. Don't get greedy and lose the win!
⚠️ Disclaimer Note: This profit target is OUR suggested zone, but YOU decide when to take profits. The choice is yours — stack those wins or hold for more. No financial advice here, just trading wisdom shared among Thief OG's! 🎩
🔗 CORRELATED PAIRS TO MONITOR 📡
Watch these related instruments for confluence signals:
💵 USD Index ( TVC:DXY ) — Inverse relationship with gold. If DXY weakens → XAU/USD strengthens. Monitor for divergence opportunities.
🏦 SPX500 ( CAPITALCOM:US500 ) — Risk sentiment indicator. Rising stocks = potential gold weakness. Use as confirmation filter.
FX:EURUSD — EUR strength = potential gold support. Cross-market divergences often precede major moves.
FX:GBPUSD — Pound weakness often correlates with gold rallies. Track for multi-timeframe alignment.
TVC:US10Y (10-Year Treasury Yield) — Inverse correlation. Rising yields = headwind for gold. Monitor daily for macro context.
📋 QUICK CHECKLIST ✅
Confirm LSMA support holds
Wait for 4,060.00 breakout confirmation
Place layered buy limits at 3,920/3,960/4,000/4,040
Set stop loss at 3,880.00
Scale profits into 4,360.00 resistance zone
Monitor correlated pairs for confluence
Respect risk management — never exceed 2% per trade
🎬 THE BOTTOM LINE 🎬
Gold is setting up for a potential swing trade move. The LSMA support is holding, and a breakout above 4,060.00 could trigger a run toward 4,360.00. Use the layering strategy to build positions methodically, protect capital with your chosen stop loss, and exit into resistance zones.
This is a confluence-based breakout play — not a guarantee, just probability on our side. 🎲
✨ If you find value in my analysis, a 👍 and 🚀 boost is much appreciated — it helps me share more setups with the community!
#XAU/USD #GoldTrading #TradingStrategy #SwingTrade #DayTrading #ForexAnalysis #TechnicalAnalysis #ThiefStrategy #LSMA #BreakoutTrading #RiskManagement #TradingCommunity #MarketAnalysis #Commodities #MetalsMarket

GoldXAUUSD
- Bullish Channel as an corrective pattern in Short Time Frame
- RSI - Divergence
- Completed " 12345 " Impulsive Waves and " ABC " Corrective Waves
- Falling Wedge as an corrective pattern in Long Time Frame
- Order Block

XAU/USD Intraday Plan | Range-Bound Before Next MoveGold continues to trade in a tight range, holding just above the MA50 and approaching the MA200, as buyers attempt to regain short-term control. The metal is currently hovering around 4025, with price consolidating below the 4042 resistance — a key barrier that has capped upside attempts in recent sessions.
If bulls manage a clean break above 4042, the next resistance stands at 4090, followed by 4120. However, failure to break higher could see price rotate back toward 3990 and the First Reaction Zone (3957–3918) for potential support.
A deeper pullback below 3918 would shift focus toward the Support Zone (3884–3851) and the HTF Support Zone (3820–3781) — areas where stronger buying interest has previously emerged.
📌 Key levels to watch:
Resistance:
4042
4090
4120
Support:
3990
3957
3918
3884
🔎 Fundamental Focus:
The ongoing U.S. government shutdown, now in its fifth week, has significantly disrupted the release of key economic data, leaving traders with limited insight into the real state of the U.S. economy.
This uncertainty is keeping market sentiment cautious, with investors closely watching the few reports still being released — such as ISM Manufacturing PMI today — for clues on growth and inflation.
The lack of reliable data continues to support safe-haven demand, with gold remaining sensitive to any signs of progress toward resolving the shutdown.

Gold Analysis! Trading Strategy for Next WeekWith just over ten hours until the gold market opens, I'll briefly review last week's market performance and outline my strategy for next week.
On Friday, gold rose to 4046 in the Asian session before encountering resistance and falling back. After retracing to 3990, it tested the trendline resistance level again, before falling back again in the US session, resulting in significant volatility throughout the day.
As mentioned on Friday, the volatile market offers opportunities for both bulls and bears. The key lies in the entry point. If the Asian session rises, the European session retraces and breaks the low, and the US session surges, it's a bull trap. Once the high point appears, go short. We followed this approach and achieved good results.
Gold continues to fluctuate, and next week will be crucial for whether the gold bulls can regain their footing. If gold continues its strong performance on Monday, it is likely that the rebound will continue, but it will be a rebound, and the daily chart of gold will then begin a long period of adjustment.
The gold market will continue to face numerous uncertainties, and the battle between bulls and bears is expected to continue. From a news perspective, a series of important economic data will be released next week, such as the US non-farm payrolls and PMI data. The performance of these data will directly affect market expectations for the US economic outlook, and thus influence gold price movements. In addition, speeches by Federal Reserve officials and developments in the geopolitical situation also require close attention.
Next week, the initial resistance level for gold is expected to be in the $4050-$4070 range. This area represents the previous rebound high and the location of the 5-week moving average, making it a relatively strong resistance level. If gold prices can break through this resistance level, they may further challenge the resistance near $4100. The key support level is at $3950, which is the starting point of this week's rebound and the lower Bollinger Band support on the daily chart. A break below this level could lead to a further decline to around $3900 for support.
Next week's trading plan will be launched soon. If you have any trading questions, please feel free to contact me.
XAUUSD possible bullish for 4140#xauusd 2h time frame structure has been change from lower low to higher high. don't jump into the market blindly. wait for demand zone to be test i.e. low volume pullback, then take long. stop loss below 3885. target: 4140. 3930-3900 is the area of interest for long.

XAUUSD- Trend reversal - New ATH incoming?OANDA:XAUUSD has turned bullish on the daily timeframe after holding key dynamic support and reclaiming the volatility ribbon. The structure now supports continuation toward higher Fibonacci levels, provided price remains above the $3,940 support zone.
Momentum is shifting in favor of buyers, and with strong absorption of previous selling, the bias now leans toward further upside movement.
Bullish Confluences:
Structure Shift: Price has broken above the short-term descending channel, confirming a bullish structure change after forming a higher low near the mid-band support.
EMA / Volatility Ribbon Reclaim: Candles have closed back inside the green volatility ribbon, signaling renewed bullish momentum and a shift in trend sentiment.
Strong Daily Rejection: The recent candle shows a clear rejection wick from the lower volatility band (blue zone), indicating that buyers absorbed selling pressure and stepped back in.
Momentum Turn: Oscillators and momentum tools (if used) confirm upward acceleration, consistent with previous bullish continuation setups.
Support Confirmation: The previous base around $3,920 – $3,940 held firmly as support, creating a foundation for an upward leg.
🎯 Fibonacci Extension Targets (Upside)
Measured from the latest swing low to swing high:
Target 1 (38.2%) → $4,091
Target 2 (61.8%) → $4,143
Target 3 (100%) → $4,210

ElDoradoFx – GOLD SESSIONS ANALYSIS (03/11/2025, LONDON)1️⃣ Market Overview
Gold continues its bullish momentum from the 3,962 weekly low, now trading around 4,018–4,020, with clear signs of accumulation above the 200 EMA. The market remains in an upward correction phase, with intraday structure showing strong recovery and possible breakout above key resistance.
London session focus: whether gold can sustain above 4,023 to confirm a continuation toward 4,036–4,046.
⸻
2️⃣ Technical Breakdown
🟢 Daily (D1)
• The daily candle remains bullish, holding above the 10EMA (≈4,010) and approaching resistance near 4,036.
• RSI at 61, signaling sustained recovery momentum.
• MACD histogram decreasing red volume, hinting at reversal continuation potential.
🟡 H1 (Hourly)
• Price structure: higher lows from 3,962 → 3,985 → 4,000, forming a bullish channel.
• Break of structure at 4,015 with RSI 56+, confirming bullish control.
• Price testing the descending trendline and 200EMA (4,022–4,026 zone).
• MACD momentum positive, suggesting strength for a potential London breakout.
🔵 15M–5M (Intraday)
• Bullish BOS (Break of Structure) confirmed at 4,010; price consolidating below 4,023 liquidity zone.
• RSI 65 → near breakout threshold.
• EMAs aligned bullishly (50EMA > 100EMA > 200EMA).
• MACD showing continued bullish histogram expansion.
⸻
3️⃣ Fibonacci Analysis
Last swing: 3,962 → 4,036
Level Price
38.2% 4,017
50.0% 3,999
61.8% 3,982
🎯 Golden Zone: 3,999 – 3,982
→ Ideal retracement zone for continuation buys if price corrects.
⸻
4️⃣ High-Probability Trade Scenarios
✅ BUY SCENARIO (Main Bias)
Buy Zone: 3,999 – 3,982 (Golden Zone)
Confirmation: 5M–15M bullish CHoCH + RSI >55
🎯 Targets:
• TP1 → 4,023
• TP2 → 4,036
• TP3 → 4,046
• TP4 → 4,060
🛑 SL: Below 3,975
Breakout Buy:
Trigger: Break & retest above 4,023
🎯 Targets: 4,036 → 4,046 → 4,060
🛑 SL: Below 4,010
⸻
⚠️ SELL SCENARIO (Countertrend)
Sell Zone: 4,023 – 4,036 (Liquidity trap + 200EMA rejection)
Confirmation: RSI divergence + rejection candle on 15M
🎯 Targets:
• TP1 → 4,008
• TP2 → 3,995
• TP3 → 3,982
🛑 SL: Above 4,046
Breakout Sell:
Trigger: Break below 3,975
🎯 Targets: 3,962 → 3,945
🛑 SL: Above 3,990
⸻
5️⃣ Fundamental Watch
• UK Manufacturing PMI early volatility may drive session movement.
• US ISM Manufacturing PMI and Fed Williams speech later today could bring sharp USD reactions.
• DXY hovering near 106.10, slightly weakening — bullish bias for gold if this continues.
⸻
6️⃣ Key Technical Levels
Type Levels
Resistance 4,023 / 4,036 / 4,046 / 4,060
Support 4,008 / 3,995 / 3,982 / 3,962
Golden Zone 3,999 – 3,982
Break Buy Trigger > 4,023
Break Sell Trigger < 3,975
⸻
7️⃣ Analyst Summary
Gold continues its bullish recovery from the 3,960 zone and is currently testing structural resistance at 4,023.
A confirmed breakout and retest above 4,023 would open the path to 4,036–4,046, while a failure at this level could lead to short-term retracement toward 3,995–3,982 (Golden Zone) before continuation.
⸻
8️⃣ Final Bias Summary
• Primary Bias: 🟢 Bullish above 4,008 → Target 4,036–4,046
• Secondary Bias: 🔴 Bearish below 3,975 → Target 3,962–3,945
• Volatility: Moderate → may increase around PMI data.
⸻
— ElDoradoFx PREMIUM 3.0 Team 🚀
