Gold (XAU/USD) Technical Analysis based on your 15-minute chart:Support Level: 4,100 – 4,106
Resistance Zone: 4,120 – 4,125
Target Point: 4,147
Trend Bias: Short-term corrective upward trend within a broader pullback phase.
📈 Scenario 1 – Bullish Setup
If price continues to hold above the support zone (4,100 – 4,106):
Expect a rebound toward 4,120 (minor resistance).
A breakout above 4,120 could trigger further buying toward the target point at 4,147.
This move aligns with the projected ascending channel shown on the chart.
Confirmation Trigger: Bullish breakout and sustained candle close above 4,120.
📉 Scenario 2 – Bearish Continuation
If g RUS:SI1! RUS:GD1! RUS:MX1! RUS:USDRUB.P RUS:RI1! RUS:IRUS.P RUS:SV1! RUS:CR1! RUS:CNYRUB.P RUS:HS1! old breaks below 4,100:
Selling pressure could resume, driving price down to 4,085 – 4,080.
A break below 4,080 would confirm deeper correction and invalidate the bullish setup.
⚖️ Summary
Bias Entry Zone Target Stop Loss
Bullish (Buy) 4,106 – 4,112 4,145 – 4,150 4,095
Bearish (Sell if break below) < 4,100 4,085 – 4,080 4,120
💬 Analyst Note
The market is showing short-term accumulation after a selloff. Watch for volatility around 4,110–4,120; momentum confirmation is key before taking a position. RUS:NG1! RUS:BR1!
Xauusdanalysis

#XAUUSD: Will There Be Major Price Correction On Gold? Dear Traders,
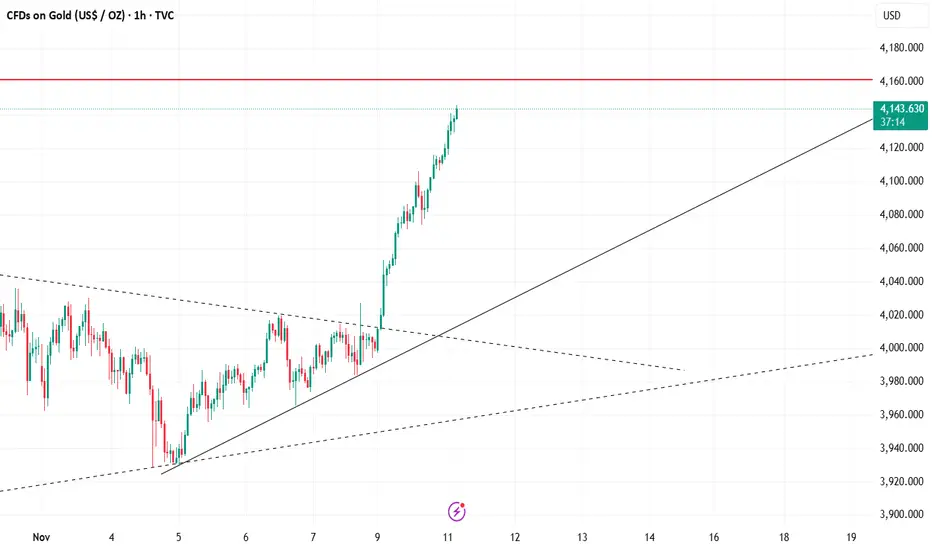
Gold has been rallying with strong bullish momentum and has not experienced a major correction since the last few weeks. We have identified a key level from which the price can continue its bullish momentum if fundamentals do not change. Furthermore, we can target $4200 in a few weeks if the current momentum continues.
Best regards,
Team Setupsfx_

XAUUSD UPDATE: WHAT NEXTHi everyone,
Gold is currently testing the resistance level at 4149.78. A breakout above this level could push the price toward the 4203–4204 level. Conversely, if the price breaks below the 4124–4123 support, I’ll be watching for a potential pullback around 4098 or a rejection from the trendline
good luck all
**My trading strategy is not intended to be a signal. It's a process of learning about market structure and sharpening my trading my skills also for my trade journal**
Thanks a lot for your support

XAUUSD: Watch for a breakout during the U.S. sessionThe Gold is basically oscillating within a narrow range now, but the U.S. session is bound to break out of this range.
Gold has been consolidating for nearly a month, and finally, the consolidation ended at the end of October and the beginning of November. As the bullish momentum emerged, gold staged a bottoming rebound. As I’ve said before, in a strong upward trend, it’s unwise to call the top prematurely.
For trading strategies, I still recommend prioritizing buying on pullbacks, with support below held at the key integer level of 4100.
Trading Strategy:
Buy 4120 - 4130
SL 4110
TP 4140 - 4150 - 4160
Sell 4160 - 4155
SL 4170
TP 4145 - 4035 - 4025

GOLD: Still prioritize buying on pullbacksIn terms of gold's current pattern, the strong momentum built up after a continuous upward move is likely to extend significantly. We remain bullish on the gold market for now. The short-term resistance above is around 4145, which will also be our primary target going forward. On the downside, support is held at the key integer level of 4100, a level that serves as one of the primary retracement points for short-term bullish corrections. Operationally, we prioritize buying on pullbacks.
From the 4-hour chart analysis, the support below will continue to lie around the 4090-4110 range, while the short-term resistance above is focused on 4145-4150. If gold stabilizes above 4150, it may surge toward 4180 today. In trading, we maintain the strategy of buying on pullbacks and should avoid blindly chasing the rally.
Trading Strategy:
Buy 4110 - 4120
SL 4100
TP 4140 - 4145 - 4150
Sell 4150 - 4145
SL 4160
TP 4125 - 4020 - 4015

Accurate prediction of an upward trend has arrived as expected.The protracted US government shutdown is finally coming to an end! The Senate has cleared procedural hurdles, and the temporary funding bill has passed a procedural vote, ensuring government funding until January. The shutdown is likely to end this weekend.
As soon as the news came out, the market went from cloudy to sunny – the previous shutdown had tightened liquidity, but now it seems to be easing, and the precious metals market is leading the rebound. Although the shutdown isn't completely resolved, the resumption of negotiations between the two parties has sent a positive signal, boosting risk appetite and relieving the anxiety of watching partisan infighting.
To put it simply, this "temporary extension" by the US government is like a reassurance to the market. Investors who were panicking before the shutdown can now breathe a sigh of relief. All that's left is to wait for the final decision so that the government can fully "reopen for business"!
Gold broke out of a two-week low-level triangle pattern in the previous trading session, ushering in a strong upward trend. Yesterday's market exhibited a three-stage upward trend: higher in the Asian session, continued gains in the European session, and accelerated gains in the US session. Each rally was followed by a period of consolidation without significant pullbacks, a classic characteristic of extremely strong market conditions.
Regarding the future trend, the bullish outlook remains unchanged for today.
On one hand, the current situation strongly suggests a period of high-level consolidation: given the current extremely strong pattern, gold is more likely to continue its "time-for-space" consolidation, digesting pressure before resuming its upward movement. If this pattern holds, aggressive long positions can be considered before the European session.
On the other hand, if a pullback occurs: the 4116-4110 range should be closely watched, as this will act as a crucial support level. If the price retraces to this range and stabilizes, long positions can be considered on the pullback.
gold awaits breakout before we buy or sell#XAUUSD bullish await breakout above 4145- 4149 on M30-H1 closure to buy.
Target 4161 -4178. Stop loss 4137
Below the rectangle 4137 holds strong pullback and rejection on sideways before we can get selling range.
If the buy doesn't breakout first but drop below the rectangle then we look for sell.

USOIL: Accumulate bullish momentumFrom the daily chart perspective of crude oil, on a partial level, the current oscillating rhythm is a secondary consolidation. Judging from the primary and secondary rhythms, there is still room for a rebound and upward move in the trend. The MACD indicator remains below the zero axis, indicating that bullish momentum still needs to accumulate further. It is expected that after the medium-term trend of crude oil tests the low point and finds support, a rebound and upward movement is likely to form.
Buy 59 - 59.5
SL 58.5
TP 60 - 60.5 - 61
Sell 60.5 - 61
SL 61.5
TP 59.1 - 58.5

GOLD (XAU/USD): FED DOVISHNESS FUELS BREAKOUT! WHERE TO LONG?📰 Fundamental Analysis: The Main Driver (MUST READ)
The macroeconomic winds are strongly pushing Gold higher:
Rate Cut Expectations: The market is currently pricing in over 60% probability of another Fed rate cut in December.
Lower rates weaken the USD and eliminate the opportunity cost of holding non-yielding Gold.
Weak Economic Data: The US Consumer Sentiment Survey from the University of Michigan plunged to 50.3 (lowest since June 2022). This weak reading supports the narrative of a slowing economy, bolstering the case for a more dovish Fed.
💡 Key Event This Week: Focus shifts to FOMC member speeches on Wednesday (following the Tuesday bank holiday) for confirmation on the future rate path.
📊 Technical Analysis: The Perfect Setup
Gold has executed a decisive Breakout from its consolidation range (4,044 - 4,060), confirming a structural shift to a Bullish Trend.
Waiting for the Long Entry: DO NOT CHASE THE PRICE! Be patient and wait for a pullback to the Demand Zone/CP (4,081 - 4,114). This is the optimal area for Bulls to enter and follow the trend.
Targets (TP): If the CP zone holds, potential targets are 4,155, 4,185, and the higher objective at 4,236.
Stop-Loss (SL): Place safely below the old breakout level at 4,044.
🎯 Strategy Summary
Strategy: Wait to Buy (Long) in the 4,081 - 4,114 region.
Risk Note: Caution if price breaks and closes below 4,044.
#XAUUSD #Gold #FedRateCut #Breakout #TechnicalAnalysis #FOMC #TradingSetup

XAUUSD (Gold) Daily Chart Analysis: Reaching Key Resistance/FVGKey Observations and Analysis
Recent Price Action: Gold has experienced a strong upward move, currently trading around $4,142.19. This rally has approached a critical area marked on the chart.
Key Resistance / Fair Value Gap (FVG): The price is entering a large shaded box labeled "D / FVG".
This box, spanning from approximately $4,160 to $4,240, represents a Daily Fair Value Gap (FVG) or a significant imbalance left by a prior sharp move down (a large bearish candle on November 21st-22nd).
In technical analysis, particularly concepts like Smart Money Concepts (SMC), an FVG acts as a high-probability target where the market often returns to fill the inefficiency. It also typically serves as a strong resistance zone.
Break of Structure (BOS): An area labeled "BOS" (Break of Structure) around the $4,020 level indicates a recent shift in market structure from potentially bearish/ranging to bullish on this timeframe, confirming the recent upward momentum.
Prior Low ('X'): A previous low labeled "X" around the $4,000 psychological level was initially respected before the rally commenced.
Expected Reaction: The chart includes a projected price path (the black arrow/zigzag line) suggesting the price may tap the FVG and then experience a reversal or sharp pullback from this key supply/imbalance zone.
Conclusion
The XAUUSD market is currently testing a significant Daily Fair Value Gap (FVG) / Resistance zone. Traders will be looking for a reaction around the $4,160 - $4,240 area to determine if the bullish momentum will pause, reverse, or break through to continue higher.

Bitcoin Short Setup From Premium Zone
The market is showing a clear 1H break of structure, with price approaching a strong resistance area. After a bullish impulse, BTC is expected to pull back from resistance for a short-term correction.
Key Levels:
Sell Entry: Around 106,000
Stop Loss: 106,700
Take Profit: 104,100
Reasoning:
Technically:
Price has completed a clear bullish leg and tapped into the 1H resistance area. The structure suggests exhaustion with the potential for rejection. A lower high formation suggests bearish correction toward the 1H support zone.
Fundamentally:
Market sentiment remains cautious as BTC faces resistance amid uncertainty in broader crypto risk appetite and mild dollar strength. Short-term selling pressure may dominate before any new bullish continuation.
Disclaimer:
This analysis is for educational purposes only. It is not financial advice. Always manage risk before trading.

Gold: Bullish Trend, but Watch Selling Pressure at 4150/4186Driven by safe-haven demand, gold saw a strong one-way rally yesterday. After breaking above the 4030 resistance, price surged past 4100 and is now approaching the 4150 area. The 4150–4163 zone served as a consolidation region during the previous decline, so some selling pressure here is normal.
However, keep an eye on support at 4096–4080, with deeper support near 4050. As long as these levels hold, the overall bullish structure remains intact.
Once the selling pressure around 4150 eases, the next upside targets come in at 4185–4221, with immediate support shifting to 4166–4150.
In the near term, trading around these key levels is recommended.
One more point to note: the gap near 4090 from the previous drop has been filled, but yesterday a new gap formed at 4006–4009. This could become a psychological reference point if the U.S. government shutdown ends and the delayed economic data turns out unexpectedly bearish, or if geopolitical tensions ease and safe-haven demand declines.

XAUUSD IDEA FOR 10TH OCT, 2025. (2H)Here we go again, I'm back at trading the XAU against the USD. It's been a hell of a ride this year, but it is what it is. The Pair is bullish due to sentiment and because Gold is known as a safe-haven asset, and currently, investors are long on the pair because of the weak USD
As we can see, the pair is resuming back on its overall trend from a previous retracement, so what's next?
Note: This is a very volatile pair and often filled with manipulations ensure to risk what you can afford to lose.
As usual, my calls or analysis are based on what I see, the current Bias, and from a probability standpoint, meaning that this projection may be or may not be validated, so tread carefully. This is not financial advice; trade responsibly.

GOLD: Buy on pullbacksFrom the 4-hour chart perspective, attention should currently be paid to the short-term resistance zone around 4115-4123 above, with key focus on the critical resistance level around 4145. In the short term, watch the support zone around 4060-4068, and pay key attention to the previous low support zone around 4030-4035.
For trading operations, I still recommend prioritizing buying on pullbacks. At mid-range levels, it’s advisable to mostly observe and refrain from action, be cautious of chasing trades, and patiently wait for key levels to enter positions.
Buy 4070 - 4080
SL 4030
TP 4100 - 4110 - 4120
Sell 4120 - 4110
SL 4130
TP 4090 - 4080 - 4070

Gold Breaks above $4050, what is next? Gold prices continued to edge higher on Monday amid growing market speculation that the Federal Reserve may cut interest rates in December. Despite earlier comments from several Fed officials suggesting no rate cuts this year, the probability of a December cut has strengthened. This renewed optimism has once again boosted gold’s appeal as a safe-haven asset.
However, in my view, the recent price rise isn’t solely driven by expectations of rate cuts. There are several broader macroeconomic and geopolitical factors contributing to gold’s bullish momentum.
Following the recent meeting between Donald Trump and Xi Jinping, markets were initially hopeful that a significant trade breakthrough would ease tensions between the U.S. and China. Investors expected that China might resume exports of rare minerals and critical raw materials, which are essential for semiconductor production.
While China has indeed decided to extend the export suspension of certain materials—particularly gallium and antimony—until 2026, the uncertainty beyond that timeframe has created further anxiety in global markets. This uncertainty, combined with expectations of slower global economic growth into 2026, is strengthening demand for gold as a long-term hedge.
In addition, major central banks such as China, Russia, and Turkey have been steadily increasing their gold reserves. This accumulation provides additional support for gold prices, as these institutions are likely to continue buying on dips to diversify away from dollar exposure. Fundamentally, the overall outlook remains strongly bullish for gold.
From October 20 to October 28, gold experienced a short-term pullback. Despite that correction, price action consistently respected the key support zone near $3,990–$4,000, never forming a stable close below it. The market repeatedly failed to break below that base, showing buyers’ strength.
On the upside, the immediate resistance zone around $4,030–$4,050 had held firm for several sessions. However, during today’s early trading session, gold successfully broke above this resistance, establishing stability above the breakout level.
Currently, the next short-term target lies near the $4,130–$4,150 range. If the daily candle closes bullishly, even a minor correction could be followed by another leg upward toward that zone.
Given that $4,150 represents a strong resistance area, a brief pullback is possible once price reaches it. But if gold can sustain a stable close above $4,150, the next psychological target would be around $4,200–$4,230, with a potential final upside target near $4,280–$4,300.
Support & Risk Levels
Immediate Support: $4,050
Next Strong Support: $3,970 – $4,000
Major Support (Invalidation Zone): $3,880 – $3,900
As long as gold holds above the $3,880–$3,900 range, a major downtrend remains unlikely. Buyers continue to defend lower levels aggressively, and momentum remains positive both fundamentally and technically.
Gold remains underpinned by a mix of fundamental optimism (potential Fed rate cuts, central-bank buying, geopolitical uncertainty) and technical strength above its breakout levels. A sustained move above $4,150 could open the path toward $4,300, while a break below $3,970 might trigger a temporary correction.

gold await breakout before buying or selling#XAUUSD price still bullish, but if the gap above 4110-4098 gets rejected then short bearish retrace is expected.
Sell at 4098 on 2 times breakout, target 4054, stop loss 4110.
Above 4103-4110 holds bullish continuation if the first breakout covers above there and H1 closure above the price.

XAUUSD Could Be Bullish If It Stabilizes at This LevelGold surged to its highest level in more than two weeks as traders recalibrated expectations for a Fed rate cut in December, following weak US jobs data and worsening consumer sentiment.
The precious metal's gains came despite progress in ending the US government shutdown, as signs of an economic slowdown continued to boost demand for safe-haven assets.
- Sell Setup (Short position): A sell position is valid below 4102, targeting 4056 / 4025 / 4004.
- Buy Setup (Long position): A buy position is valid above 4102, targeting 4155 / 4189.
📌 Key Points
Gold remains bearish below 4102, with potential for a decline towards 4056–4025 after a possible correction to 4090–4102.
Only a confirmed 1-hour or 4-hour close above 4102 would shift the bias to bullish continuation, targeting 4155–4189 next.

XAU/USD Intraday Plan | Higher for Now — Keep an Eye on SupportWe have a volatile week ahead as the U.S. government shutdown situation continues to unfold. The first vote has passed, but there is still uncertainty around final approval and timing.
Gold has pushed higher during the Asian session, breaking above the 4027 resistance and is now trading around 4076, sitting just above the 4074 level. A confirmed break and hold above 4074 would likely open the door for further upside toward 4115, with 4153 as the next major resistance target.
However, if price fails to sustain above 4074, we could see a pullback toward 4027 for a retest. If selling pressure increases from there, price may rotate back into the First Reaction Zone, where buyers previously stepped in.
📌 Key Levels to Watch
Resistance:
4074
4115
4153
Support:
4027
3984
3955
3921
3884
🔎 Fundamental Focus
All eyes remain on the U.S. government shutdown situation, with votes and negotiations around reopening in focus. The longer the shutdown continues, the more it disrupts key economic data releases and increases uncertainty — which can keep gold reactive and sensitive to headlines.

XAUUSD Shutdown end has given momentum?Hello traders, this is a complete multiple timeframe analysis of this pair. We see could find significant trading opportunities as per analysis upon price action confirmation we may take this trade. Smash the like button if you find value in this analysis and drop a comment if you have any questions or let me know which pair to cover in my next analysis.

StevenTrading – XAUUSD continues to follow the bullish scenario⚡️ StevenTrading – XAUUSD continues to follow the bullish scenario
Hello Trader
📰 Fundamental Analysis
Gold prices opened higher in Europe as concerns about the U.S. economic health boosted safe-haven demand.
The Senate reached a temporary agreement to end the government shutdown, reducing systemic risk but not eliminating defensive cash flows.
→ This week's bias remains upward, prioritizing trades in line with the main trend.
📊 Technical
Breakout confirmed: the 4.035 zone has been clearly broken, prices closed above and are forming a retest of the 4.035–4.045 box.
The H4 uptrend line holds firm, acting as a “support base” for the continuation scenario.
Key areas:
Support: 4.035–4.045 (retest box), 4.006–4.010 (secondary support along the trendline).
Resistance: 4.077–4.100 (near supply), 4.150 (resistance/candlestick & psychological), 4.225–4.292 (higher resistance).
🎯 Trading Scenario (for reference)
🟢 Buy with the trend – prioritize when retest holds firm
Entry: 4.043–4.045
SL: 4.039
TP: 4.077 → 4.100 → 4.150 → 4.225
Logic: Pullback to the 4.035–4.045 box + holding above the trendline ⇒ continuation to upper supply zones.
Customization: if the market retests deeply to 4.035–4.038, only consider entry when M30 shows a clear rejection signal (pin bar/engulf) and volume supports.
🔴 Reactive sell – only short scalp at resistance
Zone: 4.150
SL: 4.156
TP: 4.125 → 4.100
Note: Only enter with clear rejection on M15–M30; do not hold overnight when the major trend still supports an increase.
⚠️ Risk & Invalidation
Invalidation of buy setup: H4 candle closes below 4.035 (losing retest box); especially below 4.006 (breaking secondary support/trendline) ⇒ pause long, wait for new structure.
Invalidation of sell scalp setup: H4 closes above 4.156/holds 4.150 ⇒ stop selling, wait for pullback to buy.
Risk management: ≤ 1%/trade; enter/exit according to plan, do not chase prices within the zone.
—
This article reflects the personal views of StevenTrading. If you find it useful, please Like & Comment so I can update the plan daily.

XAU/USD 10 September 2025 Intraday AnalysisH4 Analysis:
-> Swing: Bullish.
-> Internal: Bullish.
Analysis and bias remains the same as analysis dated 20 October 2025.
Price has printed as per previous intraday expectation by printing a bearish CHoCH which indicates, but not confirms, bullish pullback phase initiation.
Price is currently trading within an established internal range, however, I will continue to monitor price with regards to depth of pullback.
Intraday expectation:
Price to continue bearish, react at either discount of 50% internal EQ, or H4 supply zone before targeting weak internal high priced at 4,380.990.
Note:
The Federal Reserve’s sustained dovish stance, coupled with ongoing geopolitical uncertainties, is likely to prolong heightened volatility in the gold market. Given this elevated risk environment, traders should exercise caution and recalibrate risk management strategies to navigate potential price fluctuations effectively.
Additionally, gold pricing remains sensitive to broader macroeconomic developments, including policy decisions under President Trump. Shifts in geopolitical strategy and economic directives could further amplify uncertainty, contributing to market repricing dynamics.
H4 Chart:
M15 Analysis:
-> Swing: Bullish.
-> Internal: Bearish.
You will note how price remains contained in consolidation between a supply and demand zone. The rest of my analysis and bias remains the same as bias date 29 October 2025.
As expected, price has printed a bullish CHoCH to indicate bullish pullback phase initiation.
Price is now trading within an established internal range.
Intraday expectation:
Price to continue bullish, react at either premium of internal 50% EQ or M15 demand zone before targeting weak internal low, priced at 3,886.465.
Note:
Gold remains highly volatile amid the Federal Reserve's continued dovish stance, persistent and escalating geopolitical uncertainties. Traders should implement robust risk management strategies and remain vigilant, as price swings may become more pronounced in this elevated volatility environment.
Additionally, President Trump’s tariff announcements, particularly against China, are expected to further amplify market turbulence, potentially triggering sharp price fluctuations and whipsaws.
M15 Chart:

Gold Bearish Reversal Setup Near 4078 Sell ZoneGold (XAU/USD) is showing a potential bearish setup as price approaches the sell zone near 4078. A rejection from this level could push the price down toward the 4050 target, aligning with the highlighted support zone.

The bulls are back, and going long remains the main theme.#XAUUSD OANDA:XAUUSD TVC:GOLD
Although the beginning of the week didn't offer a pullback entry opportunity, gold rallied immediately after the open, breaking through 4030 as expected and continuing its upward trend, officially signaling the return of the bulls to the market.
From the hourly chart, gold broke through the resistance of the upward channel at 4055 and continued to fluctuate upwards, indicating that the bullish momentum remains strong in the short term. However, attention should be paid to the resistance at 4080-4100 from the weekly MA5 moving average and the daily middle line, and be wary of a possible pullback after a surge. Therefore, in the short term, avoid blindly chasing the rally, patiently waiting for a pullback to buy remains our main trading strategy. The first support level to watch is the 4055-4045 level, a previous resistance turning point, followed by the important support at 4030-4020.
Therefore, if gold prices fall back after encountering resistance during the European session, we can consider going long on gold in batches based on the strength of the pullback.
