XAU/USD: Powell vs. The Discount ZoneHey traders! Gold (XAU/USD) is caught in a fierce battle: a hawkish Fed is boosting the USD, while the risk of a US government shutdown offers support to Gold.
📰 Key Fundamental Drivers:
The Fed & Powell: Interest rates are likely to remain high (Hawkish stance), pushing the USD stronger and applying DOWNWARD pressure on Gold.
US Government Shutdown: The economic risk could limit the USD's rally, providing support for Gold (the safe-haven asset).
📉 Technical Analysis:
Price is currently moving within a Rising Wedge (a bearish reversal pattern) and heading towards a critical Strategic Support Zone (Discount Zone).
🔥 Strategic Support Zone (The Discount Zone): $3,941 - $3,953. This is an attractive price area to look for a Buy (Long) opportunity with a good risk/reward ratio.
Major Resistance Zone: $4,004 - $4,025.
🎯 Two-Sided Strategy:
1. The Bullish Scenario:
Action: Wait to BUY (LONG) when the price hits $3,941 - $3,953 and shows a strong reversal signal.
Target: $4,004 - $4,025.
2. The Bearish Scenario:
Action: SELL (SHORT) if price is strongly rejected at $4,004 - $4,025 OR if price breaks decisively below $3,941.
Target: Below $3,900.
🚨 Warning: Keep a close watch on comments from FOMC members this week to properly position your risk.
#xauusd #forex #powell #fomc #technicalanalysis #gold #usd #discountzone #tradingview
Xauusdanalysis

XAU/USD 04 November 2025 Intraday AnalysisH4 Analysis:
-> Swing: Bullish.
-> Internal: Bullish.
Analysis and bias remains the same as analysis dated 20 October 2025.
Price has printed as per previous intraday expectation by printing a bearish CHoCH which indicates, but not confirms, bullish pullback phase initiation.
Price is currently trading within an established internal range, however, I will continue to monitor price with regards to depth of pullback.
Intraday expectation:
Price to continue bearish, react at either discount of 50% internal EQ, or H4 supply zone before targeting weak internal high priced at 4,380. 990.
Note:
The Federal Reserve’s sustained dovish stance, coupled with ongoing geopolitical uncertainties, is likely to prolong heightened volatility in the gold market. Given this elevated risk environment, traders should exercise caution and recalibrate risk management strategies to navigate potential price fluctuations effectively.
Additionally, gold pricing remains sensitive to broader macroeconomic developments, including policy decisions under President Trump. Shifts in geopolitical strategy and economic directives could further amplify uncertainty, contributing to market repricing dynamics.
H4 Chart:
M15 Analysis:
-> Swing: Bullish.
-> Internal: Bearish.
Analysis and bias to remain the same as yesterday's bias date 29 October 2025.
As expected, price has printed a bullish CHoCH to indicate bullish pullback phase initiation.
Price is now trading within an established internal range.
Intraday expectation:
Price to continue bullish, react at either premium of internal 50% EQ or M15 demand zone before targeting weak internal low, priced at 3,886.465.
Note:
Gold remains highly volatile amid the Federal Reserve's continued dovish stance, persistent and escalating geopolitical uncertainties. Traders should implement robust risk management strategies and remain vigilant, as price swings may become more pronounced in this elevated volatility environment.
Additionally, President Trump’s tariff announcements, particularly against China, are expected to further amplify market turbulence, potentially triggering sharp price fluctuations and whipsaws.
M15 Chart:

ElDoradoFx – GOLD (XAUUSD) ANALYSIS (04/11/2025, LONDON SESSION)1. Market Overview
Gold enters the London session trading just below the $4,000 handle, recovering after an early Asian dip to $3,970. The market remains in a range-to-accumulation phase, consolidating beneath descending structure resistance ($4,008–$4,016) and above key support ($3,985–$3,970). Momentum indicators suggest early bullish restoration, but price action remains capped under the 200EMA, awaiting a confirmed breakout to define London’s direction.
⸻
2. Technical Breakdown
🔹 Daily (D1)
Gold holds above the 100EMA, keeping the medium-term structure bullish. RSI at ~50.5 indicates neutrality after a corrective pullback from $4,046. As long as price stays above $3,985, the bullish structure remains intact.
🔹 H1
The pair trades within a descending channel, testing dynamic resistance at $4,004–$4,008. The 50EMA is flattening near the 200EMA, hinting at a potential cross for trend continuation. MACD is stabilizing with higher histogram lows, a bullish sign of momentum recovery.
🔹 15M–5M
Short-term structure shows a series of higher lows (3,970 → 3,982 → 3,993) but faces a clear supply ceiling at 4,004–4,010. RSI around 55–60; MACD positive, suggesting accumulation pressure and reduced selling volume.
⸻
3. Fibonacci Analysis (Swing 3,970 → 4,008)
• 38.2% = 3,993
• 50.0% = 3,989
• 61.8% = 3,985
🎯 Golden Zone: 3,993 – 3,985 → Active demand area for potential long entries.
⸻
4. High-Probability Trade Scenarios
📈 BUY SCENARIO (Primary Bias)
• Buy Zone: 3,993 – 3,985 (Golden Zone)
• Confirmation: Bullish CHoCH or engulfing candle in zone with RSI > 50
• Targets: 4,004 → 4,016 → 4,028 → 4,046
• Stop Loss: Below 3,970
📊 Justification: The Golden Zone aligns with previous liquidity sweep and ascending channel support — strong probability for continuation if defended during London volatility.
💥 Breakout BUY Setup
• Trigger: Break & close above 4,008
• Retest Entry: 4,004–4,006
• Targets: 4,016 → 4,028 → 4,046 → 4,060
• Stop Loss: Below 3,995
📉 SELL SCENARIO (Countertrend)
• Sell Zone: 4,004 – 4,016 (EMA confluence & descending structure)
• Confirmation: Bearish rejection or RSI divergence > 65
• Targets: 3,989 → 3,970 → 3,945
• Stop Loss: Above 4,020
📊 Justification: A rejection from this area would indicate failed breakout momentum, creating a high R:R short toward range support.
⚠️ Break & Retest SELL Setup
• Trigger: Break below 3,970
• Retest Entry: 3,978–3,974
• Targets: 3,965 → 3,945 → 3,920
• Stop Loss: Above 3,985
⸻
5. Fundamental Watch
• UK/EU Data: Light calendar — focus remains on USD strength and DXY (106.10).
• US Factors: Factory Orders and Fed speakers later today; could affect volatility mid-London to NY overlap.
• Sentiment: Gold remains technically bullish but constrained by short-term dollar resilience and yield stabilization.
⸻
6. Key Technical Levels
Type Levels Notes
Resistance 4,004 / 4,016 / 4,028 / 4,046 Supply + 200EMA zone
Support 3,993 / 3,985 / 3,970 / 3,965 Fibo + structural base
Golden Zone 3,993 – 3,985 Main liquidity pivot
Break Buy Trigger Above 4,008 Confirmed bullish continuation
Break Sell Trigger Below 3,970 Bearish momentum confirmation
⸻
7. Analyst Summary
Gold is building pressure within a compressed wedge, where the Golden Zone (3,993–3,985) represents the pivot of the day.
Momentum indicators lean bullish, but the 200EMA and trendline resistance near 4,004–4,008 remain the key barriers.
A clean breakout above 4,008 opens the path to 4,028–4,046, while failure to hold above 3,985 may trigger a retracement to 3,965–3,945.
⸻
8. Final Bias Summary
✅ Primary Bias: Bullish above 3,985
⚠️ Neutral Zone: 3,985–4,004 (wait for breakout confirmation)
❌ Bearish Only Below: 3,970
🎯 Expert Outlook: Focus on buying dips near the Golden Zone with confirmation; avoid premature entries before breakout validation.
⸻
🥇 ElDoradoFx PREMIUM 3.0 – PERFORMANCE 03/11/2025 💸
📊 Smart Entries | Clean Profits | No Drawdown
━━━━━━━━━━━━━━━
🪙 GOLD RESULTS
🟢 BUY +120 PIPS
🟢 BUY +30 PIPS
🔻 SELL +90 PIPS
🟢 BUY +40 PIPS
🟢 BUY LIMIT +200 PIPS
🔻 SELL +20 PIPS
🟢 BUY +40 PIPS
🟢 BUY +20 PIPS
🟢 BUY +40 PIPS
💰 GOLD TOTAL: +600 PIPS
━━━━━━━━━━━━━━━
📱 BTC/USD WEEKEND TRADES
🚀 BUY +900 PIPS
🚀 BUY +1,300 PIPS
📱 BTC TOTAL: +2,200 PIPS
━━━━━━━━━━━━━━━
📊 COMBINED GAIN: +2,800 PIPS
✅ 11 Trades → 11 Wins | 0 SL | 0 BE
🎯 Accuracy: 100%
━━━━━━━━━━━━━━━
🔥 Flawless start to November — precision entries, strong momentum, and clear profit execution across GOLD and BTC!
👏 Congratulations if you profited! ✅✅✅🚀🚀🚀

XAU/USD Intraday Plan | Watching 3957–3918 for Buyer ReactionGold remains in consolidation after failing to break above the 4042 resistance yesterday. The rejection from the MA200, followed by a break below the 3989 support level.
Price is now trading around 3982, approaching the First Reaction Zone (3957–3918). If this zone fails to hold, further weakness could expose the Support Zone (3884–3851), followed by the HTF Support Zone (3820–3781) as deeper reaction levels.
To shift momentum back to the upside, buyers need to reclaim 3989 and 4042, with the MA200 continuing to act as a major dynamic resistance.
📌 Key levels to watch:
Resistance:
3989
4042
4090
4142
Support:
3957
3918
3884
3851
🔎 Fundamental Focus:
There are no major economic releases on the calendar today, but traders should remain cautious as political headlines and broader fundamental developments can still drive sharp moves in gold.

Gold Awaits Direction Near $4,000 as Fed Comments Limit Upside🔍 Market Context
Gold is trading slightly below the $4,000 mark in early Asian hours, pressured by the Fed’s hawkish tone despite weaker US manufacturing data.
Fed Chair Jerome Powell signaled that another rate cut this year is “not guaranteed”, tempering expectations for further easing.
Meanwhile, ISM Manufacturing PMI slipped to 48.7 in October, below forecast — showing a slowdown, yet not enough to shift the Fed’s cautious stance.
Markets currently price in a 70% chance of a 25 bps cut in December and a total 82 bps by end-2026, reflecting moderate easing expectations rather than a full pivot.
📊 Technical Outlook (H1–H4)
Gold is consolidating around the 3,984–3,985$ area, forming a reaction base above 3,963$ support.
The structure remains within a short-term ascending channel, with the next directional cue likely from the 4,024$ resistance zone.
Key Levels:
• Support 1: 3,963$ – 3,984$ (liquidity defense zone)
• Support 2: 3,923$ (bullish invalidation level)
• Resistance 1: 4,024$
• Resistance 2 / Target: 4,046$
A sustained break above 4,024$ could trigger momentum toward 4,046$, confirming trend continuation.
Conversely, losing 3,963$ would expose 3,923$ as the next liquidity pool before a potential rebound.
🎯 Trading Outlook
Bias remains neutral-to-bullish as long as 3,963$ holds.
If price reacts positively at this zone during the Asian session, short-term buyers may step in toward 4,024$–4,046$.
However, any fresh hawkish comments from Fed officials could cap gains and trigger profit-taking.
⚜️ MMFLOW Insight:
“Liquidity builds where patience fades — smart money waits for the crowd to act first.”

Elliott Wave Analysis – XAUUSD | November 04, 2025
🔹 Momentum
D1 timeframe:
D1 momentum has entered the overbought zone — this signals that the bullish momentum is weakening and a potential reversal could occur today or tomorrow.
H4 timeframe:
H4 momentum is currently in the oversold zone and preparing for a bullish reversal. This suggests that the market may produce 4–5 consecutive bullish H4 candles to lift momentum back toward the overbought region.
H1 timeframe:
H1 momentum is also turning upward, indicating that a short-term bullish phase may be forming.
________________________________________
🔹 Wave Structure
D1 timeframe:
A WXY corrective structure is forming. Wave W appears to be completed, and the current move is part of wave X.
However, this X wave seems relatively shallow, and with D1 momentum already in the overbought zone, there’s likely only one final upward push left to complete wave X before a possible reversal.
H4 timeframe:
Given that D1 is already overbought, the yellow wave (4) scenario remains the primary outlook.
Still, since H4 momentum is about to turn upward, there’s a high probability of one last upward movement to finish wave X before resuming a downward move.
H1 timeframe:
On H1, price action is forming a red WXY structure for wave X.
Wave W has already completed, and price is currently developing within wave X (red).
Inside this X wave, a black abcde triangle is taking shape, with price currently hovering near the lower boundary (ac line) of the triangle.
• If wave e (black) ends near the ac line, the triangle pattern will be complete → price is expected to break above the upper boundary, triggering an upward continuation as wave Y.
→ This aligns with the bullish reversal signals seen in H4 and H1 momentum.
• Conversely, if price breaks below the ac line and drops under 3927, it would suggest that the purple X wave on D1 has already completed, and the market may resume a downtrend following D1 momentum.
________________________________________
🔹 Trading Plan
• Buy Stop: 4000
• Stop Loss: 3973
• Take Profit 1: 4050
⚠️ Note: The current candle range is quite wide → stop loss is relatively large, so it’s advisable to reduce position size and manage trades carefully.

Gold is sideways and waiting for a breakout⭐️GOLDEN INFORMATION:
Gold (XAU/USD) slips toward $4,000 in early Asian trading on Tuesday as investors scale back expectations for additional Federal Reserve (Fed) rate cuts. Markets now await comments from Fed Governor Michelle Bowman later in the day.
Last week, the Fed delivered its second rate cut of the year, lowering the benchmark range to 3.75%–4.00%. However, Chair Jerome Powell’s remark that another cut is “not a foregone conclusion” reinforced a hawkish tone, pressuring the non-yielding metal.
⭐️Personal comments NOVA:
Gold price is still maintaining the accumulation price range, not clearly determining a certain trend. Waiting for a breakout.
⭐️SET UP GOLD PRICE:
🔥SELL GOLD zone: 4089 - 4091 SL 4096
TP1: $4076
TP2: $4050
TP3: $4030
🔥BUY GOLD zone: 3922 - 3920 SL 3915
TP1: $3940
TP2: $3950
TP3: $3965
⭐️Technical analysis:
Based on technical indicators EMA 34, EMA89 and support resistance areas to set up a reasonable sell order.
⭐️NOTE:
Note: Nova wishes traders to manage their capital well
- take the number of lots that match your capital
- Takeprofit equal to 4-6% of capital account
- Stoplose equal to 2-3% of capital account

Gold Price Outlook – Trade Setup (XAU/USD)📊 Technical Structure
OANDA:XAUUSD Gold is struggling to stay above $3,980, with clear resistance forming at $3,997–$4,005, just below the psychological $4,000 barrier. The price structure indicates a bearish short-term bias: rallies toward resistance may attract sellers targeting the $3,964–$3,956 support zone.
A sustained break below $3,956 would likely extend the decline toward $3,945, while only a decisive close above $4,010 would invalidate the downside bias.
🎯 Trade Setup
Entry: $3,997 – $4,005 (resistance retest)
Stop Loss: $4,007
Take Profit: $3,964 / $3,956
Risk-Reward Ratio: ≈ 1 : 4.67
🌐 Macro Background
Gold prices remain under pressure near $4,000 after the Federal Reserve’s hawkish tone boosted the U.S. Dollar.
As FXStreet’s Lallalit Srijandorn wrote: “Gold trades in negative territory near $4,000 as traders dial back expectations for additional Fed rate cuts.” 【FXStreet】
Fed Stance: Chair Jerome Powell stated another rate cut this year is “not a foregone conclusion.” Markets now assign roughly 70% odds of a 25bps cut in December, down from over 90% a week ago.
Data Impact: The ISM Manufacturing PMI fell to 48.7 in October (vs. 49.5 expected), highlighting slowing U.S. manufacturing — a potential drag on the dollar if weakness deepens.
Upcoming Event: Traders are watching ADP employment data (Wednesday) for labor market clues; weaker results may offer short-term relief for gold.
However, with the Fed maintaining a restrictive stance and the USD regaining momentum, gold’s upside remains capped in the near term.
🔑 Key Technical Levels
Resistance: $3,997 – $4,005
Support: $3,964 – $3,956
Psychological Level: $4,000
📌 Trade Summary
Gold remains confined below $4,000 amid hawkish Fed rhetoric and mixed U.S. data.
Short-term strategy favours selling rallies near $4,000, targeting $3,956, with stops above $4,007.
Only a breakout above $4,010 would shift bias to neutral.
⚠️ Disclaimer
This analysis is for reference only and does not constitute trading advice. Trading involves significant risk, and proper risk management is essential.

Candle Range Theory (CRT) Predicts Major Drop to BTLhe market just executed a perfect high-timeframe manipulation play right at a key institutional zone! This setup screams Distribution phase according to the CRT model.
🔑 The CRT Breakdown:
The Accumulation/Range Phase: Price consolidated horizontally below the 4h Bearish FVG, creating a clear range and collecting liquidity.
The Manipulation Phase (The Sweep): We saw the classic "False Breakout" above the range, perfectly sweeping the Buy-side Liquidity (BSL) just below the strong Bearish FVG 4h level ($4,024 area). This move trapped late-movers into long positions. 🎣
CRT Confirmation Candle: The subsequent candle action gave us the marked "Thick closure candle to scare bulls". This is the market's confirmation that the manipulation is complete and the directional move is about to start, using the volume/range from that candle to define intent.
The Distribution Phase (The Drop): Price is now breaking down, effortlessly slicing through the smaller FVGs (Fair Value Gaps) below $4,005. This shows clear displacement and an imbalance in supply. 🌊
🎯 The Target:
With the high-level sweep complete, the market is now magnetised to the next major pool of liquidity: the BTL (Buy-side Trapped Liquidity), which is the clear low on the 4h chart near $3,927.16.
If the $4,000 psychological support breaks decisively, expect a fast move down to clear that BTL!
Risk Management is Key! Protect capital as the $4k level can be volatile.
Bias: Strongly Bearish
Entry Confirmation: Clean close below the $4,000 zone.
Target: BTL at $3,927.16
What's your take? Is $4,000 the final defense line? Let me know! 👇
Greetings,
MrYounity

ElDoradoFx – GOLD SESSIONS ANALYSIS (03/11/2025, PRE-ASIA SESSIGold ends the NY session stabilizing near 4,009, after multiple rejections from 4,025–4,030, confirming that sellers are still defending the upper liquidity zone. Meanwhile, buyers continue holding 4,004–3,995, maintaining a short-term ascending structure. This compression phase between resistance and support signals an imminent breakout setup — with Asia likely to decide direction for the next leg.
⸻
📊 Technical Outlook
🔹 D1: Gold remains bullish above the 100EMA, sustaining higher lows from 3,962 → 3,985 → 3,995. RSI ~52 — neutral but holding mid-range momentum. Daily breakout above 4,025 could reopen the path toward 4,060–4,082.
🔹 H1: Structure compressing between 4,025 resistance and 3,995 support. EMAs converging; MACD neutral with low volatility — ideal for a pre-breakout scenario.
🔹 15M–5M: Price forming equal highs at 4,011–4,012 and higher lows near 4,004. RSI 54–58, indicating gradual bullish accumulation before volatility expansion.
⸻
✨ Fibonacci Golden Zone (Last Swing 3,995 → 4,030)
38.2% = 4,016
50.0% = 4,012
61.8% = 4,008
🎯 Golden Zone: 4,016 – 4,008 (acting as key liquidity zone and short-term pivot).
⸻
🎯 High Probability Zones
📈 BUY SCENARIO (Primary Bias)
✅ Buy Zone: 4,016 – 4,008 (Golden Zone)
🎯 Targets: 4,025 → 4,036 → 4,046 → 4,060
🛑 Stop Loss: Below 3,995
⚡ Confirmation: Bullish engulfing or CHoCH above 4,012–4,016 with MACD crossover upward.
📊 Bias Rationale: The market continues to respect higher lows and absorb liquidity dips — indicating smart money accumulation around the Golden Zone.
💥 Breakout BUY Setup
Trigger: Break & close above 4,025
Retest: 4,022–4,024
🎯 Targets: 4,036 → 4,046 → 4,060 → 4,082
🛑 Stop Loss: Below 4,010
📉 SELL SCENARIO (Contingency Setup)
⚠️ Sell Zone: 4,025 – 4,036 (liquidity pocket + supply zone)
🎯 Targets: 4,012 → 4,004 → 3,985 → 3,965
🛑 Stop Loss: Above 4,046
⚡ Confirmation: Sharp rejection or RSI divergence >65 from 4,025–4,030 area.
📉 Break & Retest SELL Setup
Trigger: Break below 3,995
Retest: 4,000–3,997
🎯 Targets: 3,982 → 3,965 → 3,945
🛑 Stop Loss: Above 4,008
⸻
📰 Fundamental Watch
• Asia session: Low-impact day; volatility expected from liquidity sweeps.
• US Dollar Index (DXY) holding above 106 — mild pressure on gold short-term.
• Global markets: Traders positioning ahead of Fed and NFP later this week, keeping gold in range mode for now.
⸻
📌 Key Levels
Resistance: 4,025 / 4,036 / 4,046 / 4,060
Support: 4,012 / 4,004 / 3,995 / 3,982
Golden Zone: 4,016 – 4,008
Break Buy Trigger: > 4,025
Break Sell Trigger: < 3,995
⸻
✅ Summary (Expert View)
Gold remains bullish-to-neutral, consolidating between 4,004–4,025.
The Fibonacci Golden Zone (4,016–4,008) continues to act as the core decision area — expect Asia to attempt a liquidity sweep before breakout.
⚡ Expert Bias: BUY setup favored above 4,008, targeting 4,036–4,046.
Bearish bias only if 3,995 breaks cleanly.

XAU/USD – Bearish Continuation Outlook (Smart Money Framework)XAU/USD – Bearish Continuation Outlook (Smart Money Framework)
🧭 Market Structure Overview
The major structure is bearish — confirmed by a Market Structure Break (MSB) after the last swing high.
Every bullish move since then is viewed as a retracement into premium price for better short entries.
Smart Money likely accumulating shorts above internal liquidity levels before driving price lower.
🟩 Premium Supply Zones (Sell Areas)
1️⃣ Be-BB (Bearish Breaker Block) → 4,180 – 4,240
💣 Main shorting area
Price expected to tap this level to mitigate sell-side imbalance.
Watch for liquidity grab above 4,060 before reversal.
Confirmation: bearish engulfing or BOS on lower timeframes (LTF).
2️⃣ Be-OB (Bearish Order Block) → 4,260 – 4,320
🚫 Last line of defense for bears
If price reaches here, expect a strong rejection due to trapped buyers and institutional orders.
Perfect “last tap” zone before deep markdown.
🟥 Discount Demand Zones (Targets)
🔻 Primary Demand Zone Area → 3,820 – 3,870
Previous accumulation zone (high-volume node).
Take-profit target for swing shorts.
Potential re-entry area for Smart Money to reload buys later.
🎯 Expected final destination if bearish pressure sustains.
📉 Bearish Scenarios
⚔️ Scenario 1 – Textbook Smart Money Setup
Price retraces to 4,060–4,180 zone (Be-BB).
Liquidity grab above 4,060 (previous high).
Bearish rejection → BOS → Sell continuation.
Targets: 3,939 → 3,870 → 3,820.
💥 Most probable scenario.
⚔️ Scenario 2 – Deep Retracement Then Dump
Bulls push higher into 4,260 (Be-OB).
Liquidity sweep and institutional fill.
Massive rejection → sell-off continuation.
🔥 Deeper pullback = bigger sell move later.

Can gold prices go long amid a narrow stalemate?#XAUUSD TVC:GOLD OANDA:XAUUSD
Gold prices continued to fluctuate narrowly throughout the evening⚖️, with the hourly and 2-hour moving averages converging in the 4010-4005 range, as both bulls and bears awaited a clear directional decision from the market.📊
However, from a technical perspective, gold prices have failed to break below the 4-hour moving average support at 3995 and the daily MA5 at 3985📈. These are crucial short-term support levels🚀, and the fact that gold prices haven't broken them confirms strong buying support below💪. This suggests that any short-term decline should be viewed as a technical correction rather than a market reversal.🤔
Therefore, although the short-term direction is not yet clear, considering the support formed by the 4-hour moving average and the daily MA5, I remain bullish and await a breakout from the consolidation pattern in gold prices🐂.
There may not be much clear information tonight, so let's take a look at the performance of gold prices in the Asian session👀. In summary, the current trend is still in an upward channel. As long as the 3995-3985 level holds, I will maintain a bullish view. On the upside, pay attention to the short-term resistance at 4020-4030🤩.

Gold Analysis Today 3 Nov | XAUUSD Forecast | Smart Analysis🟡 GOLD ANALYSIS What’s Moving the Market Today?
📅 Updated: November 3, 2025
💎 Trade with DECRYPTERS
⚡ Market Snapshot
Gold is holding steady near the $4,000 pivot after Friday’s weaker jobs data.
📉 DXY slips to 99.73 after a soft October payrolls print (+22K vs. 150K exp).
🏦 Fed’s 25bps cut to 3.75–4.00% with no clarity on December weighing on yields.
🌍 Central banks continue heavy gold buying: +19t in August, +220t in Q3 (Poland & Azerbaijan lead).
💥 Geopolitical tensions & tariff risks are keeping safe-haven demand elevated.
📈 ETF inflows: +222t in Q3 offset jewelry weakness investment demand remains strong.
🧠 Smart Money & Technical Framework
🟧 Gold Sell Area: 4026 – 4038
🔴 Smart Money Sell Zone: 4071.8 – 4085
🟨 Gold Buy Area: 3964 – 3978
🟢 Smart Money Buy Zone: 3912 – 3922
💬 Millions of orders clustered across these zones watch for liquidity sweeps before reversals.
📊 Live Market Context
💰 Current Price: ~$4,017/oz (+0.16%)
📉 Daily Range: High ~4,015 / Low ~3,991
🔁 Structure: Gold consolidating within key SMC range; breakout above 4,038 opens path to 4,071+, while rejection near 4,085 favors short setups back to 3,978–3,964.
🔍 What to Watch Next
📆 Nov 13 CPI (core ~3.0% exp)
Hot print → Fed pause → bearish for gold
Soft print → renewed cut bets → bullish continuation
🏦 ECB & BOJ meetings this week:
Dovish tone = USD weakness → supports gold
🌏 US–China trade rhetoric:
Optimism fades → safe-haven spike
Renewed deal talks → short-term pullback
🧭 Trading Plan — Keep It Simple
🔹 Buy Zone (3964–3978): Look for bullish reaction; smart money likely absorbing liquidity.
🔹 Sell Zone (4026–4038): Ideal to fade rallies if momentum stalls.
🔹 Smart Money Extremes (3912 / 4085): Expect deep liquidity grabs before reversals.
🎯 Targets: 4,071 (resistance) / 3,964 (support).
❗ Bias: Mildly bullish above 4,000 dips to buy, rallies to fade.
🏁 Conclusion
Gold remains range-bound between $3,964 and $4,038, anchored by central bank demand and weaker US data.
As long as $4,000 holds, bias leans bullish toward $4,071–$4,085.
Break below $3,964 shifts short-term tone bearish toward $3,922.

Above 4000, continue to be bullish on gold.#XAUUSD OANDA:XAUUSD TVC:GOLD
Gold prices fell after opening lower in Asian trading today, but rebounded after touching the key support zone of 3960-3950 and then entered a narrow range of fluctuation. Judging from the current trend, gold is still in an upward channel, and the price is still stabilizing above the daily MA5. Therefore, as long as it does not break below the daily MA5 of 3985, we can continue to maintain a bullish view.
Observing the 1H and 4H charts, we can see that the moving average support is basically maintained in the 4010-4000 range. If the gold price retraces to this range in the short term, we can consider going long on gold. Meanwhile, the first resistance level to watch is 4035-4045, which is both the rebound high point that gold prices repeatedly tested last Friday and the location of the daily MA10 moving average. Only by breaking through and stabilizing above this level will gold prices further test the upper resistance of 4050, or even higher.

XAU/USD – Gold Accumulates Before Breakout, Target 4,096 USD🔍 Market Context
Gold is trading within a symmetrical triangle pattern , reflecting short-term accumulation before forming a new breakout wave.
After a sharp decline from the peak of 4,096 USD, the market has shown two instances of Change of Character (ChoCH) – an early sign indicating the return of buying pressure.
As long as the price holds above the 3,959 – 3,917 USD range, the short-term bullish structure remains intact. This support zone serves as a crucial “discount zone” in the current accumulation cycle.
💎 Key Technical Zones
• Support Zone 1: 3,959 USD → main structure holding area, coinciding with the lower trendline.
• Support Zone 2: 3,917 USD → final liquidity reaction zone.
• Resistance Zone: 4,040 USD → potential break & retest area.
• Liquidity Zone: 4,096 USD → expansion target if the peak is broken.
🎯 Trading Scenarios
1️⃣ BUY Setup – Favoring the bullish structure
• Entry: 3,959 – 3,917 USD
• Stop Loss: 3,905 USD
• Take Profit:
– TP1: 3,985
– TP2: 4,040
– TP3: 4,072
– TP4: 4,096
✳️ “Buy the discount” – prioritize buying orders at the confluence support zone of trendline + FVG to follow the SMC flow.
2️⃣ SELL Scalp – Secondary strategy when price reacts at the peak
• Entry: 4,096 USD
• Stop Loss: 4,108 USD
• Take Profit:
– TP1: 4,072
– TP2: 4,040
– TP3: 3,985
✳️ “Sell the premium” – only activate if there is a strong price rejection signal at the liquidity peak.
💬 Conclusion
The short-term trend of gold remains bullish as the price stays above the trendline and continuously forms higher lows.
The main strategy is buy the dip – sell reaction around the 3,959 → 4,096 USD range.
The confirmation point for a strong bullish trend will be when the price closes steadily above 4,040 USD .
“Smart money accumulates in silence before the market makes noise.”
⏰ Timeframe: 1H
📅 Update: 03/11/2025
✍️ Analysis by: Captain Vincent

#XAUUSD(GOLD):We are still bearish, this week is decider! Gold experienced a decline during today’s Asian session before recovering sharply to the 4030 area. Currently, the price is consolidating within a narrow range between 4010 and 4030. This behaviour suggests a period of accumulation, where buyers and sellers are unable to establish a clear directional advantage. Given the anticipated volatility in the coming week, particularly with macroeconomic data releases, traders should exercise caution and implement disciplined risk management strategies.
The initial decline in the Asian session may have been driven by short-term profit-taking and liquidity searches by major market participants. However, the swift recovery to 4030 indicates strong buying interest at lower levels, suggesting that gold remains in a bullish trend on larger timeframes. This range-bound movement between 4010 and 4030 is forming a temporary consolidation zone.
A detailed examination of the 1-hour chart reveals multiple touchpoints within this range, indicating strong short-term support at 4010 and resistance near 4030. Candlestick patterns suggest indecision, with several doji and spinning-top formations, further confirming the likelihood of price manipulation and liquidity grabs throughout the week.
Like and comment for more such chart analysis!
Team Setupsfx_

XAUUSD 4H Bearish setupThe price has tested the brown EMA ribbon (a dynamic resistance area) several times and failed to close above it. This indicates strong selling pressure near 4,045–4,065.
The latest rally failed to break the prior swing high, maintaining the bearish market structure.
Entry Zone: Around 4,035–4,045 (rejection zone)
Stop Loss: Above 4,065 (structure + EMA rejection area)
Targets:
TP1: 3,983 Minor support within prior structure – short-term profit-taking zone
TP2: 3,941 Mid-level Fibonacci extension; key liquidity zone
TP3: 3,901 Full measured move of the prior swing; strong bearish continuation target

Today's gold trading strategyCentral bank gold purchases + Diversification away from the US dollar
Global central banks increase holdings to record levels: In the third quarter of 2025, global central banks' net gold purchases reached 220 tons (up 28% compared to the previous period), and 95% of the surveyed central banks plan to continue increasing their holdings in the next 12 months. Central banks in China, Kazakhstan, and others have been increasing their purchases continuously, forming a "buying buffer" at the $4,000 level, which provides a long-term supporting logic that is irreversible.
The acceleration of de-dollarization is beneficial: 73% of the surveyed central banks predict that the share of US dollar reserves will decrease in the next five years. The substitutive value of gold as a non-credit asset is prominent, and the willingness of central banks in emerging markets to increase their holdings is particularly strong (48% plan to increase holdings). Structural demand supports the upward movement of the gold price median.
Investment demand experiences explosive growth: In the third quarter of 2025, global gold investment demand reached 537 tons (up 47% compared to the previous year), and the "fear of missing out" (FOMO) mentality pushed individual and institutional funds to continuously flow in, forming a positive cycle of "fundamental factors + capital factors".
Today's gold trading strategy
buy:3990-4000
tp:4010-4020
sl:3980

Gold Price Breakout Toward 4,037 Target(XAU/USD) is forming a symmetrical triangle pattern on the 1-hour chart, suggesting potential breakout momentum. The price is currently trading near $4,014, with an upside target of $4,037 if bullish momentum continues. Key support zones are located at $3,960, $3,920, and $3,880.

XAUUSD, BUY TILL 4045XAUUSD, if this running M5 Candle will clsoe above the 4016, market will surely going to touch 4045 level very easily,

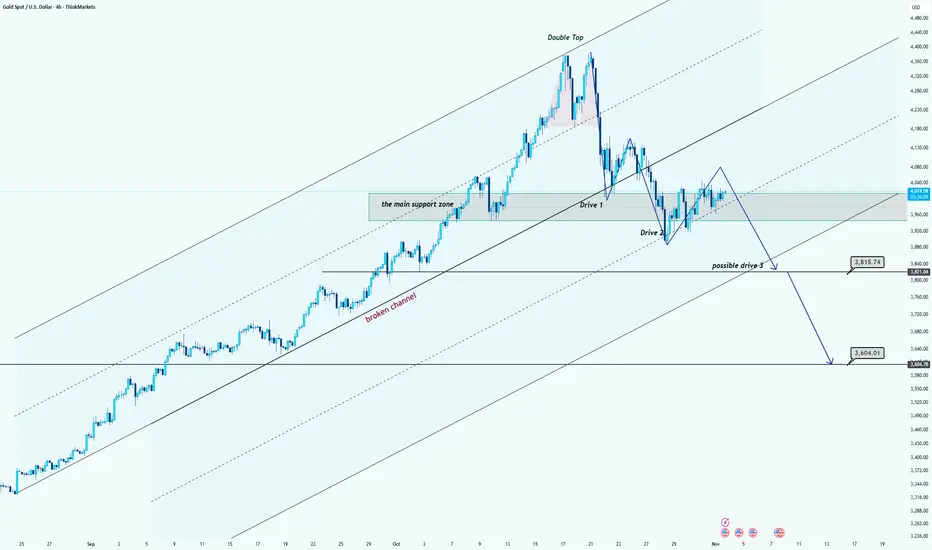
Gold Forming Bearish Three Drives Pattern Below Channel MidlineHi team!
Gold has formed a double top near the upper boundary of a long-term ascending channel, signaling potential exhaustion of the bullish momentum. After breaking below the local support and retesting it, price created a lower high, which confirms a short-term bearish structure.
Currently, the market is consolidating below the midline of the new channel. The recent sequence of moves is forming a potential Three Drives pattern, where Drive 1 and Drive 2 are already complete, and a possible Drive 3 could be developing.
If price fails to reclaim the main support zone around $4,000–$4,050, we can expect a continuation to the downside toward:
$3,815 – the first key support level and measured target for Drive 3.
$3,604 – the next major support zone and lower boundary of the broader channel.
As long as price remains below the recent swing highs, the bearish scenario remains valid. A clear break above the midline of the channel would invalidate this setup and suggest a potential reversal.
Disclaimer: As part of ThinkMarkets’ Influencer Program, I am sponsored to share and publish their charts in my analysis.
SELL XAUUSD (GOLD) - the bearish trend begins!GOLD (XAUUSD) has been struggling to stay bullish in the last recent weeks and has completely reversed. GOLD was in a clear uptrend but eventually broke a powerful trendline which acted as support for several weeks. Gold also tried to test resistance to the upside but struggled to break through it. Time to sell and take profit at the next major support zone!

Gold price analysis November 3🟡 XAUUSD – Recovery Signal Forming
Gold prices are showing signs of returning to an uptrend after a short-term correction. The 4026 area is now acting as an important key level – a stable price above this area would be a confirmation signal that buying pressure is returning to the market.
With recent economic data still supporting the gold uptrend, the current priority strategy is to wait for BUYs following the trend. The sellers can only regain control if the price breaks through the support trendline around 3970, then the downtrend can be re-established.
📈 Sample trading plan:
Buy early around: 4000
Buy intensified when the price breaks above: 4026
Expected target: 4150
Risk: The uptrend is negated when the price closes below the 3970 trendline
