A Healthy Market Breathes. Gold Hasn’t Exhaled Yet.I remain bullish on Gold overall — that’s not in question.
On 24 August, I even shared a complete cross-market outlook arguing that acceleration to the upside could be the next big move. And indeed, we got it.
But here’s the paradox of markets: sometimes, the stronger the rally, the more fragile it becomes.
________________________________________
Why I Warned About a Steep Correction
• Yesterday, I flagged the risk of a sharp pullback. My stop loss was triggered, yes, but my conviction hasn’t changed. If anything, the higher Gold pushes, the more probable and violent the correction could be.
• The daily chart says it all: since the local bottom around 3300, Gold has moved almost vertically higher.
• From 26 August onward, with the sole exception of the 4 September red candle, every single day closed green — and not just small gains, but +1% or more.
This type of move is powerful, but also unsustainable.
________________________________________
Market Psychology at Work
Markets move in cycles of fear and greed, tension and release. A one-sided move — especially a vertical one — compresses tension like a coiled spring. Traders get trapped:
• Late buyers rush in from FOMO, convinced “it will never stop going up.”
• Sellers get squeezed, forced to cover, adding fuel to the fire.
• But eventually, when there’s no one left to buy at higher prices, even a small wave of selling can cascade into a steep correction.
This is why not even Bitcoin, in its glory days, could sustain vertical rises for long. The pattern was always the same: euphoric rise → brutal drop . Gold is no different.
________________________________________
Where We Stand Now
• At the time of writing, Gold trades at 3647, after touching 3660 and marking a new ATH.
• Is this the local top? Hard to say with certainty. But in my book, until we see a strong correction, there is no valid buy trade here.
________________________________________
My Trading Plan
Today, I will look to sell again. Not because I doubt the long-term bullish trend, but because the short-term imbalance is glaring.
A healthy market breathes, and Gold hasn’t exhaled yet.
🚀 Long term: bullish.
⚠️ Short term: vulnerable.
🎯 Until a correction resets the board, my play is on the short side.
Xauusdath

XAUUSD Short- Friday, Sep 5, 2025Here's my perspective on the Gold future price.
Are you with me??
-Moz

The Bigger Picture in Gold: A Complete Cross-Market ViewFor directional swing traders, Gold’s summer price action has been particularly challenging. Strong impulsive moves have frequently been followed by tight consolidations and equally strong reversals, making it difficult to capture clean continuation trades.
In such environments, the most effective strategy is often to step back and reassess the broader context.
In this article, I will attempt to do just that — to strip away the noise of short-term fluctuations and focus instead on the bigger picture shaping Gold’s market direction.
XAUUSD on the Weekly Chart
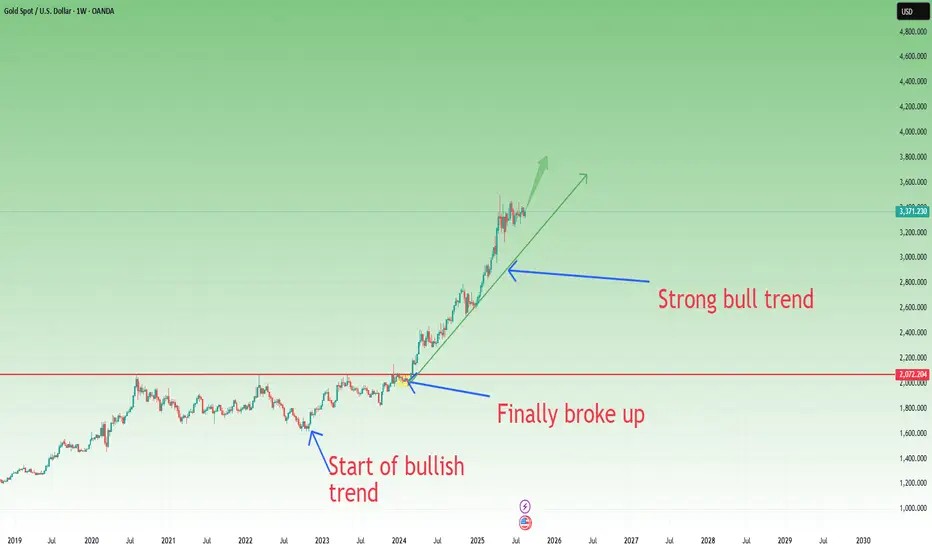
Looking at the weekly timeframe, the beginning of the current uptrend can be traced back to October 2022.
However, it wasn’t until March 2024 that XAUUSD finally broke decisively above the 2000 level. Only after this breakout did the trend accelerate meaningfully to the upside.
From that point, the long-term trend has been clear and technically consistent, with pullbacks and corrections that are typical in such strong advances.
Following the all-time high in late April, XAUUSD entered another corrective phase, and since then the market has been consolidating.
Two key observations stand out:
1. A congestion zone is forming, with both highs and lows tightening over the past four months.
2. An ascending triangle structure is becoming increasingly visible.
On the daily chart, this congestion is even more evident—especially in the past four weeks. Moreover, last week produced an interesting pattern: two strong bullish engulfing candles, the latest triggered by Powell’s remarks on Friday.
Conclusion
In the bigger picture, XAUUSD continues to look bullish as long as price holds above the 3300 level. The consolidation is healthy within the broader uptrend, and the ascending triangle suggests a potential continuation higher once the market resolves this range.
Gold Futures
The picture on Futures is broadly similar, with the uptrend starting in October 2022 and gaining momentum after March 2024. The key distinction here is that the consolidation is forming an ascending triangle, and last Friday’s bullish engulfing candle coincided with a reversal directly off the trendline support.
Note: From my perspective—and I’ve said this before—when I trade Gold, I care about Gold itself as an asset. That’s why I ignore the DXY in my analysis. Instead, I focus on how Gold performs across multiple currencies, which I find far more relevant to understanding its true strength.
XAUEUR
Here as well, the trend is clearly to the upside—confirming what I mentioned earlier: Gold has strengthened regardless of the currency it is priced in.
Over the past month, a well-defined support has formed around 2840. Last week, price action confirmed that level with a strong bullish engulfing candle, followed by two consecutive bullish pin bars.
XAUGBP
The picture is very similar to XAUEUR: the uptrend remains intact, with a clear support base forming. Last week’s price action delivered a bullish engulfing candle followed by a double bullish pin bar, reinforcing the case for continued strength.
XAUJPY
When it comes to the yen, the chart tells a different story. The series of all-time highs began back in 2022, driven not only by Gold’s global strength but mostly by the yen’s pronounced weakness.
Over the past year, price action has remained contained within an ascending channel. While the structure differs from other Gold crosses, it nevertheless continues to suggest underlying strength.
In conclusion, the overall, the bigger picture remains bullish for Gold as long as key supports hold, with the potential for continuation once current consolidations resolve.