XAU/USD Technical Setup ‖ Bullish Momentum or Smart Trap?🏆 XAU/USD: The Golden Heist Blueprint | Swing & Scalp Strategy 💰
📊 Market Overview
Asset: XAU/USD (Gold vs U.S. Dollar)
Market: Precious Metals
Strategy Type: Dual Setup - Swing Trading (Bullish) & Day Trading/Scalping (Bearish)
Risk Level: High Volatility Zone ⚠️
🎯 The Master Plan
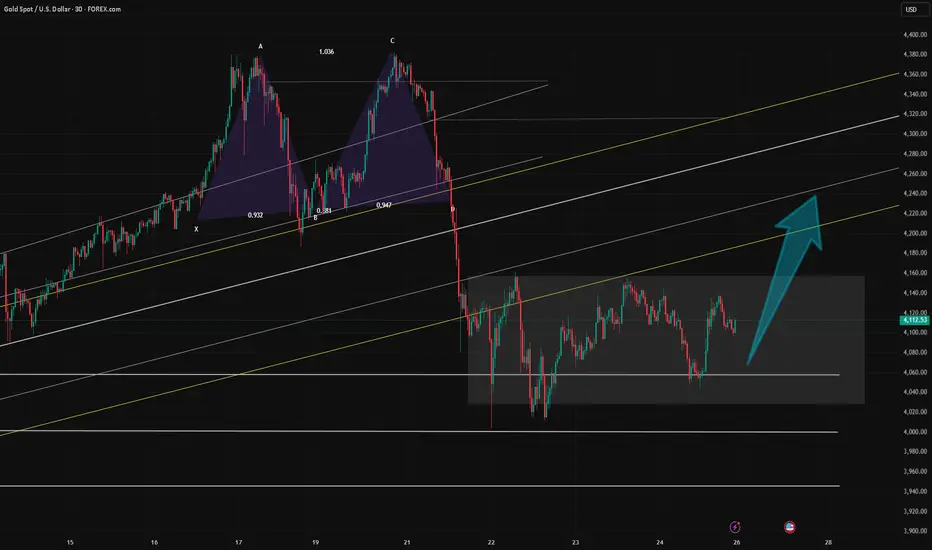
🚀 Bullish Scenario: "To The Moon" Setup
Breakout Level: $4,400.00
Action: Direct long entry on confirmed breakout above resistance
Logic: Clean break = institutional momentum shift
🔻 Bearish Scenario: Scalping/Day Trade Setup
Breakdown Level: $4,050.00
Action: Short positions on confirmed break below support
⚠️ Trap Alert: Any pullback above $4,050.00 post-breakdown = potential smart money trap. Watch for false breakouts!
🛡️ Risk Management Zone
Stop Loss (Pullback Buy Plan): $3,950.00
⚠️ Disclaimer: This SL is based on my analysis for the bullish pullback scenario. You're the captain of your own ship! Adjust stops according to your risk tolerance, account size, and trading style. Never risk more than you can afford to lose.
🎖️ Profit Targets
Buy Side Target: $4,600.00
Exit Strategy Notes:
Strong resistance confluence at this level
Overbought conditions likely
Potential trap zone for late entries
Recommendation: Scale out profits gradually rather than waiting for the full target
Sell Side Target: $4,050.00
Exit Strategy Notes:
Major support level - expect bounces
High probability of liquidity grab at this zone
Consider partial profit taking before reaching full target
Recommendation: Trail stops as price moves in your favor
⚠️ Disclaimer: These targets are MY analysis, not financial advice. Take profits when YOUR strategy signals, not mine. Trail stops, scale out, or exit based on YOUR plan. Your money, your rules! 💪
🔗 Related Markets to Watch
Correlated Assets:
DXY (U.S. Dollar Index): Inverse correlation - Dollar strength = Gold weakness
GC (Gold Futures): Direct correlation - Institutional positioning indicator
XAUEUR (Gold vs Euro): Alternative safe-haven flow gauge
US10Y (10-Year Treasury Yield): Inverse correlation - Rising yields pressure Gold
BTCUSD (Bitcoin): Risk-on/risk-off sentiment indicator
Key Fundamental Drivers:
Fed monetary policy & interest rate decisions
Inflation data (CPI/PCE reports)
Geopolitical tensions (safe-haven demand)
Real yields & opportunity cost
🔑 Key Technical Points
✅ Breakout Confirmation: Wait for candle close above/below key levels
✅ Volume Analysis: High volume breakouts = higher probability
✅ Smart Money Traps: Watch for failed breakouts and liquidity grabs
✅ Risk-Reward Ratio: Calculate before entry - minimum 1:2 recommended
✅ Market Structure: Respect higher timeframe trends
🎭 Trading Psychology Reminder
This strategy has a playful "heist" theme for entertainment, but make no mistake — treat your capital with serious respect. The market doesn't care about our plans. Adapt, manage risk, and preserve capital above all else.
Remember:
No setup is guaranteed
Always use stop losses
Never risk your rent money
Emotions are the enemy
The market pays patient traders
✨ If you find value in my analysis, a 👍 and 🚀 boost is much appreciated — it helps me share more setups with the community!
#XAUUSD #Gold #GoldTrading #ForexTrading #SwingTrading #DayTrading #Scalping #TechnicalAnalysis #PreciousMetals #TradingStrategy #RiskManagement #Forex #GoldAnalysis #TradingIdeas #MarketAnalysis #PriceAction #Breakout #SupportAndResistance #TradingView #ForexSignals
Happy trading, and may the pips be ever in your favor! 🎯💎
Xauusdbuy

Gold: Building a bottom, but caution remainsWeekend Greetings!
Over the past week, gold has been consolidating within the 4160–4000 range. Technically, this range suggests a short-term bottoming phase. However, given that prices recently reached new highs and have since formed a double-top pattern, it’s still too early to confirm a bottom. In the upcoming sessions, traders should remain cautious, avoid chasing highs, and be alert for potential bull traps or a fifth-wave decline, as mentioned last week.
On the 4H chart, higher lows are being established, and Friday’s close was above both the MA5 and MA20, with the MACD maintaining a bullish configuration. The MA60 and MA30 are currently positioned around 4180 and 4163, respectively, serving as key resistance zones. If gold can hold above these levels, there’s a good chance it will approach or even reclaim the 4300 level.
On the daily chart, gold remains supported by the MA20, with long lower wicks indicating active bullish participation, which favors further upside. However, the MA5 and MA10, located around 4154 and 4188, still act as short-term resistance. For a stronger bullish confirmation, the price needs to stabilize above 4160, ideally holding firm above 4180.
On the 30M/1H charts, moving averages are closely aligned, showing short-term consolidation. Notably, the last three candles on the 30M chart form a Morning Star pattern, a typical bullish signal. If this formation remains intact after the market opens, prices are likely to move higher.
From a fundamental perspective, no bearish news emerged over the weekend. Unless unexpected developments occur before the market opens, the technical outlook favors an upward move during Monday’s session.
Review of Gold's Performance This Week📝This week, the gold market experienced severe volatility, showing an overall trend of a sharp decline followed by a volatile rebound. The details are as follows:
📈Price Movement:
On Monday, gold prices fluctuated between 4,218.32 and 4,354.88.
On Tuesday, gold plummeted by 6.3% at one point, marking the largest single-day drop since April 2013.
On Wednesday, it continued to fall, hitting a low of 4,003.43.
On Thursday, gold fluctuated within the range of 4,065.47 to 4,154.52.
On Friday, gold prices fell again, dropping below 4,060 at one stage with an intraday decline of over 1%, and finally closed at 4,110.55.
💡Influencing Factors:
✔The main reasons for the sharp volatility in gold prices this week include the following:
After a rapid rise in early stages, gold was in an overbought state, creating technical correction pressure. Meanwhile, investors had a strong sentiment to take profits, leading to a large number of sell-offs.
✔In addition, the cooling of risk aversion, the strengthening of the U.S. dollar, and the fact that Federal Reserve officials entered a blackout period ahead of the interest rate decision that are resulting in a lack of remarks supporting interest rate cuts in the market also reduced the appeal of gold.
✔However, factors such as the ongoing U.S. government shutdown, geopolitical tensions, and market expectations for further interest rate cuts by the Federal Reserve provided certain support for gold prices.
💎Outlook for the Future:
From a technical perspective:
If gold breaks through 4,161, it may pave the way for a test of 4,200. If it continues to rise, traders may push gold prices above 4,250, or even target 4,300 and higher record highs.
But if gold falls below 4,040, the next target will be the October 22 low of 4,004.

Analysis of gold price trends next weekShort-term catalyst: Risk disturbances and technological stabilization form a synergy
Geopolitical "tail risks" continue to escalate: The escalation of US sanctions against Russian energy giants, the intensification of competition in the technology sector between China and the US, coupled with the 23-day government shutdown crisis in the US, have continuously fuelled market risk aversion. What is even more alarming is that the new restrictions in the Russian energy sector have spilled over to the transportation costs of commodities, and if this potential risk unfolds, it will rapidly drive funds into gold.
Stabilization after sharp decline validates support strength: On October 21, the spot price of gold in London dropped by more than 6% from its historical high of 4,381 US dollars, approaching the 4,100 US dollar mark, but then rebounded rapidly. On October 23, the intraday gain was over 1.27%, recovering most of the lost ground. This "sharp decline without collapse" trend fully confirms the strong support effect in the 4,000-4,100 US dollar range and also reflects the market's recognition of the long-term value of gold.
Technical aspect presents "strong consolidation" characteristics: The daily chart shows that after the price decline, it still operates above the middle band (3,964.72 US dollars) of the Bollinger Bands, without disrupting the upward trend; the RSI indicator has dropped from the overbought zone to the middle-high level of 58.19, which is a healthy "cooling without breaking through". Currently, the price is in the stabilization stage after the correction, and as long as the key support is held, the second upward attack momentum will gradually accumulate.
Trading strategy for gold next week
xauusd @buy4040-4060
TP:4110-4150-4200

Gold: Double Bottom or Five-Wave Decline?After rising to the MA60 area on the 4-hour chart, gold faced significant selling pressure, and the price has now pulled back to around 4050, which lies near the short-term support zone. Over time, the MA20 support on the daily chart has moved up to around 4055, while the MA30 currently sits near 3942.
On the 1-hour chart, the downtrend appears not yet complete, so pay attention to the next two closing candles. For now, key support levels to watch are 4014–4000, followed by 3978–3937.
If the price stabilizes around 4000, a double-bottom pattern could potentially form. However, if it falls further toward the MA30, a head-and-shoulders pattern may come into play. In case the rebound fails to break above resistance, be cautious of a five-wave decline, as that could trigger another sharp correction, with a high likelihood of filling the gap near 3887.
In terms of trading strategy, the focus should still be on finding buying opportunities.
For medium-term setups, you can hold positions patiently; for short-term intraday trades, pay close attention to the key supports mentioned above, and use the MA20/60 on the 30-minute chart as reference points for resistance.

GOLD HIGH PROBABILITY SETUP SOON!!! 🚨 XAUUSD HIGH PROBABILITY BUY SETUP 🚨
* Here We Can See Clearly The Next Potential Moves For GOLD Coming Hours/Days.
* Keep Your Eyes Close On Your Trading Positions.
* Happy PIP Hunting Traders.
FXKILLA.

Gold:The main strategy is to go shortToday the gold rebounded to a high of around 4144.5 before coming under pressure and declining. It then fluctuated after touching a low of around 4070.
Regarding the current market trend, it is recommended to mainly trade based on technical trends: look for opportunities to go short when rebounds are under pressure. After all, the recent pullback and adjustment of the bullish trend have not yet come to a complete end.
As the U.S. government shutdown continues, some important economic data has entered a vacuum period, leading to widespread market speculation. Currently, a series of major news events—including China-U.S. trade relations, geopolitics, and the Federal Reserve's interest rate cuts—are all affecting market sentiment. After gold plummeted sharply at the start of the week and held the 4000 level, the bulls launched repeated counterattacks.
However, the sustainability of this bullish momentum appears weak for now: gold surged to around 4144 in the morning session but came under pressure again, and has now broken below the 4100 level, turning weak in the short term with further downside potential.
For resistance levels, pay attention to the short-term pressure around 4145-4150; for support levels, keep an eye on the short-term support around 4065-4070,At the same time, we must also be wary of Black Friday. If the support level is broken, gold is likely to continue falling to around 4000.
Since gold is under pressure and struggling to break through, the main trading strategy should be to go short when rebounds encounter pressure. Avoid trading in the middle range adopt a "wait and see" approach and refrain from chasing trades impulsively. Instead, wait patiently for key levels to enter positions.
💎Trading Strategy:
Buy 4060 - 4070
SL 4050
TP 4080 - 4100 - 4120
Sell 4100 - 4110
SL 4120
TP 4080 - 4070 - 4060
Daily-updated accurate signals are at your disposal. If you run into any problems while trading, these signals serve as a reliable reference—don’t hesitate to use them! I truly hope they bring you significant assistance

Today's gold trading strategy is hoped to be helpful to you.Previously, the gold price dropped from above $4200 to $4065, which has released the profit-taking pressure accumulated during the rapid rise. This is a healthy adjustment. Currently, it has rebounded to $4116, indicating that the buying support at $4065 is strong, and the bullish sentiment in the market has begun to recover. On one hand, the negative news such as the easing of the situation in the Middle East has been gradually digested; on the other hand, investors have started to prepare for the expectation of the Fed's interest rate cut and have begun to set up long positions in advance, pushing the gold price to gradually recover.
$4065 became a key short-term support level. After multiple tests, it did not break through, forming a stable bottom signal. Currently, the rebound at $4116 is above the support level. As long as it does not fall below $4065, the short-term rebound trend is expected to continue, and it is likely to launch an attack towards $4150 or even higher levels in the future.
Today's Gold Trading Strategy
xauusd @buy4070-4080
TP:4110-4130-4150
sl:4050

Weekly Technical Analysis of the XAU/USD (Gold vs. Dollar)Weekly Technical Analysis of the XAU/USD (Gold vs. Dollar)
Weekly Scenarios
Bullish scenario: Gold holds the ~$4,000 zone and breaks through ~$4,200 → next target in the range of ~$4,500–4,700.
Consolidation: Price moves between ~$4,000 and ~$4,200, forming a base for the next impulse.
Bearish scenario: Break below ~$4,000 with volume and a change in structure → possible decline to ~$3,900 or lower.
✅ Conclusion
For the coming week, the technical picture for XAU/USD remains moderately bullish, but with a high degree of risk:
Holding support at ~$4,000 and breaking resistance at ~$4,200 could trigger a significant rally.
A break below ~$4,000 is a signal for caution and a potential correction. It's important for traders to react to volumes, breakout confirmations, and price behavior at designated levels.

Gold:Perfectly confirms the prediction🎉Today's gold trend is in perfect alignment with the key levels we preset, and the upper resistance range has exerted a significant suppressing effect.
✔We clearly indicated in the morning that "attention should be paid to the upper resistance around 4,135–4,150". In the actual market movement, spot London gold hit a daily high of 4,154.52, which just tested the upper edge of this resistance range before fluctuating under pressure. It finally traded around 4,130 and never broke through the 4,150 resistance ceiling throughout the day.
✔Meanwhile, although it dipped to an intraday low of 4,065.47, this level fell entirely within our preset support range of 4,060–4,070. The price then rebounded quickly, which confirms the supporting effect around this zone. The overall trading rhythm is completely consistent with the core logic of our prediction.

Gold May Form a Bull Trap Before Another DropUnder the current strong bearish sentiment, gold has filled the gap around 4019 and touched the MA20 support on the 1D chart, followed by a strong rebound of over $150. After reaching the MA10 near 4160, the price pulled back again and is now trading below 4100.
On the 4H chart, the downtrend remains intact, with psychological support around the MA30 (near 3910). If bearish momentum continues during the U.S. session, a move toward this support level cannot be ruled out.
Personally, I expect gold to first test resistance around 4180–4200 or even 4250, forming a potential bull trap before another leg down. However, if supported by positive news and strong volume, the market could reverse and push prices back above 4300.
Moreover, if the price truly dips into the 3950–3910 range, I see it as a great opportunity for long positions — one I definitely won’t miss!
Of course, this is just my personal view. Ultimately, we should always follow the actual price action and trade cautiously, managing risk wisely.

Gold Rebounds from Extreme POI – Bullish Move Building UpGold?Analysis:
Gold (XAU/USD) has shown a strong recovery after tapping into the Extreme Point of Interest (POI) zone, signaling the potential start of a bullish reversal.
The chart indicates an SMC Trap (Smart Money Concept Trap), where liquidity was swept below previous lows to trigger sell stops before reversing upward — a classic smart money accumulation pattern.
Price reacted sharply from the Extreme POI, forming higher lows, which confirms renewed buyer interest.
The immediate target area lies around $4,180 – $4,200, aligning with the projected bullish arrow.
Below, the High Probability POI remains as a deeper demand zone — a strong confluence area if price retests.
📊 Conclusion:
Gold is showing signs of bullish structure recovery after liquidity sweep. Holding above the Extreme POI zone strengthens the case for continued upside movement toward $4,200 and possibly higher.

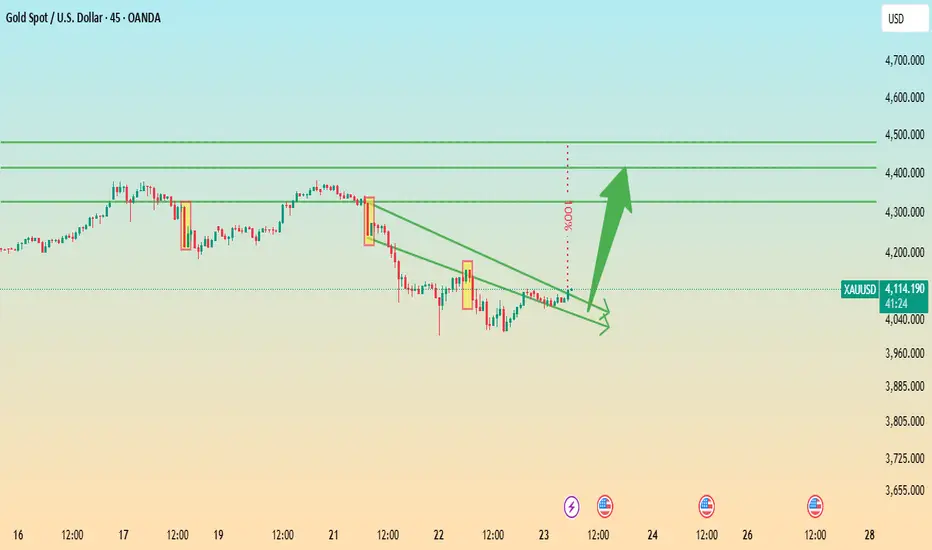
Gold Breakout Potential: Descending Wedge Signals Bullish ReversAnalysis:
The XAU/USD (Gold vs. USD) chart on the 45-minute timeframe shows price action forming a descending wedge pattern, a typically bullish reversal formation. The price has been compressing between lower highs and lower lows but is now testing the upper trendline resistance, indicating a possible breakout.
Key observations:
Trendline Breakout Zone: The narrowing wedge suggests weakening bearish momentum. A confirmed breakout above the trendline could trigger strong upward momentum.
Targets: The projected upside targets are around 4,300, 4,400, and 4,500, aligning with previous resistance zones.
Support Zone: Immediate support remains near 4,050–4,000, where the lower wedge boundary provides buying interest.
Momentum Indicator: Gradual bullish recovery and decreasing downside pressure indicate renewed buyer strength.
Today's trading strategy for gold is hoped to be helpful to you.Gold Short Trading Strategy Analysis (Current Gold Price: $4,080 per Ounce)
Based on the current market dynamics, gold is in a correction phase following a previous sharp rally. The $4,080 level still has short-term downside potential, presenting an opportunity to go short and capitalize on the short-term adjustment. However, strict risk control is essential. The specific strategy is as follows:
Core Logic for Short Selling
1.Strong Short-Term Correction Demand: Gold has surged from lower levels to a record high above $4,300. The excessively rapid uptrend has led to an "overbought" market, similar to a tightly stretched spring that needs to rebound. It has fallen for three consecutive days recently, with a cumulative drop of nearly 6% in two days, marking the largest single-day decline since April 2013. This correction is a natural "cooling-off" process for the market, and short-term selling pressure has not been fully released yet.
2.Bullish Factors on Hold, Bearish Factors Gaining Momentum: There have been signs of easing in the geopolitical tensions that previously drove up gold prices, as many European countries have expressed support for ceasefire and peace talks, leading to a rapid decline in safe-haven demand. Meanwhile, investors and institutions that profited from the earlier rally are taking the opportunity to sell and lock in profits, further amplifying the downward momentum of gold prices. Although long-term supporting factors remain intact, short-term market sentiment has shifted to cautious.
3.Technical Indicators Signaling a Downtrend: From the price movement perspective, gold has broken below key levels such as $4,100 and $4,200, and the current rebound momentum is very weak. The short-term resistance above is quite prominent; unless the price can rise above $4,160, the correction trend will be hard to reverse, and it is highly likely to continue falling further in the near future.
Today's Gold Trading Strategy
xauusd @sell :4110-4120
pt:4080-4060
sl:4140

Gold: Maintain Bullish Strategy, Target 4180–4220 ZoneYesterday, the market overall remained in a bottom-building phase. There were several intraday rebounds, but each time the price eventually returned near the lows. Compared to recent sessions, the volatility wasn’t extreme, though still relatively large when measured against previous market conditions.
At the moment, the price is approaching the MA20 resistance on the 2-hour chart, with both the structure and indicators leaning bullish. On the 30-minute chart, minor support lies near 4070, with secondary support around 4043, while strong resistance remains in the 4180–4200 and 4250 zones.
The trading strategy remains unchanged — continue to buy in batches near the lows and stay patient while waiting for the price to recover.

Gold: Focus on the 4000 markAfter gold prices recorded a sharp decline on Tuesday, they continued their correction on Wednesday. However, the downward momentum weakened significantly when approaching the 4,000 mark, with no effective break below this level.
The price tested this mark multiple times during the day but stabilized and rebounded each time, indicating that the 4,000 mark has initially formed short-term support. Based on this, today’s focus should be on whether the 4,000 mark can hold: if it remains intact, short-term price action is expected to be a wide-ranging oscillation at higher levels for a correction; if broken, it may open up further downside space.
On Wednesday, gold prices repeatedly tested the 4,010-4,000 range, and candlesticks with long lower wicks were formed each time. This candlestick pattern directly confirms the strong support nature of this range. Today trading should take this range as the core reference: on the premise that the 4,000 mark is not broken and the 4,010-4,000 support range remains intact, it is not advisable to blindly chase short positions at low levels, and short-term rebound risks should be guarded against.
💎Trading Strategy:
@Buy 4010 - 4015
SL 4000
TP 4030 - 4020 - 4070
@Sell 4120 - 4125
SL 4130
TP 4100 - 4080 - 4060
Daily-updated accurate signals are at your disposal. If you run into any problems while trading, these signals serve as a reliable reference—don’t hesitate to use them! I truly hope they bring you significant assistance

Gold Price Outlook – Trade Setup (XAU/USD)📊 Technical Structure
OANDA:XAUUSD Gold extended losses, trading near $4,060–$4,070 after its biggest one-day drop in five years.
Immediate support zone is around $4,060–$4,070, while the resistance zone lies at $4,132–$4,141.
The current chart suggests a potential rebound scenario from support, with upside capped at resistance.
Failure to hold $4,060 could expose the next leg lower toward $4,020–$4,000.
📌 Trade Setup
Entry (Long): $4,070 (near support zone)
Stop Loss: $4,053 (below support)
Take Profit: $4,132 (resistance zone retest)
Risk-to-Reward (R:R): ≈ 1 : 4.26
🌍 Macro Background
Gold remains under heavy pressure after two days of sharp selloff, even as the US Dollar Index (DXY) weakened slightly near 98.80. The move reflects profit-taking following gold’s record rally, while traders are cautious ahead of Friday’s US CPI data (Core CPI expected at 3.1% YoY).
At the same time, Reuters reported that the White House is weighing new export curbs on China’s tech sector, intensifying trade uncertainty. Despite near-term weakness, gold is still up 54% YTD, supported by market bets that the Fed will cut rates by 50 bps at its final two policy meetings this year, with additional easing priced in for 2026.
Thus, while short-term volatility may persist, macro drivers still favor dip-buying strategies.
🔑 Key Technical Levels
Resistance: $4,132 / $4,141
Support: $4,060 / $4,070
Upside Target: $4,132
Downside Risk: $4,020 / $4,000
📋 Trade Summary
Gold is consolidating near $4,060–$4,070 support, with technicals hinting at a short-term rebound opportunity toward $4,132 resistance. However, the broader tone remains cautious ahead of the US CPI release and potential new US-China tech trade restrictions.
⚠️ Disclaimer
This analysis is for reference only and does not constitute trading advice. Trading involves significant risk, and proper risk management is essential.

GOLD Rising Support!
HI,Traders !
#GOLD is trading along
The rising support and is already
making a Local rebound so we are
Locally bullish biased and
We will be expecting a
Further bullish move up !
Comment and subscribe to help us grow !

GoldXAUUSD
- Change of Characteristics
- Strong Bullish Trend Line
- Completed " 12345 " Impulsive Waves and " ABC " Corrective Waves
- Order Block
- RSI - Divergence

gold on short reverse#XAUUSD price have been trading between price correction and continuation, now we await for 2 times breakout above 4034 to sell.
2 times breakout at 4034 sell, target 3998, stop loss 4050.
Below the 3998 holds bullish reverse which will target 4070.

Gold: The M-top pattern indicates a downward risk📈Gold’s situation today is quite complex, marked by sharp volatility. Looking at the price trend, after a rare steep drop the previous night, the Gold continued to slide following today’s opening, touching a low of 4004.5. It then staged a short-term rebound of over $100, fluctuating around 4100 and peaking at 4161.It then continued to decline.
📝In terms of influencing factors:
The cooling of safe-haven sentiment is one of the key reasons for Gold’s decline. Europe’s support for Russia-Ukraine ceasefire negotiations, the expected resolution of the U.S. government shutdown crisis, and the easing of Sino-U.S. trade tensions have all led to a significant drop in market demand for safe-haven assets.
📈Gold had risen too sharply in the earlier stage, fueling strong sentiment among investors to take profits at high levels. A large number of sell orders pushed its price down sharply.
Additionally, the strengthening of the U.S. dollar during the day has also exerted certain pressure on gold prices.
📝From a technical perspective:
The Gold closed with a long bearish candlestick on the daily chart, accompanied by a simple M-top formation. This indicates the risk of the market continuing to move downward. The upper resistance zone is between 4150 and 4180, the key lower support level is at the 4000 integer mark, and further downside support lies between 3900 and 3904.
💎Trading Strategy:
Buy 4075 - 4085
SL 4060
TP 4115 - 4125 - 4135
Sell 4150 - 4160
SL 4175
TP 4085 - 4100 - 4115
Daily-updated accurate signals are at your disposal. If you run into any problems while trading, these signals serve as a reliable reference—don’t hesitate to use them! I truly hope they bring you significant assistance

Today's trading strategy for gold is hoped to be helpful to you.Core Bullish Logic for Gold: Why It Deserves Long-Term Attention
1.Support from Policy and Monetary Environment: The market generally expects the Federal Reserve to continue cutting interest rates in the future. This will reduce the cost of holding gold, and at the same time, the attractiveness of the U.S. dollar is declining—both of which are favorable for gold. In addition, the U.S. government "shutdown" is still ongoing, and key economic data cannot be released on time. People are more uncertain about the economic trend, so they will be more willing to buy gold as a safe - haven asset.
1.Long-Term Demand Is Secured: Central banks around the world are continuing to buy gold. The People's Bank of China has increased its gold holdings for 11 consecutive months. Such large - scale long - term purchases can provide a floor for gold prices. Meanwhile, ordinary investors are also increasing their positions through methods such as ETFs. The inflow volume of global gold ETFs in September is almost close to the level during the Russia - Ukraine conflict, which shows that the market has a high recognition of gold.
Today's Gold Trading Strategy
xauusd @ buy:4120-4130
pt:4150-4160
sl:4100

technical analysis for XAU/USD (Gold) based on your chart:Pair: Gold (XAU/USD)
Chart Summary
Current Price: Around $4,140
Trend Lines: A descending trade line shows the overall short-term bearish trend.
Support Zone: Clearly marked between $4,080 – $4,120 (“SUPPORT BUY ZONE”).
Target: The upside target is labeled near $4,383.
Technical Outlook
🔹 Support Zone Reaction
Price recently dipped into the support buy zone, forming a potential bullish reversal wick.
This area is acting as a strong demand zone, attracting buyers around $4,100.
🔹 Downtrend Channel
The pair remains under a downward-sloping trade line, suggesting the short-term market bias is still bearish.
However, a breakout above this trendline could trigger bullish continuation toward the $4,383 target.
🔹 Short-Term Scenario
Bullish Case (Primary Plan):
If gold holds above the support zone ($4,080–$4,120) and breaks the trendline resistance (~$4,200),
→ next target area: $4,300–$4,383.
Confirmation comes with a clear candle close above $4,200.
Bearish Case (Alternative Plan):
If price fails to break the descending trade line and drops below $4,080,
→ possible continuation toward $4,040 – $4,000.
Key Levels
Type Level (USD) Description
🎯 Target 4,383 Major resistance / profit zone
⚔️ Resistance 4,200 Descending trendline zone
🛒 Support Zone 4,080–4,120 Demand / Buy zone
❌ Invalid Below 4,080 Break below = bearish continuation
Summary
📈 Gold (XAU/USD) is currently retesting its support zone, showing early signs of a bullish rebound.
A confirmed breakout above the trendline could lead to a rally toward $4,380.
However, losing support below $4,080 would invalidate the bullish setup and reintroduce downside risk. EURONEXT:IE6X2025 EURONEXT:BE8Z2025 EURONEXT:BXF1! EURONEXT:CU6X2025 EURONEXT:KB6X2025 EURONEXT:PJ6X2025 EURONEXT:PJ8Z2025 EURONEXT:UM6X2025 EURONEXT:UM8Z2025 EURONEXT:AB6X2025 EURONEXT:AB7X2025
