Gold Buy Long PostionA Gold (XAU/USD) Buy Long Position involves purchasing the XAU/USD pair with the expectation that the price of Gold (XAU) will rise relative to the US Dollar (USD) over time.1 This is a common strategy for position traders and swing traders.Gold Buy Long Position (XAU/USD) Short NoteCurrent XAU/USD Price ContextApproximate XAU/USD Price: The Gold price is highly dynamic, but recent market data shows it trading around the $4,150 - $4,250 per ounce range (as of the recent search results from October 2025). This price point is near historical highs, indicating a strong long-term bullish trend that is currently undergoing some short-term correction/consolidation.Strategy Summary for Long EntryFundamental Driver (Why Buy): Gold is typically bought as a safe-haven asset during times of economic or geopolitical uncertainty (e.g., wars, high inflation, recession fears).2 A sustained weakening of the US Dollar (USD) or a dovish outlook from the US Federal Reserve (Fed) (e.g., expected interest rate cuts) is also a strong bullish signal for XAU/USD.Technical Trigger (When to Buy):Support/Retracement: Look for the price to pull back to a key historical Support level or a major Fibonacci Retracement level (like 3$50\%$ or 4$61.8\%$) within an existing uptrend.5Confirmation: Enter the trade when a strong bullish candle (e.g., a Pin Bar or Bullish Engulfing) forms at that key support level, confirming buyer defense.Trend Following: Wait for a breakout above a recent minor resistance level (or consolidation range) to confirm the continuation of the main uptrend.6Risk Management:Stop-Loss (SL): Place the Stop-Loss below the confirmation support level or the most recent swing low to protect against an invalidation of the bullish structure.7Take-Profit (TP): Target the most recent swing high or use Fibonacci Extension levels to project higher targets.
Xauusdbuy

Gold Price Outlook – Trade Setup (XAU/USD)📊 Technical Structure
Gold tumbled below $4,100, finding temporary support around $4,085–$4,093.
The chart shows a descending trendline, keeping short-term momentum bearish.
Immediate resistance lies at $4,142–$4,151, while the support zone is at $4,085–$4,093.
A break above the trendline could trigger a rebound toward resistance, but failure may open the door to deeper losses.
📌 Trade Setup
Entry: $4,093
Stop Loss: $4,080 (below support zone)
Take Profit: $4,150 (resistance retest)
Risk-to-Reward (R:R): ≈ 1 : 4.45
🌍 Macro Background
Gold is pressured by easing US-China trade tensions as both sides prepare for potential tariff negotiations ahead of November 1. This weakens safe-haven flows. At the same time, the steep profit-taking after a nine-week rally adds to selling pressure.
However, risks from the prolonged US government shutdown, concerns over global debt sustainability, and expectations of further Fed rate cuts (October and December) continue to support the medium-term bullish case for gold.
Markets now await US CPI data on Friday (YoY expected at 3.1%), which will be a crucial trigger for USD and gold direction.
🔑 Key Technical Levels
Resistance: $4,142 / $4,151
Support: $4,093 / $4,085
Upside Target (breakout): $4,150–$4,160
Downside Target (failure): $4,070 / $4,050
📋 Trade Summary
Gold faces strong downside momentum but holds above the $4,085 support zone. Short-term strategy favours a rebound trade on a breakout above the descending trendline, targeting $4,150. However, if support fails, the decline could accelerate toward $4,070–$4,050.
⚠️ Disclaimer
This analysis is for reference only and does not constitute trading advice. Trading involves significant risk, and proper risk management is essential.

Today's trading strategy for gold is hoped to be helpful to you.The core logic: The key reasons behind the price changes
1.Long - term support remains: This year, the price of gold has risen from $3000 all the way to an all - time high of over $4380. Several major factors are at play. On the one hand, the Federal Reserve began to cut interest rates in September and may continue to do so in the future. The cost of holding gold has become lower, making everyone more willing to buy. On the other hand, the continuous government shutdown in the United States, coupled with the unresolved tense situations in the Middle East, Eurasia and other places, has made the market's concerns about the economy more prominent, thus highlighting the safe - haven value of gold. Another important support is that central banks around the world have been buying gold. Many countries, such as China and Poland, have been increasing their holdings. These long - term purchases can underpin the price of gold and reduce the possibility of a sharp decline.
2.Reasons for short - term fluctuations: Recently, the price of gold has dropped from around $4380 to $4090. Mainly, it is because the previous increase was too fast, and some investors sold to take profits, bringing selling pressure. In addition, there is news that the U.S. government shutdown may end this week, which has temporarily reduced part of the safe - haven demand and also led to a price decline. However, from the perspective of the trend, this correction is more like a short - term rest rather than a trend reversal.
Today's Gold Trading Strategy
xauusd@buy:4080-4100
pt:4130-4150
sl:4030

Gold Market Nearing a Bottom — Trade with CautionAfter yesterday’s sharp decline, the market is likely entering a gradual bottoming phase. As I mentioned on Saturday, there are still unfilled gaps at 4019–4024 and 3887–3898. If the bears remain dominant, the 4019 gap could be filled, though a move toward 3887 seems less likely unless major negative news triggers it.
During any rebound, pay close attention to the 4200–4250 resistance area. If prices fail to stabilize there, the weekly chart pattern will weaken, increasing the risk of a drop toward the 3887 gap. Overall, trade with caution in the near term — the market is being influenced by multiple factors, leading to heightened volatility and risk. Being cautious never hurts.
While making profits is important, protecting your account comes first — otherwise, gains mean little. If you prefer fewer, safer trades, focus on the key price zones mentioned above and observe the market more than you act. For those continuing with short-term or scalping strategies, be sure to control your target prices strictly, especially now as the broader trend direction is still being established.
Of course, everyone has his or her own trading methods and theories. I will not comment too much here, but just share my own views. If you think it is useful, use it. If it is not useful, just watch the fun.
Gold Plunges — Buying Opportunity EmergesThe strength of the bears eventually caused the price to fall below 4100. After touching 4080, the volatility decreased. I believe that at this point, everyone should know how to trade next. That's right, it is to go long, but pay attention to position control to avoid directly overweighting. It is safer to buy in batches, because the bottom cannot be formed all at once. The probability of this is relatively small. During the rebound, pay attention to the resistance in the area around 4180-4200/4250. If there is a strong and rapid rebound, the price will most likely have some retracement. Therefore, if you are doing short-term trading, you should pay attention to controlling the target. Mid-line trading may also be a roller coaster, but the overall direction should be correct. However, you should also pay attention to the risks. That's all for today.

Gold (XAU/USD) Potential Bullish Reversal Setup – Entry Zone For**Analysis:**
The chart illustrates a possible bullish reversal scenario after a recent downward move in Gold (XAU/USD). The marked *Change of Character (ChoCH)* indicates an early sign of a trend shift from bearish to bullish momentum.
Price has entered a **consolidation zone** near the support area, where the **entry level** is highlighted. This zone suggests accumulation and potential preparation for an upward move.
The setup shows:
* **ENTRY:** Around current support, within the highlighted range.
* **STOP:** Below the recent low, providing risk control if the reversal fails.
* **TARGET:** The projection points to a **100% measured move**, aligning with a strong bullish continuation potential toward 4,700 levels.
If price maintains structure and confirms a breakout above the short-term resistance, it may initiate a new **bullish impulse phase**.

Correct projection for GoldThe core conclusions of today's analysis on gold have all been verified by market trends, which can be summarized in three aspects: trend prediction, key level control, and trend logic:
1-Trend prediction verification: It was clearly stated this morning that "if it breaks below the key support level of 4280, it will enter a consolidation phase and may further drop to 4150". The current gold price is completely in line with this downward range, and the prediction is highly consistent with the actual trend.
2-Key level control: The previously emphasized resistance level at 4380 and support level at 4280 have both become the core boundaries of intraday price fluctuations.
3-We accurately captured "the restrictive effect of support and resistance levels on prices", and there were no deviations in the judgments on "short-term fluctuation rhythm and long-term trend direction", effectively providing clear range and direction references for trading operations.

Gold Forms Double Top — Bears May Target 4150Gold ultimately formed a double top, and the decline followed a similar pattern to last Friday. Similarly, it failed to hold above 4352 amidst volatility, falling to around 4317 before rebounding. However, the rebound also failed to effectively convert resistance near 41 into support, leading to a rapid decline! The price has once again returned to support near the MA30 on the 4H chart.
A rapid decline is often accompanied by a rebound, but if the rebound fails to break through resistance, it can only serve as a buffer during the downtrend. If the pattern arrangement and indicators also favor a bearish trend, the subsequent decline is likely to be even more drastic (absent breaking news).
Now the price has rebounded to the resistance zone, and the strong resistance is still around 4300. If the rebound cannot gradually recover, then we must pay attention to the trend support. If it falls below, a similar trend as marked in the figure is likely to appear, and the short position may point to around 4150 or even lower.

Gold: Resistance at 4380 is significant📈Today, during the Asian session, the Gold continued its bullish trend, with the price once surging to 4375, but failed to hold steady afterward and pulled back.
📝From a technical perspective, the overall upward structure of London Gold on the daily chart remains intact, and the short-term technical pattern still shows a relatively strong momentum. However, there is certain resistance around the 4380 level, as the price failed to break through it in the previous two attempts,If the resistance at 4380 is broken, it will open the channel for further upward movement, we will focus on the resistance zone around 4400–4440; if this support 4280 fails to hold, gold prices may fall further to 4150 or even lower.
📝Looking at the 4-hour chart, the immediate focus above is on the short-term resistance zone of 4380-4383, while the support zone below is 4280-4290. If the bulls fail to achieve a sustained breakthrough, the market is likely to enter a consolidation phase later. In terms of operation, it is advisable to trade within this range. Refrain from excessive actions or chasing trades at mid-range levels; instead, wait patiently for key levels to enter positions.
💎Trading Strategy:
Buy 4290 - 4300
TP 4320 - 4330 - 4340
SL 4280
Daily-updated accurate signals are at your disposal. If you run into any problems while trading, these signals serve as a reliable reference—don’t hesitate to use them! I truly hope they bring you significant assistance

Bullish Scenario (Primary Setup): Entry (Buy Zone): 4,180 – 4,2Technical Overview:
Gold is currently in a retracement phase, testing a strong BUY ZONE between 4,180 – 4,200.
This zone has previously acted as a major support area, where buyers stepped in.
The chart shows a possible bullish reversal pattern forming near this zone, suggesting a potential rebound.
🟩 Bullish Scenario (Primary Setup):
Entry (Buy Zone): 4,180 – 4,200
Target: 4,384
Stop-Loss: Below 4,160
Rationale:
The buy zone aligns with previous price reactions, confirming strong demand.
Wick rejections around 4,190 indicate buyer interest.
Price action suggests a possible V-shaped recovery or higher-low formation before continuation upward.
🟥 Bearish Scenario (Alternative):
If price closes below 4,160, the support zone will be invalidated.
In that case, exp TFEX:KKP1! TFEX:DELTA1! TFEX:JPY1! TFEX:EURUSD1! TFEX:GD1! TFEX:GF1! TFEX:USDJPY1! TFEX:GF101! TFEX:SVF1! TFEX:GO1! ect further downside toward 4,120 – 4,100.
⚙️ Summary Table:
Parameter Value
Trend Bias (Short-Term) Neutral to Bullish
Key Support (Buy Zone) 4,180 – 4,200
Target 4,384
Stop-Loss Below 4,160
Risk–Reward Ratio ≈ 1:3
📊 Conclusion:
Gold (XAU/USD) is approaching a critical support zone. As long as the price holds above 4,160, a bullish rebound toward 4,384 remains likely. However, a confirmed break below this level could trigger a deeper correction. TFEX:KEX1! TFEX:ICT1!

XAUUSD- 1H bullish setup🟢 Bullish Confluences:
Strong Rejection from Key Demand Zone
Price has sharply bounced from the lower green Keltner Channel band, indicating strong buyer interest around $4,245–$4,257.
This area aligns with the 61.8% Fibonacci retracement level from the recent leg (4233.35 to 4297.76), a classic golden ratio zone for reversals.
Bullish Candlestick Reaction
A long lower wick shows clear rejection of lower prices and potential reversal strength.
Suggests that bulls are stepping in after a steep decline.
Keltner Channel Support Bounce
The price is reacting well from the lower Keltner band and may now aim toward the mid to upper bands as dynamic resistance, which aligns with key Fibonacci levels.
Fibonacci Retracement Overlay
The recent drop seems to be a corrective pullback, and the overlay of the Fibonacci retracement levels gives us clear potential targets on a bullish reversal.
🎯 Fibonacci Targets (Upside Levels):
Based on the move from the low around 4233.35 to the recent swing high around 4297.76, the bullish targets are:
Target 1 – 38.2% Level
📍 4322.36 First resistance and profit-taking zone.
Also aligns with mid-Keltner resistance.
Target 2 – 61.8% Level
📍 4337.57 Strong Fibonacci level where deeper pullbacks usually end.
May act as a major resistance zone if price continues upward.
Target 3 – 100% Extension / Full Move Recovery
📍 4362.17 Full recovery of the prior high.
If momentum remains strong, price may test this zone.

GOLD HIGH PROBABILITY SETUP SOON!!!🚨 XAUUSD HIGH PROBABILITY BUY SETUP 🚨
* Here We Can See Clearly The Next Potential Moves For GOLD Coming Hours.
* Keep Your Eyes Close On Your Trading Positions.
* Happy PIP Hunting Traders.
FXKILLA.

GOLD: BUY $4235, TARGET $4450! (FED RATE CUT PLAY)📰 MACRO & NEWS: Low-Interest Rate Tailwinds
Gold prices are strongly supported by fundamental factors:
Fed Rate Cuts: The market is pricing in a 99% probability of a Fed rate cut next week. Low rates = An ideal environment for Gold.
Safe-Haven Demand: Political uncertainty (extended US Government shutdown) and lingering trade tensions boost safe-haven appeal.
Key Data: Delayed CPI data, expected on October 24th, will serve as a major market catalyst.
Summary: The fundamental momentum for an upside move is dominant and ready for a breakout.
📈 TECHNICAL ANALYSIS: The Perfect LONG Setup!
The chart shows Gold is correcting towards a powerful Demand Zone, where the Uptrend Line converges with a critical structural low.
🎯 Detailed Trading Strategy
We are looking to initiate a buy position as the price hits this demand zone:
Position: LONG (BUY) - Following the primary bullish trend
BUY ZONE (Entry):
$4,237
$4,235 (Key Demand Zone)
SL (Stop Loss):
$4,227 (Protecting the bullish structure's low)
TP (Take Profit Targets):
TP1: $4,245
TP2: $4,255
TP3: $4,265
TP4: $4,275
Final TP: Open (Expecting a New ATH around $4,450+)
REMINDER: This buy opportunity in the demand zone is strongly backed by macro factors (Fed & Instability). Always manage your risk!
#GOLD #XAUUSD #Fed #ATH #TechnicalAnalysis #TradeSetup

Correct projection for GoldAfter breaking through 4280, gold has continued to rise and shows no signs of peaking so far. This fully aligns with our prediction that a breakthrough above 4280 would form bottom support and further test 4362. If it breaks through the previous high of 4379, it will open the channel for further upward movement.

XAU/USD – Bullish Reversal Setup from Buy Zone within DescendingLME:CA1! LME:NI1! LME:MC1! LME:SN1! LME:LH1! LME:SC1! LME:CO1! LME:ZS1! LME:HC1! LME:MA1! LME:MZ1! LME:EA1! Market Structure Overview
The price is currently moving inside a descending channel (marked as TRADE LINE).
A Buy Zone is identified between $4,315 – $4,325, which acts as a strong support area.
Price has touched the lower channel line and rebounded upward, indicating buyer interest around that zone.
📉 Short-Term Trend
The short-term trend is bearish due to lower highs and lower lows inside the channel.
However, momentum shows weakening selling pressure near the buy zone.
🟢 Bullish Scenario
If price holds above the Buy Zone and forms bullish candles, expect a potential reversal toward the upper channel line.
A breakout above the upper channel would signal a trend shift, targeting:
Target: $4,381 – $4,385 (as marked on your chart).
🔴 Bearish Scenario
If price breaks below $4,315, it would invalidate the buy zone setup.
Next potential support could be around $4,300 or lower.
📊 Trade Plan Example
Entry: Near $4,320 – $4,325 (Buy Zone)
Stop-Loss: Below $4,310
Take-Profit: $4,380 – $4,385
Risk-to-Reward: Approximately 1:4
⚙️ Summary
Gold is currently consolidating within a descending channel.
A bullish breakout from this structure could open the path toward the $4,381 target zone, confirming short-term bullish reversal momentum.

Today's gold trading strategy, I hope it will be helpful to youMonetary Policy Easing Expectations: From "Probabilistic Consensus" to "Imminent Implementation"
The strongest driver for going long on gold currently lies in the high certainty of a policy shift by the Federal Reserve. According to the latest CME FedWatch data, the probability of a 25-basis-point interest rate cut in October has reached 99.4%, while the probability of keeping rates unchanged stands at a mere 0.6%. Furthermore, the probability of a cumulative 50-basis-point cut by December has soared to 98.6%.
This expectation is not a result of excessive market optimism but is backed by solid data: the core Personal Consumption Expenditures (PCE) Price Index has continued to decline, providing the "inflation under control" premise for monetary policy easing. Meanwhile, the slowing growth of the U.S. labor market and the weakening manufacturing PMI have reinforced the necessity of "preventive rate cuts."
Monetary policy easing directly acts on the core of gold pricing—real interest rates. The real yield on 10-year U.S. Treasuries has stabilized in a low range below 1.8%. Historical data shows that when real interest rates enter a downward trajectory, gold typically follows a pattern of "rising by 15%-20% for every 0.5 percentage point decline in real interest rates." The clarity of the current interest rate path provides the most crucial macroeconomic safety cushion for the long-gold strategy.
Today's Gold Trading Strategy
xauusd@buy4350~4355
pt:4375~4380
sl:4330

Gold Price Outlook – Trade Setup (XAU/USD)📊 Technical Structure
Gold has once again tested the $4,380 resistance zone, where repeated rejections highlight a strong supply barrier. Price is now consolidating toward the $4,293–$4,301 support zone, which coincides with a rising trendline. If buyers defend this level, the bullish structure remains valid with potential to revisit $4,377–$4,384. A deeper pullback below $4,285 would weaken the bullish outlook and expose $4,260–$4,270.
🎯 Trade Setup
Entry: 4,293–4,301 (support retest)
Stop Loss: 4,288
Take Profit: 4,377 / 4,384
R:R: ≈ 1 : 6.18
🌍 Macro Background
Gold’s rally has stalled near $4,380 as markets shift focus to US-China trade talks. While safe-haven demand remains strong, optimism around potential negotiations has allowed the US Dollar to recover modestly. Meanwhile, the prolonged US government shutdown and Trump’s threat of a 155% tariff on China from November 1 add fresh uncertainty, supporting the case for safe-haven flows. Additionally, markets are pricing in two more Fed rate cuts this year, keeping gold well-bid on dips. Investors will closely monitor US CPI data on Friday and earnings from major US companies for directional cues.
🗝️ Key Technical Levels
Resistance: 4,377 / 4,384 / 4,390
Support: 4,301 / 4,293 / 4,260
📌 Trade Summary
Gold remains in a buy-on-dips mode as long as $4,301 support holds. Short-term pullbacks offer potential entry opportunities toward $4,380 resistance, but repeated rejections at this zone highlight the importance of risk management.
⚠️ Disclaimer
This analysis is for reference only and does not constitute trading advice. Trading involves significant risk, and proper risk management is essential.

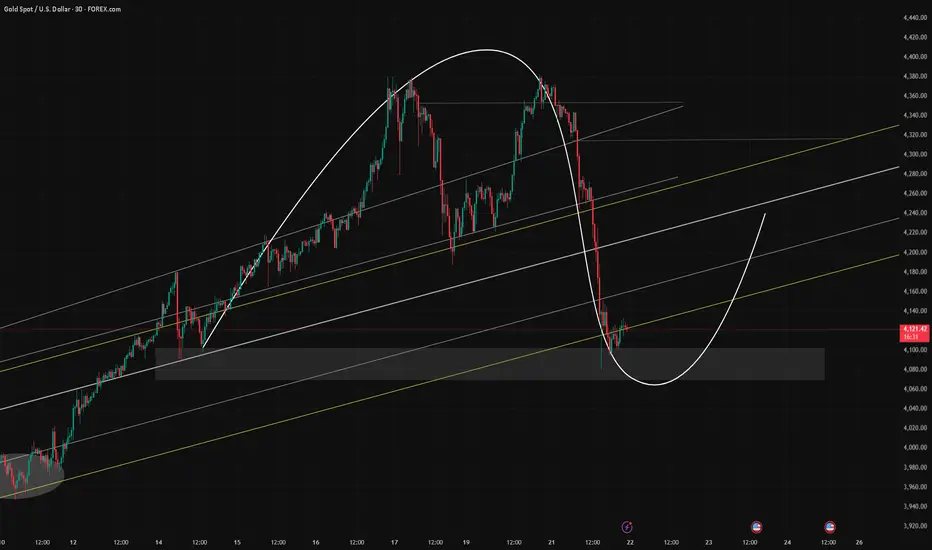
Gold Enters High Zone — Wait for Breakout and Follow the TrendThis is the 4-hour gold chart, and the primary focus right now is whether a double-top pattern is about to form.
From a trend perspective, the recent pullback to around 4180 has already completed a trend confirmation. Normally, another rally from here would be expected to break above the previous high. However, the challenge lies in the fact that this previous high is also a historical peak, which brings significant uncertainty — will it turn into a double top, or will it confirm support and trigger a stronger new uptrend?
At this stage, it’s difficult to make a definitive judgment, so I prefer to remain cautious with my trading decisions.

Buy Near Secondary Support, Beware of Double Top FormationThe price has entered the historical high area above 60 based on short-term support, and the 2H pattern is still bullish, but we must pay attention to selling pressure.
Take the secondary support (yellow line in the figure) as the main reference and go long on pullback.

XAU/USD Bullish Reversal from Buy Zone – Targeting $4,392t: Gold Spot / USD (XAU/USD)
Timeframe: 30-minute
Current Price: $4,253.975
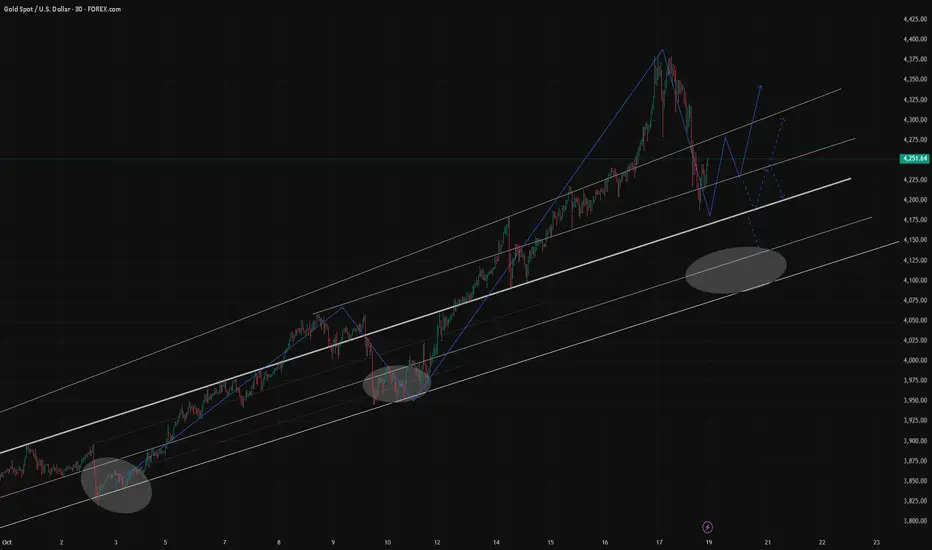
Trend: Recently broke below an ascending channel but bounced from a support zone.
🔍 Key Features on the Chart:
Ascending Channel (Yellow lines)
Price was previously moving inside a well-defined ascending channel.
It broke below the channel, suggesting a possible trend shift or correction.
Buy Zone (Purple Box ~ $4,200 - $4,220)
A demand zone where buyers stepped in.
Price bounced strongly from this zone, indicating support is respected.
Projected Price Path (Blue Zigzag Arrow)
Indicates a possible bullish wave structure (higher highs and higher lows).
Suggests a continuation of the uptrend after the correction.
Target Level: $4,392.539 (Blue Line)
A projected resistance or take-profit zone.
Price is expected to reach this level based on the bullish scenario.
🧠 Interpretation:
Bullish Bias: The chart suggests that the correction might be over after finding support in the "Buy Zone".
Entry Zone: Around $4,200–$4,220 appears to be a strong buy area.
Target: $4,392.539 (approx. +140 points from current level).
Risk Consideration: If price drops below the buy zone significantly, the bullish bias may be invalidated.
✅ Summary of Strategy:
Potential Buy: From current levels or on pullback toward the $4,220–$4,200 zone.
Stop-Loss: Below the buy zone (e.g., under $4,180 or based on your risk tolerance).
Target: Around $4,392.
If you'd like, I can help you:
Calculate potential risk/reward.
Convert this into a trading plan.
Monitor updates (with live data).

Gold has now broken through the resistance level at 4280As our mentioned before, Gold has now broken through the resistance level at 4280 and continues to rise,It may form a short-term bottom structure and further test the 4362 level. A break above the previous high of 4379 would open the door to further upside.
Buy 4280 - 4285
TP 4300 - 4310 - 4320
SL 4270
Daily-updated accurate signals are at your disposal. If you run into any problems while trading, these signals serve as a reliable reference—don’t hesitate to use them! I truly hope they bring you significant assistance

The 4400 era is coming, and the 4500 era is just beginning.Judging from the current trend, the middle track of the hourly line and the 4H line are already around 4280. As time goes by, the lower low point is constantly rising. We can appropriately increase the expected retracement target and participate in long trading when it retraces to around 4390-4380. But at the same time, we also need to pay attention to the short-term support formed by 4330-4320. If it falls back to this level in the evening and shows a clear stop in the decline, we can also consider entering the market in advance and going long on gold in this range. The upper pressure continues to focus on 4365-4380. If gold rebounds first, you can also consider shorting gold appropriately.
OANDA:XAUUSD

Gold Weekly Review — Historic Volatility & Next Week’s Key LevelThis week, gold experienced a historic level of volatility, a truly remarkable movement that left many traders astonished.
During the session, prices tested the 4200–4180 support zone for the first time. The nearly $200 decline effectively released the heavy selling pressure that had been building up in recent days, while also creating new opportunities for bullish entries.
As expected, once prices entered the support region, they rebounded strongly, closing above 4250 with a recovery of nearly $70 (all of which I had clearly indicated in advance).
From the 30-minute chart, the candlestick structure still suggests further upside potential. However, given the weekend uncertainty, any unexpected bearish news could trigger a pullback when markets reopen on Monday.
If no major negative developments occur, bullish momentum may continue to drive gold higher. Resistance is likely to be concentrated around the 4280–4300 zone — once price enters this region, both short-term buyers and trapped long positions may start adjusting their holdings, which could increase the likelihood of a short-term correction.
On the 4-hour chart, this nearly $500 rally has just completed its first test of the MA30 support. The MA5 (near 4270) currently acts as the key resistance, followed by MA10 (around 4292).
If during consolidation, the price can hold above MA20 (around 4246), it will likely attract renewed buying interest, potentially driving prices back toward 4380 or even higher.
Conversely, if prices remain under pressure and fail to stay above the MA20, attention should shift to the MA30 support. A break below this level could open the way to a test of the MA60(near 4100).
Therefore, for next week’s trading, these levels will be our key focus points.
As I mentioned earlier this week, the medium-term long positions have been closed, and we will wait for new opportunities to emerge. If the market drops toward 4100 or even lower, I will consider re-entering long positions from those lower levels.
A friendly reminder — always align your trading strategy with your own risk tolerance and financial situation. Medium-term setups require patience and strong risk-bearing capacity. If your current condition doesn’t allow for that, please avoid blind following to prevent unnecessary losses.
Lastly, note that gold still has two unfilled gaps around 4019–4024 and 3887–3898. If the trend turns bearish, these gaps may present potential trading opportunities.
That’s all for today.
We’ll discuss specific intraday trading opportunities when the market opens.
If you have any questions or need guidance, feel free to leave me a message.