ElDoradoFx PREMIUM 2.0 – (15/10/2025, ASIA SESSION)
Gold remains steady around 4,143, consolidating after Monday’s correction from 4,179 → 4,097.
The broader trend is still bullish, but we are now in a tight accumulation phase below 4,155 resistance — typically a sign of an upcoming breakout.
⸻
🔍 Technical Outlook
D1 (Macro Trend)
• Structure: Higher highs, higher lows – uptrend intact.
• RSI ≈ 82 → overbought but stable.
• MACD: Still bullish but showing early loss of momentum.
• Support Zone: 4,086–4,063
➡️ Daily bias remains bullish above 4,085.
⸻
H1 (Intraday Structure)
• Price moving inside ascending channel.
• 20EMA & 50EMA provide confluence at 4,129–4,131.
• RSI 58 = neutral.
• MACD starting to recover after brief bearish phase.
➡️ Price building energy for a breakout.
⸻
15M–5M (Execution Zone)
• Micro BOS at 4,136 confirms short-term accumulation.
• Liquidity above 4,155–4,165, below 4,125–4,110.
• Compression visible on Heikin Ashi – volatility incoming.
⸻
📊 Fibonacci Golden Zone
🌀 Swing Low → 4,097
🌀 Swing High → 4,155
📈 Golden Zone = 4,125 – 4,136
Ideal buy zone aligned with EMA and structural retest.
⸻
🎯 High-Probability Trade Scenarios
✅ Bullish Breakout Setup
• Breakout Price → Above 4,155
• Entry → Retest 4,150–4,155
• Targets → 4,165 → 4,179 → 4,200
• SL → Below 4,136
📗 Continuation of major bullish trend.
⸻
🟡 Golden Zone Buy (Re-entry)
• Entry → 4,125–4,136
• Targets → 4,144 → 4,155 → 4,165
• SL → Below 4,110
📗 Best low-risk intraday buy opportunity.
⸻
⚠️ Bearish Breakout (Correction)
• Breakout Price → Below 4,110
• Entry → Retest 4,110–4,115
• Targets → 4,097 → 4,085 → 4,072
• SL → Above 4,125
📕 Short-term sell for liquidity sweep or pullback.
⸻
📅 Fundamental Watch
• No high-impact Asian data.
• U.S. CPI tomorrow – major volatility expected.
• DXY steady near 105.10, capping short-term gold upside.
⸻
🧩 Key Levels
Resistance: 4,155 / 4,165 / 4,179
Support: 4,136 / 4,125 / 4,110 / 4,097
Breakout Zones:
🔼 Buy above 4,155
🔽 Sell below 4,110
⸻
🧠 Summary
Gold is coiling under resistance – a breakout is imminent.
Watch 4,155 for bullish continuation or 4,110 for bearish extension.
Stay patient — next impulse move likely starts from the Golden Zone (4,125–4,136).
⸻
✍️ Follow for more institutional-grade XAUUSD breakdowns.
— ElDoradoFx PREMIUM 2.0 Team 🚀
⸻
🥇 ElDoradoFx PREMIUM 2.0 – PERFORMANCE 14/10/2025 🥇
📊 GOLD TRADES RECAP:
🟢 BUY (Swing) +950 pips (from 13/10)
🟢 BUY +50 pips
🟢 BUY +210 pips
🔻 SELL +20 pips
🔻 SELL LIMIT +160 pips
🟢 BUY +20 pips
🟥 BUY –40 pips (SL)
🟢 BUY LIMIT +40 pips
🔻 SELL +110 pips
🔻 SELL +60 pips
---
💰 TOTAL GOLD PIPS WON: +1,580 pips
📈 RESULT: 10 Signals → 9 Wins | 1 SL
🎯 ACCURACY: 90 %
Xauusdbuy

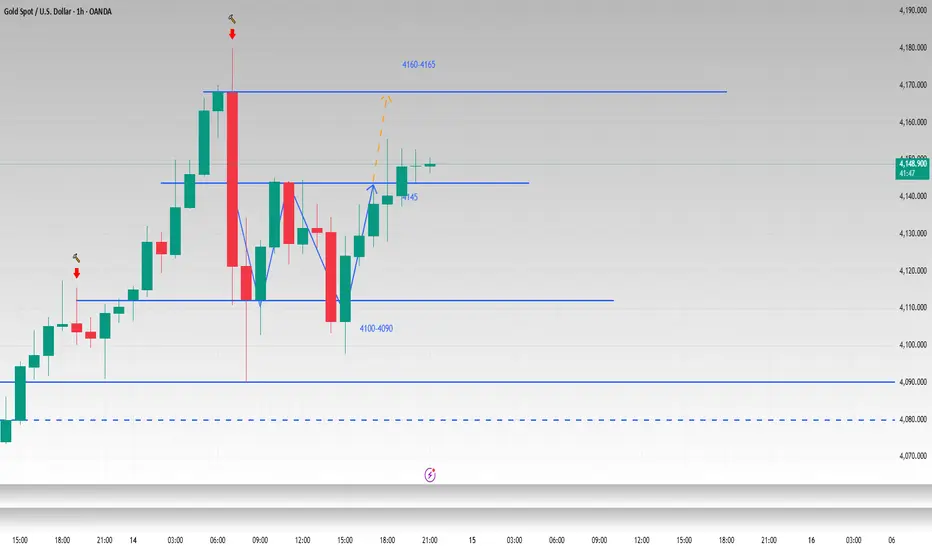
W pattern is established and the bullish pattern remain unchangeI have said before that gold is in a fluctuating upward state whether viewed from the weekly or daily charts, and there is no reversal signal. I mentioned in my previous post that from the hourly chart, gold has the prototype of a W shape, and the neckline is at 4145. In the evening of the US session, gold successfully broke through the neckline and touched around 4155. Although the bullish momentum of gold has stagnated slightly after a slow rise, I am still optimistic that gold will reach 4160-4165. If it falls back to around 4145-4135 again, we can still consider trying to go long on gold.
OANDA:XAUUSD
XAUUSDGold hit a high of 4180 before plummeting 90 points in a remarkably short period of time, a clear sign of a major market manipulation. September's gains were very stable, with limited room for pullbacks. We must be wary of a sharp and rapid decline in October. Excessive gains will inevitably lead to a market shakeout, a risk we've repeatedly discussed.
After breaking through yesterday's high, the daily chart suggests a continuation of the trend today, with an intraday surge. However, after the sharp drop, a return to strength may not be imminent; a period of consolidation is needed. Therefore, the US market is expected to see volatility initially. With prices deviating significantly from the short-term moving average, a correction is needed to bring prices closer. An uncorrected rise is unhealthy. A return to bullish strength after a correction indicates the trend is continuing.

GOLD: Short-term testing of the 4080 support levelRecently, due to the ongoing deadlock between the U.S. Democratic and Republican parties, the government has remained in a shutdown. Concerns over economic downturn have intensified, while expectations for the Federal Reserve to cut interest rates within the year have continued to rise. Additionally, trade frictions have escalated again—all these factors have driven gold prices to keep surging, making gold once again the darling of the global economy.
However, in the afternoon, as Trump repeatedly emphasized peace in the Middle East, gold experienced a sharp drop of nearly $90 after hitting the all-time high around the 4179 level. It then rebounded to a high of around 4145, and a platform resistance has formed at this level in the short term. Currently, long-position traders are jittery at high levels. For short-term trading, the risks and profits for both long and short positions are basically balanced.
We also reminded everyone in the afternoon to exit long positions in a timely manner, and any level above 4130 is a good entry point for short positions. Gold is now testing the support around the 4080 mark again. For short-term trades, it is advisable to go short on rebounds; for medium-to-long-term positions, we still expect gold to continue surging to new all-time highs after a pullback.
💎
Sell 4120 - 4125 TP 4100 - 4080 SL 4130
Buy 4075 - 4080 TP 4090 - 4100 SL 4070
Daily-updated accurate signals are at your disposal. If you run into any problems while trading, these signals serve as a reliable reference—don’t hesitate to use them! I truly hope they bring you significant assistance
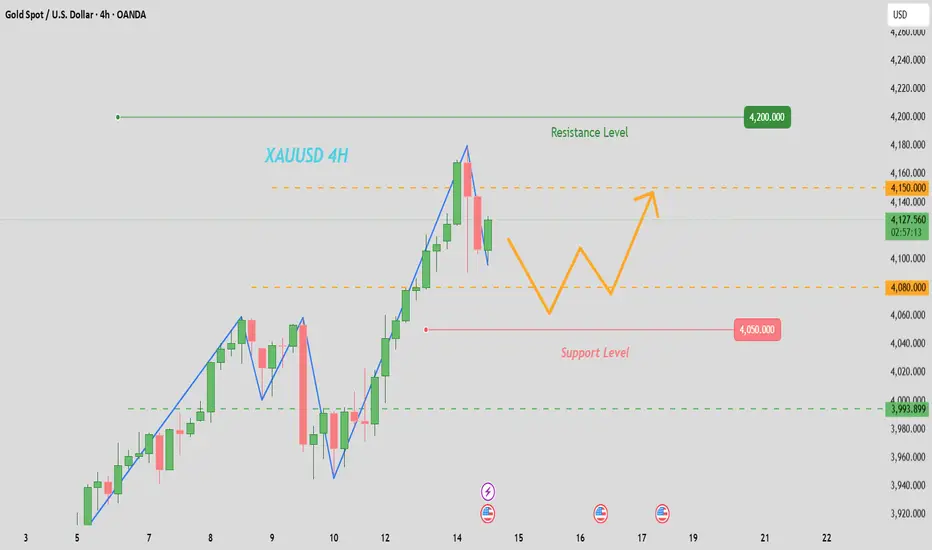
#XAUUSD: Price Is Likely To Hit $4200 Before Bearish CorrectionDear Traders,
Gold is likely to reach $4200 before experiencing a significant decline. We anticipate a final push potentially exceeding $4000. The current market sentiment is strong and is likely to drive the price to our target region. However, we require confirmation in a shorter timeframe and recommend employing appropriate risk management.
If you find our analysis valuable please engage with it. Follow us for further insights.
Sincerely,
Team Setupsfx

#XAUUSD: Targeting $4200, An 1800+ Pips Swing ViewDear traders,
Since we posted our previous idea on the gold price has reversed as we had anticipated. However, when we examine smaller time frames we gain greater clarity on the price’s progression. As of now, the price is trading at 4015 and may open with a positive gap on Monday. Our primary objective should be to allow the market to open on Monday. Once the price has settled, we can execute a more secure and well-managed RR trade.
Please do not consider this as a guarantee. Instead, use it as an educational perspective or bias. Conduct your own analysis and trade safely.
Team Setupsfx_

ElDoradoFx PREMIUM 2.0 – (14/10/2025, U.S. SESSION)Gold continues to consolidate after a strong intraday rebound from 4,090. The market is showing compression between 4,125–4,144, forming a temporary equilibrium structure after Friday’s impulsive rejection from 4,179. Volatility is expected to increase as liquidity builds ahead of U.S. CPI data tomorrow.
⸻
🧭 MARKET STRUCTURE OVERVIEW
• Trend Context: Macro bias remains bullish (D1 uptrend intact), but short-term distribution structure is visible below 4,144–4,150.
• Liquidity Zones:
• Buy-side liquidity resting above 4,150–4,165.
• Sell-side liquidity below 4,093–4,072.
• Market Cycle Stage: Reaccumulation or pre-breakout compression.
⸻
🔍 MULTI-TIMEFRAME TECHNICAL OUTLOOK
D1 – Macro Trend Context
• Price action: Successive bullish candles above 20EMA and 50EMA.
• RSI (81.9): Overbought but still supportive — structure points to controlled retracement before continuation.
• MACD: Bullish momentum moderating, suggesting potential pause before trend expansion.
• Key level: Daily resistance at 4,179.70 (weak high), immediate support 4,084–4,063.
H1 – Intraday Structure
• Clean Break of Structure (BOS) from 4,090 → 4,137, followed by consolidation.
• Minor lower high confirmed at 4,144, forming temporary range.
• RSI at 57 — neutral, showing balanced order flow.
• MACD histogram contracting, indicating loss of bullish momentum.
• Current structure favors a pullback toward the Golden Zone before next directional move.
15M–5M – Short-Term Precision View
• Clear CHoCH observed below 4,132.
• EMA cluster flattening (20EMA ≈ 4,130, 50EMA ≈ 4,125).
• Short-term buyers defending 4,125–4,120, but volume divergence showing early exhaustion.
• A break below 4,125 would confirm liquidity sweep and open the door for 4,093–4,072 retracement.
⸻
📊 FIBONACCI GOLDEN ZONE ALIGNMENT
• Swing High: 4,179
• Swing Low: 4,090
➡️ Golden Zone = 4,124 – 4,136
This zone coincides with the 1H resistance confluence, trendline touchpoint, and intraday imbalance fill. It serves as the key decision zone for U.S. session traders.
⸻
🎯 HIGH PROBABILITY TRADE SETUPS
1️⃣ Bullish Continuation Scenario
• Confirmation: Break & retest above 4,144.
• Entry: Buy on retest of 4,144–4,147 zone.
• Targets: 4,165 → 4,179 → 4,200
• Stop-loss: Below 4,125 (structure invalidation).
• Rationale: Reclaiming prior supply + momentum expansion expected if DXY weakens.
2️⃣ Bearish Corrective Scenario
• Confirmation: Rejection from 4,136–4,144 (Golden Zone).
• Entry: Sell from 4,136–4,140 range with candle confirmation.
• Targets: 4,110 → 4,093 → 4,072
• Stop-loss: Above 4,150.
• Rationale: RSI divergence + MACD histogram contraction + liquidity sweep above previous highs.
⸻
📅 FUNDAMENTAL CATALYSTS
• 🕐 No major U.S. economic data today, but traders are positioning ahead of tomorrow’s CPI report, which will define midweek volatility.
• 🕐 DXY remains stable near 104.90, keeping gold capped intraday.
• 🕐 Treasury yields flat; risk sentiment mixed — aligning with gold’s consolidation.
⸻
⚠️ KEY TECHNICAL LEVELS
• Major Resistance: 4,144 / 4,165 / 4,179
• Intraday Support: 4,125 / 4,110 / 4,093 / 4,072
• Extreme Levels: 4,050 support pivot / 4,200 macro extension.
⸻
🧩 SENTIMENT & SUMMARY
Gold is currently in a compression phase between intraday supply (4,136–4,144) and demand (4,110–4,125).
Expect low volatility until a clear break of structure occurs.
📈 Above 4,144 → momentum resumes toward 4,165–4,179.
📉 Below 4,110 → corrective wave extends into 4,093–4,072 before potential bounce.
The safest approach for institutional-style execution is to wait for confirmation at the boundaries of the Golden Zone rather than pre-positioning.

Gold continues to go longAfter hitting a record high of $4,179.47 per ounce on Tuesday, gold prices retreated sharply, currently fluctuating around $4,130. This pullback was primarily driven by two factors: first, Trump's shift in tariff stance boosted market risk appetite and weakened safe-haven demand; second, a technical rebound in the US dollar prompted profit-taking in gold, which was already heavily overbought. However, market expectations of two Federal Reserve rate cuts this year have limited the dollar's upside. Coupled with ongoing US political uncertainty, trade tensions, and geopolitical conflict risks, gold's safe-haven status remains solid, and downside is expected to be limited.
From a technical perspective, gold closed with another large bullish candlestick on the daily chart, demonstrating strong bullish momentum.
Today's pullback low near $4090 has become key support, and 4090 could be considered a near-term bull-bear watershed. Trading strategies recommend buying on dips following pullbacks.
Gold Recommendation: Buy lightly at the current price of 4129, and add to your long position if the price dips to 4118-4112. Stop loss at 4000, target at 4170.

Gold’s Bull Run Continues – Target $4,080+Gold is clearly maintaining strong bullish momentum above $4,000. The market has maintained its upward trajectory since rebounding from the $3,900–$3,920 support zone. This zone acted as a solid demand area, leading to consistent higher highs and higher lows — a clear indication that buyers are dominating.
The recent price action shows a clean breakout above the $3,980–$4,000 resistance area, which has now turned into a new short-term support. The chart also marks a “Weak High” near the current level, suggesting that a minor pullback or consolidation could occur before another bullish push resumes. This retracement could test around $4,010–$4,020 before aiming higher.
The next major resistance levels are visible at $4,060, $4,075, and potentially $4,080–$4,100, which could be the next targets if bullish momentum continues. As long as gold stays above $4,000, the overall market bias remains positive. A sustained break below this zone might trigger a deeper correction toward $3,960 or even $3,940, but that currently looks less likely given the strong bullish structure.
In summary, the short-term outlook remains bullish with expectations of a possible brief dip before continuation toward $4,080+. The trendline support and consistent break of minor resistances confirm strong buyer confidence in the market.
Strong bullish trend continues
Key resistance: $4,072 → $4,132 → $4,150
Support to watch: $3,976 → $3,925
🔹 Buy Zone:
A potential buy zone lies between $4,010 – $4,025, where a short retracement is expected before the next upward move. This area aligns with minor structure support and trendline confluence, making it ideal for re-entry or fresh long positions.
🔹 Buy Trigger:
A strong buy trigger would be a bullish 1-hour candle closing above $4,045, confirming momentum continuation toward the next resistance targets at $4,065, $4,075, and $4,080+.
Note
Please risk management in trading is a Key so use your money accordingly. If you like the idea then please like and boost. Thank you and Good Luck!

Gold Bulls Triumph — How Can Trapped Bears Escape?Good afternoon, everyone!
Driven by multiple macroeconomic and geopolitical factors, gold prices have continued to climb, reaching a new all-time high near 4180/oz today.
The recent rally has been supported by:
Rising global trade tensions;
Market expectations of two Fed rate cuts this year;
Economic uncertainty from the U.S. government shutdown;
Escalating risks in the Russia–Ukraine conflict.
However, as the price extended higher, technical indicators show extreme overbought conditions, while renewed dollar buying triggered profit-taking near 4180, causing a sharp pullback to around 4090 (30M lower band) before rebounding.
Currently, gold is trading near the mid-band, and after a bearish divergence on the 30M chart, a similar divergence has appeared on the 1H chart, suggesting that further downside pressure may follow after the rebound.
Despite this, the weekly structure remains bullish, and given the ongoing geopolitical instability, any meaningful technical correction could still be viewed as a buying opportunity.
Key Support Levels:
4060–4050/4045 zone — primary short-term support;
A confirmed break below this level could trigger technical selling, leading to a potential retest of the 4000 psychological level or even the 3986 daily trendline support.
For medium-term long positions established earlier, consider partial profit-taking this week to manage risk, as a broader daily or weekly correction could see a pullback of up to $200.
Short-Term Technical Structure:
Current price near 4140 support, with secondary support around 4128 and key support at 4107-01;
Resistance levels are at 4146 / 4159 / 4168.
Trading Strategy:
Use a scalping or short-term trading approach during volatile sessions;
Conservative traders can focus on range trading between key support and resistance;

GOLD (XAU/USD) – Support Retest and Bullish Breakout ExpectedCurrent Market Overview
Current Price: 4,140.65
Trend: Bullish short-term structure within an ascending channel.
The market has been forming higher highs and higher lows, indicating ongoing momentum to the upside.
📊 Chart Analysis
Ascending Channel:
Price has respected the upward channel with clean touches on both upper and lower boundaries — suggesting strong bullish control.
Support Zone (4,070–4,103):
A clearly marked support level where buyers are likely to step in again.
Entry Point: 4,103.074
Stop Loss: 4,070.469
This zone aligns with previous consolidation and channel midline support.
Target Level:
Target: 4,238.934
Expected Gain: ~3.39% (+139 points)
This target aligns with the upper boundary of the ascending channel and previous resistance zone.
📈 Trade Plan Summary
Parameter Level (USD) Notes
Entry Point 4,103.074 Wait for price to retest support
Stop Loss 4,070.469 Below support zone
Target 4,238.934 Near resistance area
Risk–Reward Ratio ≈ 1:4 Very favorable setup
⚙️ Projection
Expect a minor pullback to the support area before continuation upward.
If the price holds above 4,070, buyers may regain momentum.
A break below 4,070 could invalidate the bullish setup and open downside risk.
🧭 Conclusion
Gold remains bullish above 4,070 with a potential move toward 4,238.
Watch for a retest and rejection confirmation at the support zone before entry to validate bullish continuation.

ElDoradoFx PREMIUM 2.0 – (14/10/2025, LONDON SESSION)
Gold rejected 4,179 after forming a double-top structure and has entered a short-term correction phase.
The 1H chart shows a Break of Structure to the downside, and price is now retesting the 4,125–4,134 supply area.
The overall trend remains bullish, but this pullback is healthy after an extended rally.
⸻
🔸 BREAKING PRICE:
Below 4,093 confirms continuation toward 4,073 → 4,050
Above 4,150 reopens bullish momentum toward 4,179 → 4,200
⸻
🔸 FIBONACCI GOLDEN ZONE (4,085 → 4,179):
🎯 4,106 – 4,118 → Current decision zone.
If price holds above, buyers may re-enter.
If it fails, expect deeper correction.
⸻
🔸 HIGH PROBABILITY AREAS:
🔻 SELL Zone: 4,125–4,134
🎯 Targets: 4,090 → 4,073 → 4,050
🛑 SL: Above 4,150
🔹 BUY Zone (Reversal Confirmation):
Break above 4,150 → Targets: 4,165 → 4,179 → 4,200
🛑 SL: Below 4,125
⸻
🔸 FUNDAMENTAL WATCH:
• No major UK data today.
• DXY holding near 104.90, applying pressure on gold.
• Market focus remains on upcoming U.S. CPI → expect volatility spikes.
⸻
🔸 SUMMARY:
Gold is correcting after rejection at 4,179.
Focus on 4,125–4,134 for possible short re-entries.
Break below 4,093 = confirmation of deeper correction.
Above 4,150, buyers take control again.
⸻
💎 ElDoradoFx PREMIUM 2.0 – Session Analysis
#XAUUSD #Gold #ElDoradoFx #LondonSession #Analysis

Gold shows strength again on Monday💎Gold has broken through the previous high of 4059, and the strong bullish momentum continues. Every Monday sees a sharp rise,those who review historical market data will notice this cyclical pattern.
📈Today, as a Monday, gold is surging toward the key 4100 level. Amid such a strong bull trend, any attempt to predict the peak will be crushed by the trend itself. Investors who fail to understand the principle of "trading with the trend" are bound to end up with disastrous results.
📈After breaking above 4080 today, the upward room has opened up again. Focus on the 4125-4170 range on the upside, as this is the extended target zone following the breakout. Given the current volatility, gold may even reach this range in a single trading day. The market is currently in a state of bullish enthusiasm, and we remain bullish on the trend. However, we must also guard against correction risks and adhere to the strategy of "being bullish but not blindly chasing upward moves." It is advisable to let the market develop further; a pullback to form a low will also provide a defensive entry point.
Buy 3080 - 3085
TP 4000 - 4010
SL 3075
Daily-updated accurate signals are at your disposal. If you run into any problems while trading, these signals serve as a reliable reference—don’t hesitate to use them! I truly hope they bring you significant assistance

Gold Price Outlook – Trade Setup (XAU/USD)📊 Technical Structure
TVC:GOLD Gold (XAU/USD) rallied strongly in the Asian session, reaching $4,130, marking a fresh all-time high. Price action shows a support zone at $4,112–$4,117 and a resistance zone at $4,159–$4,165. If gold consolidates above support, buyers may attempt to push toward the resistance zone. However, as the rally has been steep, some pullback into support is possible before the next leg higher.
🎯 Trade Setup
Entry: $4,112–$4,117 (buy near support)
Stop Loss: $4,109
Take Profit 1: $4,137
Take Profit 2: $4,159
Take Profit 3: $4,165
Risk/Reward (R:R): ~1 : 6.22
🗝️ Key Technical Levels
Support Zone: $4,112–$4,117
Resistance Zone: $4,159–$4,165
Trend Bias: Bullish above $4,112
🌍 Macro Background
Gold price (XAU/USD) jumps to a fresh record high near $4,130 during the early Asian session on Tuesday, supported by renewed US–China trade war fears. US President Donald Trump announced new trade measures, including 100% tariffs on all Chinese goods and export controls on critical US-developed software, effective November 1. Although Trump later struck a softer tone, saying the US was not looking to “hurt” China, investors still rushed to safe-haven assets.
At the same time, expectations for further Federal Reserve rate cuts are growing. Markets are pricing in an almost certain 25 bps cut in October and another in December, according to the CME FedWatch tool. Lower interest rates reduce the opportunity cost of holding gold, supporting the rally. Traders are also awaiting Fed Chair Powell’s speech later on Tuesday, which could provide additional policy guidance.
Despite strong year-to-date gains (over 56%), analysts note that while the rally has legs, a short-term correction would be healthy for sustaining the long-term uptrend.
📌 Trade Summary
Gold remains bullish above $4,112 support zone. Dips into this area are likely to attract renewed buying interest, with upside targets at $4,159–$4,165. A break below $4,109 would invalidate the bullish setup and expose deeper corrective pressure.
⚠️ Disclaimer
This analysis is for reference only and does not constitute trading advice. Trading involves significant risk, and proper risk management is essential.

ElDoradoFx PREMIUM 2.0 - (14/10/2025, ASIA SESSION)Gold remains in a strong bullish trend across all major timeframes, consolidating near the 4,110–4,117 resistance zone after a solid impulse from 4,050.
The market shows sustained buying pressure, but short-term exhaustion is visible with potential for a healthy pullback before continuation.
⸻
🧩 Multi–Timeframe Technical Breakdown
📆 Daily (D1):
• Candle closed bullish, extending the uptrend from late September.
• RSI remains overbought (~86) → suggesting potential short-term correction.
• MACD still expanding positively → confirms medium-term bullish continuation.
Bias: Bullish (Possible minor retracement before continuation)
⸻
⏰ 1H Structure:
• Clear BOS above 4,078, followed by sustained higher highs and higher lows.
• Price currently consolidating under 4,117 resistance after intraday overextension.
• 20EMA and 50EMA acting as dynamic support near 4,100–4,104.
• MACD histogram losing strength — early retracement signals forming.
Bias: Bullish, but expecting corrective pullback before next leg
⸻
🕒 15M–5M Intraday Outlook:
• Price forming a minor CHoCH at 4,117, confirming exhaustion at top of ascending channel.
• Potential pullback into Fibonacci Golden Zone (4,097–4,101) for liquidity grab before continuation.
• If 4,093 breaks, expect a short-term correction back into 4,085–4,072 liquidity pocket.
⸻
✨ Fibonacci Golden Zone
Swing Low: 4,085 → Swing High: 4,117
🎯 Golden Zone: 4,097 – 4,101
This confluence aligns with 1H EMA + BOS retest → ideal re-entry area for buys.
⸻
📈 Trading Plan
✅ High Probability Buy Setup (Continuation Bias):
• Entry: 4,097–4,101 (Golden Zone retest)
• Confirmation: Bullish rejection / EMA bounce
• Targets: 🎯 4,117 → 4,125 → 4,135 → 4,150
• Stop Loss: 🛑 Below 4,085
⸻
⚠️ Short-Term Sell Setup (Correction Bias):
• Entry: Break & Retest below 4,093
• Targets: 🎯 4,085 → 4,072 → 4,050
• Stop Loss: 🛑 Above 4,104
⸻
🧠 Key Market Levels
• Resistance: 4,117 / 4,125 / 4,135
• Support: 4,101 / 4,093 / 4,085 / 4,072
• Trendline Supports: 4,085 & 4,050 zones
⸻
📰 Fundamental Context
• No major Asian data → technicals dominate.
• U.S. Bank Holiday liquidity fading; normal flow resumes in London.
• DXY steady near 104.80, keeping gold capped but structurally bullish.
⸻
⚡️ Summary
Gold remains bullish overall, consolidating below 4,117 after strong gains.
Expect an intraday pullback toward 4,097–4,101 before the next impulse.
Break above 4,117 → confirms continuation to 4,135–4,150.
Break below 4,093 → triggers short-term correction only.
⸻
📊 Prepared by ElDoradoFx PREMIUM 2.0
💎 Professional XAUUSD Analysis | Session Outlooks | Smart Money Insights
#XAUUSD #Gold #Forex #ElDoradoFx #PriceAction #SmartMoney #AsiaSession #TradingView #TechnicalAnalysis
⸻
🥇 ElDoradoFx PREMIUM 2.0 – PERFORMANCE 13/10/2025 🥇
⚡️ GOLD TRADE RESULTS:
🔻 SELL +30 pips
🟢 BUY +210 pips
🟢 BUY +360 pips
---
💰 TOTAL GAIN: +600 pips
🎯 RESULT: 3 Signals → 3 Wins | 0 SL
📊 ACCURACY: 100 % ✅
---
🔥 Sharp setups. Strong momentum. Maximum precision.
A flawless start to the week — profits locked in 📈💎
🚀 Congratulations if you profited! ✅✅✅

Gold Next Move : 4222? NEW ATH CONTINUOUSLY ?Gold Currently Runs On The Bullish Channel
We Are Considering Bullish Setup On RBS Pull Back Buy Zone
Area To Buy 4060 / 4050
Pullback Buy
Target Bullish Setup 4220 - 4250
Lets Gooo NEW ATH GOLD

Gold: Breaks Above 4900, Targets 4100-4120 ResistanceAs we predicted over the weekend and this morning, Gold is exhibiting the characteristic of "strong rally + high-level consolidation" today. The price surged rapidly after the opening; despite a slight pullback in the middle, bullish sentiment remains strong. It has now broken above 4900 and is expected to test the resistance range of 4100-4120.
As we also mentioned today.If it breaks above 4,080, you can go long in line with the trend, with targets set at 4,100
Buy 4070 - 4080
TP 4090 - 4100 - 4110
SL 4060
Daily-updated accurate signals are at your disposal. If you run into any problems while trading, these signals serve as a reliable reference—don’t hesitate to use them! I truly hope they bring you significant assistance

gold on sideways until breakout on buy or sell#XAUUSD price await breakout below the 4073 to sell, target 4060 first TP, stop loss 4086.
Breakout below the 4058-4055 will drop the price further more till 4025.
Above the 4088-90, price have bullish breakout which will form new trend at 4112.

GoldXAUUSD
- Break of Structure
- Supply Zone
- Bullish Channel as an corrective pattern in Short Time Frame
- RSI - Divergence
- Completed " 1234 " Impulsive Waves

XAUUSD: long-short battle hinges on 4060-4080📈Today's daily chart shows that after completing a "double bottom" last Friday, Gold stabilized and rebounded, which fully aligns with our weekend forecast. It closed with a long lower wick bullish candlestick, indicating robust buying interest at lower levels and that the medium-to-long-term uptrend remains intact.
📈On the 4-hour chart, the Bollinger Bands have started to contract, signaling that gold prices may enter a consolidation range of 3,930 - 4,070. Today, after breaking above 4,070, the price failed to hold this level and pulled back to around 4,069 for consolidation. This reflects strong resistance near 4,080, and in the short term, we need to be wary of a pullback risk triggered by profit-taking among bulls.
💡Intraday, focus on price fluctuations within the 4,060 - 4,080 range. If it breaks above 4,080, you can go long in line with the trend, with targets set at 4,100. If it pulls back below 4,030, be alert to the formation of a short-term top.
Buy 4040 - 4050
TP 4060 - 4070 - 4080
SL 4030
Daily-updated accurate signals are at your disposal. If you run into any problems while trading, these signals serve as a reliable reference—don’t hesitate to use them! I truly hope they bring you significant assistance

Bullish Strategy Secures Profits — What’s the Next Move?Good evening, everyone!
Today, gold surged above 4040 before pulling back to the 4033–4022 support area, then rebounded strongly to break the 4050–4060 previous highs, setting another new record.
Congratulations to all traders who followed the strategy — this move has delivered impressive profits! 👏
From a medium-term perspective, the overall structure remains bullish. However, on the 30-minute timeframe, the market shows signs of a technical correction, which is a normal consolidation phase.
Short-term support is located near the 4050 previous high, followed by 4038–4028. In a deeper pullback scenario, the price could test 4015–4011, though without major news catalysts, such a decline seems less likely. Therefore, attention should focus mainly on 4050/4038 as key short-term zones.
If gold continues rallying without a proper pullback, the next potential upside target is around 4100. Should the price reach that level with weakening momentum, it may present a relatively low-risk short-selling opportunity.
Trading Strategy Summary:
Swing traders: Consider buying near 4050 and selling near 4100.
Short-term traders: Use quick in-and-out trades around intraday support and resistance levels.

GOLD Continue To Upside ,Should We Buy It After Great Breakout ?Here is My 30 Min Gold Chart , and here is my opinion , the price going up very hard without any correction so we should move with it and we have a 4H Candle closure above our Res 4059.00 And Perfect Breakout and this give us a very good confirmation , so we have a good confirmation now to can buy after the price go back to retest the broken area 4059.00, and we can be targeting 100 to 200 pips . if we have a daily closure below this area this mean this idea will not be valid anymore .
Reasons To Enter :
1- Perfect Touch For The Area .
2- Clear Bullish Price Action .
3- Bigger T.F Giving Good Bullish P.A .
4- The Price Take The Last High .
5- Perfect 4H Closure .

XAUUSD 15m – EW Long SetupHi fellow traders,
On the 15m XAUUSD chart, I am applying Elliott Wave principles to outline a potential long setup. Price appears to have completed wave (iv) and is showing early signs of reversal from the golden box area, suggesting that wave (v) may now be underway.
I am entering at the current price, with a Stop Loss at 3940.00, serving as the invalidation level. My Take Profit is set at 4078.87, targeting the projected completion of wave (v). If price moves below the invalidation level, this wave count is no longer valid.
Good luck and trade safe!
