Gold/USD: Bullish Climb to $4100?OANDA:XAUUSD is showing a bullish setup on the 1-hour chart , with an entry zone between $3,963-$3,985 near a key support level.
First target at $4,075 marks initial resistance, while the second at $4,100 offers a deeper upside potential. Set a stop loss on a close below $3,940 to manage risk effectively. 🌟
A break above $3,985 with strong volume could confirm this move, driven by safe-haven demand and USD dynamics. Watch economic data trends! 💡
📝 Trade Plan:
✅ Entry Zone: $3,963 – $3,985 (support area)
❌ Stop Loss: Daily close below $3,940
🎯 Targets:
TP1: $4,075 (initial resistance)
TP2: $4,100 (extended target)
Ready for this rally? Drop your thoughts below! 👇
Xauusdbuy

Gold: forecast 📈We predict that next week gold will oscillate upward in the range of 3,960 - 4,080, gradually rise relying on trendline support, and is expected to test the resistance at 4,050 during the week. If it breaks through with increased volume, it will target 4,100 resistance level.
💡However, at the same time, we need to closely monitor Fed policy and geopolitical risks as core variables, because macro events may become the key to breaking the balance.
GOLD Potential Short!
HI,Traders !
#GOLD is growing Nicely but will
Soon hit a horizontal resistance
Of 4049.41 so after the
Retest a local bearish
Pullback is to be expected !
Comment and subscribe to help us grow !

XAUUSD: Next - week forecastOver the past week, gold rebounded sharply after a sharp decline, formed a "double-bottom" pattern, and regained the 4,000 level, with clear short-term support.
We predict that next week gold will oscillate upward in the range of 3,960 - 4,080, gradually rise relying on trendline support, and is expected to test the resistance at 4,050 during the week. If it breaks through with increased volume, it will target 4,100 resistance level.
However, at the same time, we need to closely monitor Fed policy and geopolitical risks as core variables, because macro events may become the key to breaking the balance.

XAUUSD analysis – 1H FVG and OB SetupsThe overall structure remains bullish, with price creating higher highs and higher lows.
Currently, we are in a retracement phase, and the two highlighted demand zones at 3968 and 3927 represent potential areas for continuation entries.
Our plan:
Wait for confirmation signals on lower timeframes (3M–15M) — such as BOS + OB + FVG alignment — before entering long positions.
The first zone (3968) aligns with a short-term OB that could trigger early buy reactions, while the second zone (3927) is a deeper liquidity sweep area with higher probability if price decides to extend its correction.
As long as price stays above 3927, the bullish narrative remains valid.
We’ll reassess only if that level breaks cleanly with strong bearish displacement.
📊 ProfitaminFX | Gold, BTC & EUR/USD
📚 Daily setups & educational trades

Gold Returns to 4000 — Watch the Next Key Level HereAfter yesterday’s pullback, part of the selling pressure accumulated during the recent rally has been released, allowing gold to regain stability above the 4000 level.
On the 2H chart, the immediate resistance lies around 4012. Although the price has temporarily broken through this level, it’s crucial to observe whether it can hold above 4012 after the pullback. If not, focus on the 4000–3990 support zone below.
Technically, the overall trend remains bullish, with resistance levels at 4024–4028/33, followed by the 4050 area.
For trading strategy, short-term traders can operate within the 3990–4028 range, buying near support and selling near resistance.
If the price climbs above 4040, look for short-selling opportunities. During pullbacks, monitor 4028-24/22 as key support levels for potential long entries.

GOLD PRICE ANALYSIS – SUPPORT RETEST BEFORE NEXT BULLISH MOVEChart Overview
Current Price: $3,973
Support Zone: $3,882 – $3,942
Target Level: $4,189
Channel Type: Ascending channel pattern (bullish structure)
📊 Technical Insights
Trend Structure
Gold is trading within a rising parallel channel, showing higher highs and higher lows.
The current pullback is approaching the lower boundary of the channel, a potential buy zone.
Support Area
The marked support zone ($3,882 – $3,942) aligns with both:
Channel support trendline
Previous structure lows (confluence support)
This makes it a strong potential reversal zone.
Possible Scenarios
Scenario A (Bullish Continuation)
Price bounces from the support zone and resumes upward momentum toward the target level at $4,189, representing a +6.23% move.
Scenario B (Deeper Correction)
Price briefly dips below the lower boundary before reclaiming it — forming a false breakout and then rallying higher.
Momentum Context
Short-term retracement is normal within an uptrend.
If candles show rejection wicks or bullish engulfing patterns around $3,900–$3,940,** it could confirm bullish continuation.
⚙️ Trading Plan Idea (Educational)
Buy Zone: $3,885 – $3,940
Target: $4,180 – $4,190
Stop-Loss (suggested): Below $3,870 (to protect against breakdown)
Risk–Reward Ratio: Approx. 1:3
📈 Summary
Gold remains bullish within its rising channel.
A short-term dip toward the support zone could offer a strong buy opportunity before the next push toward the $4,189 target.

After the Double Top — What’s Next for Gold Trading?Hello everyone!
Gold has now formed a clear double-top pattern, and the current price zone is crucial — it will determine whether the market continues its downward move or starts building a potential double-bottom formation.
The key levels to watch are: resistance at 4036 and support between 4011–4000.
Before a decisive breakout occurs, traders can focus on range trading between 4005–4025.
If the price breaks below support, the next downside targets are 3992, followed by 3986–3972/64.
Conversely, if gold breaks above 4036 and stabilizes above it, the price could extend upward toward 4046–4058.
From a technical standpoint, the current structure remains bearish-biased, so long positions should be approached with caution. A quick in-and-out trading style is recommended for safety.
For those who prefer a more conservative approach, it’s better to wait for a clearer breakout signal before entering the market.

Mainly long and auxiliary short, the strategy remains unchangedPowell's speech did not have much impact on the market, but silver, also a precious metal, has hit a record high, so we need to be alert to the potential rise in gold in the US market. Long trading remains the main theme. Pay attention to the resistance of 4065-4080 on the top and the support of 4045-4030 on the bottom. Conservative traders should wait for a pullback to go long.

xauusd According to the previous analysis, gold reached the target
And now, in case of correction between the areas of 3858 and 3871, we consider a suitable step for entry
And the next step of buying is also suitable in the area of 3825 with a stop loss of 3785
We are waiting for the news of the ADP

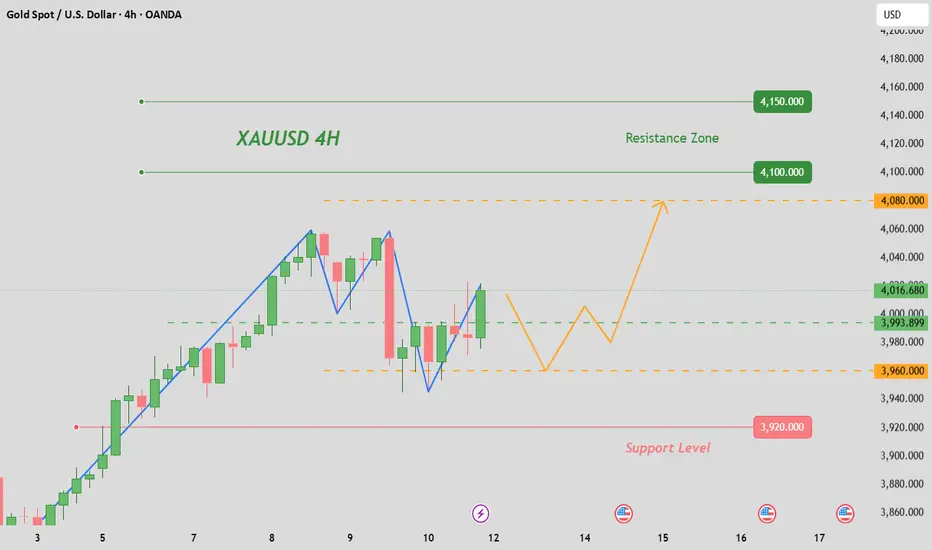
Gold Eyes New Highs Within Ascending ChannelAnalysis:
The XAU/USD 1-hour chart shows gold trading firmly within an ascending parallel channel, maintaining a clear pattern of higher highs and higher lows — a hallmark of sustained bullish momentum.
Currently, price action is consolidating near the mid-level of the channel, preparing for a potential breakout toward the upper boundary near $4,110–$4,120. The projected path (blue arrows) suggests a minor retracement or sideways move before buyers push prices higher again.
As long as gold remains above the lower channel support around $4,000–$3,990, the bullish outlook stays intact. A confirmed breakout above the upper boundary could open the door for a new leg upward, supported by ongoing momentum and strong market sentiment.
Key Levels:
Resistance: $4,110 – $4,120
Support: $3,990 – $4,000
Trend Bias: Bullish within ascending channel

Gold XAUUSD Breakout Setup | VWAP and Market Structure Explained📊 Gold (XAUUSD) Analysis
Gold remains in a bullish trend overall 💪. On the 30-minute timeframe, price is approaching a key level of resistance near the previous swing high.
📈 The VWAP bands show price pressing up toward the first deviation, suggesting momentum remains strong — but this is also where we often see short-term reactions.
💡 Trade idea:
If price can break above the previous high and the first VWAP deviation, then a retrace and retest of that level could offer a potential long opportunity for continuation 🏹.
However, if this setup fails to materialize and price rejects from the current zone, we abandon the long idea and wait for clearer confirmation.
⚠️ Disclaimer: This content is for educational purposes only and not financial advice.

Gold Price Outlook – Trade Setup (XAU/USD)📊 Technical Structure
OANDA:XAUUSD TVC:GOLD Gold (XAU/USD) remains firmly supported above the $4,000 psychological level, holding gains despite overbought conditions. The chart shows price respecting the ascending trendline support and consolidating near the mid-channel zone. Immediate resistance lies at $4,121 – $4,135, while the support base is aligned around $3,988 – $4,001. As long as the price maintains above the trendline, the bullish structure remains intact.
🎯 Trade Setup
Entry: $4,002 – $3,988 (buy on dips near support)
Stop Loss: $3,977
Take Profit 1: $4,121
Take Profit 2: $4,133
Risk-Reward (R:R): ~1 : 5.35
🌍 Macro Background
The US government shutdown continues into its ninth day, weighing on confidence in the US economy and weakening the Dollar. At the same time, the Federal Reserve’s dovish stance—with September’s rate cut already delivered and further cuts projected in October and December—reduces the opportunity cost of holding non-yielding Gold. This has fuelled demand for the safe-haven asset.
Meanwhile, Middle East risks have eased slightly after Israel and Hamas signed the first phase of the Trump peace plan, but broader uncertainty in global politics (US, EU fiscal tensions, Japan’s leadership changes) keeps safe-haven flows active. Thus, any dips are likely to attract strong buyers.
🔑 Key Technical Levels
Resistance: $4,121 / $4,133
Support: $4,002 / $3,988
📌 Trade Summary
Gold continues to ride strong bullish momentum, supported by dovish Fed expectations and political uncertainties. Buying near support levels remains favoured, with targets set at $4,121 and $4,135. Pullbacks should be seen as opportunities to rejoin the uptrend.
⚠️ Disclaimer
This analysis is for reference only and does not constitute trading advice. Trading involves significant risk, and proper risk management is essential.

10/8: Watch Resistance at 4050, Short First Then Go LongGood afternoon, everyone!
Driven by global economic and geopolitical uncertainties, as well as strong market expectations for further Fed rate cuts, gold has surged past the 4000 mark today, setting a new all-time high.
From a weekly perspective, the bullish momentum remains intact, and the uptrend still has room to extend. In the short term, some profit-taking and selling pressure after reaching new highs are normal technical corrections.
If the price climbs to the 4040–4050 range, pay close attention to the 4010 level as potential support during any pullback. If gold trades below 4030, the main support area can be referenced around 4000–3986.
Overall, the medium-term outlook remains bullish. For intraday trading, consider a buy-low, sell-high approach within the 4050–4011 or 4030–3992 range. However, if the price breaks above 4050 decisively, avoid chasing longs and instead look for potential short opportunities.

10/9: Sell Orders Above 4050 Profited, Watch Support Around 4000In yesterday’s session, we clearly indicated that if gold breaks above 4050, traders should look for short opportunities — and this move has indeed delivered impressive profits.
At present, the price is testing the 30-minute chart support area, though it is relatively weak. The key support zone lies on the 1-hour chart, around 4000–3990.
From a strategic perspective, if the rebound fails to break above 4038, it signals weakening bullish momentum. In this case, selling near the highs remains the preferred approach while monitoring support around 4011–4000. If the support holds, short-term buying opportunities may arise.
Be cautious when heavy selling pressure appears — close short-term positions promptly. Traders may choose to adopt a scalping approach for quick profits or consider a medium-term long position, though the latter requires stronger account capacity and risk tolerance.

ElDoradoFx PREMIUM 2.0 - (09/10/2025, Asia Session)Current Price: 4,041
Session Bias: Neutral-to-bullish (possible continuation if 4,031 holds)
Market Structure: Gold consolidating after major rally, forming a potential re-accumulation phase inside an ascending channel.
⸻
🕐 1️⃣ DAILY TIMEFRAME (D1)
• The daily candle closed bullish but with a long upper wick, showing rejection near 4,059.
• Structure remains firmly bullish, with price holding well above both EMAs:
• 20 EMA: 3,978
• 50 EMA: 3,867
• MACD still positive, histogram extended but flattening → momentum slowing.
• RSI at 78, signaling overbought conditions.
• Parabolic SAR remains below price → trend intact.
Summary:
The daily trend remains bullish, but a short-term consolidation or correction is likely before a new leg higher toward 4,070–4,090.
⸻
⏱ 2️⃣ H1 TIMEFRAME
• Gold is moving inside an ascending channel, currently holding mid-range.
• Support area between 4,033–4,018; resistance around 4,047–4,059.
• The latest candles show lower highs forming, signaling potential temporary compression before breakout.
• MACD histogram slightly negative, confirming minor correction mode.
• RSI at 54 → neutral, suggesting possible bounce from support if buyers defend structure.
• The 20 EMA (4,039) and 50 EMA (3,985) remain bullishly aligned → trend still intact.
Observation:
Asia could open with consolidation between 4,030–4,050 before a breakout. Bulls will likely defend the 4,033–4,018 zone for a re-entry attempt.
⸻
📉 3️⃣ M15 TIMEFRAME
• Price building a descending wedge structure — typically a bullish continuation pattern.
• Immediate support: 4,033–4,030
• Resistance: 4,047–4,051 (weak high)
• Fibonacci retracement from 3,984 → 4,059:
• 38.2% = 4,032
• 50% = 4,021
• 61.8% = 4,010
➤ Golden Zone = 4,032 – 4,010
• MACD histogram red but contracting — bears losing pressure.
• RSI at 47, near mid-level → awaiting a confirmed impulse.
Summary:
The wedge plus golden zone suggest a potential bullish rebound if Asia session liquidity sweeps below 4,030–4,018 and reclaims above 4,033.
⸻
⚡ 4️⃣ M5 TIMEFRAME (SCALPING STRUCTURE)
• Market is ranging 4,032–4,046, inside compression.
• Minor CHoCH and BOS signals visible between candles, confirming short-term equilibrium.
• MACD showing convergence → early sign of potential breakout build-up.
• RSI around 48 → balanced.
Scalping Areas:
• Buy scalp: from 4,033–4,028, confirmation candle close above 4,035, SL ≤ 60 pips.
• Sell scalp: only if clean break below 4,018, retest, and rejection candle appears.
⸻
✨ FIBONACCI GOLDEN ZONE (Current Swing: 3,984 → 4,059)
Retracement Level Price
38.2% 4,032
50% 4,021
61.8% 4,010
➡️ Golden Zone = 4,032 – 4,010 → Primary buy interest area if retested with bullish confirmation.
⸻
🚨 BREAKOUT & RETEST LEVELS TO WATCH
Direction Breakout Zone Retest Confirmation Target Zones
Bullish Above 4,051–4,059 Retest 4,047–4,050 4,066 → 4,072 → 4,085
Bearish Below 4,018–4,010 Retest 4,014–4,016 4,000 → 3,990 → 3,970
⸻
🧭 ASIA SESSION OUTLOOK
• Base Case (65% probability):
Gold remains in consolidation early Asia, possibly sweeping 4,030–4,018 (Golden Zone) before resuming upward movement to 4,060–4,072.
• Alternative (25% probability):
Extended sideways compression 4,030–4,050 until London.
• Low Probability (10%):
Strong bearish break below 4,010 leading to deeper correction 3,990–3,970.
⸻
✅ SUMMARY
Gold remains bullish overall, but currently accumulating near intraday support after rejection at 4,059.
Asia is expected to be range-bound with a bullish bias, focusing on:
• Buy interest zone: 4,032–4,010 (Golden Zone)
• Breakout confirmation: above 4,051 for 4,060–4,072 extension.
• Invalidation: below 4,010 structure.
Bias: 🟢 Bullish above 4,018
⚪ Neutral 4,018–4,010
🔴 Bearish below 4,010
⸻
🥇 ElDoradoFx PREMIUM 2.0 – PERFORMANCE 08/10/2025 📱
📊 DAILY MARKET RESULTS
✅ SELL +60 pips
✅ BUY +20 pips
✅ BUY +40 pips
💸 BTC/USD +1,700 pips
✅ SELL +110 pips
✅ BUY +20 pips
❌ SELL –40 pips (SL)
✅ BUY +210 pips
❌ SELL –40 pips (SL)
✅ BUY LIMIT +40 pips
---
🏆 GOLD TOTAL PIPS WON: +420 pips
📱 BTC/USD TOTAL: +1,700 pips
📈 COMBINED GAIN: +2,120 pips
📊 RESULT: 10 Signals → 8 Wins | 2 SL
🎯 ACCURACY: 80 %
---
🔥 Solid day of profits with powerful BTC moves and consistent gold trades!
Another step toward closing the week in style 💪📈
👏 Congratulations if you profited ✅✅✅🚀🚀🚀

Gold: Reach a new highGold has successfully stood firm above the key psychological level of 4000, continuing its rally to reach an all-time high. From the perspective of capital flows, although specific position data is lacking, the price-volume surge following the breakthrough,evidenced by both New York Gold and London Gold recording "rising prices with increasing trading volume" that confirms the continuous inflow of safe-haven funds. Additionally, the seasonal upward momentum of gold in October has not yet faded, and the momentum-driven uptrend continues, further strengthening the confidence of bullish investors.
The 4000-4050 range has been effectively broken through, and this former resistance level has now transformed into a short-term support level. If gold can maintain a stable position above 4050 in the subsequent sessions, the next target range can be set at 4100-4150. For short-term support, focus on the key psychological level of 4000; a breakdown below this level may trigger a pullback to the 3950-3980 range.
Buy 4010 - 4020 TP 4030 - 4040 - 4050 SL 4000
Daily-updated accurate signals are at your disposal. If you run into any problems while trading, these signals serve as a reliable reference—don’t hesitate to use them! I truly hope they bring you significant assistance

4050-4030 oscillation, bullish trend remains the main trendGold is currently still in a bullish upward trend. Our core trading strategy remains unchanged, and the key points I reminded you of earlier this morning must be carefully considered. Judging from the trend, gold in the US market is basically oscillating back and forth in the range of 4050-4030. I mentioned before that gold has repeatedly tested 4030. Once it falls below, gold may test the support range of 4020-4010 below in the US market. This has been marked in the chart. I believe brothers can see it very clearly. At the same time, we should still take precautions on the upside. As time goes by, we can pay moderate attention to the short-term channel pressure around 4065. Once gold stabilizes above 4050, it will definitely touch around 4065. On the downside, we continue to monitor a break of 4030. If, while waiting for gold to fall back to the support range, it first rises and hits the channel resistance, you can retest gold shorts based on market trends. If you have any questions, you can leave me a message for help. If you think Allen's analysis is helpful to you, you can give it some encouragement by clicking the like button.

ElDoradoFx PREMIUM 2.0 – US FORECAST (08/10/2025)Session Bias: Bullish continuation with controlled pullback probability
Market Structure: Still within ascending channel; bulls defending structure after rejection at 4,049
⸻
🕐 1️⃣ DAILY TIMEFRAME (D1)
• Gold continues its aggressive uptrend, with another bullish daily candle extending from 3,983 to 4,049.
• Price remains above 20 EMA (3,975) and 50 EMA (3,867) → strong bullish trend confirmation.
• RSI at 79 → extremely overbought, suggesting limited room before a short-term correction.
• MACD histogram still expanding positively, showing momentum remains active despite exhaustion risk.
• Parabolic SAR stays below price → trend intact.
Summary:
Gold is overextended but structurally bullish. As long as daily candle holds above 4,000, buyers remain in control aiming for 4,060–4,078.
⸻
⏱ 2️⃣ H1 TIMEFRAME
• Gold hit 4,049 (Weak High) and is now consolidating around 4,040–4,043, holding above short-term structure support at 4,031.
• Price remains above 20 EMA (4,031) and 50 EMA (3,984) — EMAs sharply aligned upward.
• MACD: histogram showing fading bullish momentum, though still above zero → healthy pullback possible.
• RSI (70) hovering near overbought → suggests cooling off before potential continuation.
• Channel Structure: price rejected top trendline (red), possibly retracing toward midline support 4,031–4,020.
Observation:
If 4,031–4,020 holds, we may see a continuation leg toward 4,060–4,078.
A break below 4,018 would shift short-term momentum bearish toward 4,004.
⸻
📉 3️⃣ M15 TIMEFRAME
• The intraday structure remains bullish; however, candles are printing smaller bodies → indicating exhaustion.
• Fibonacci retracement from 3,984 → 4,049:
• 38.2% = 4,024
• 50% = 4,017
• 61.8% = 4,010
→ forming a Golden Zone (4,024–4,010) — ideal pullback area for re-entry if the bullish trend resumes.
• MACD showing a flattening histogram → potential retrace before next impulse.
• RSI at 61 → mid-range, ready for either a dip or rebound depending on 4,031 support reaction.
Summary:
A healthy retracement toward 4,024–4,010 is expected. As long as the golden zone holds, trend continuation remains the main scenario.
⸻
⚡ 4️⃣ M5 TIMEFRAME (SCALPING VIEW)
• Price formed a minor double top at 4,049 and retraced to 4,033, currently ranging between 4,030–4,044.
• 20 EMA starting to flatten, while 50 EMA remains below → short-term correction developing.
• MACD histogram in red but narrowing → bears weakening as we approach support.
• RSI 48 → neutral, suggesting accumulation zone forming for next move.
Scalping Summary:
• Buy scalp zone: 4,031–4,024 (confirmation required)
• Sell scalp zone: below 4,018 (breakout and retest) → potential drop to 4,004–3,992
⸻
✨ FIBONACCI GOLDEN ZONE (Current Swing: 3,984 → 4,049)
Retracement Level Price
38.2% 4,024
50% 4,017
61.8% 4,010
Golden Zone = 4,024 – 4,010 → key support & re-entry area.
⸻
🚨 BREAKOUT LEVELS TO WATCH
Direction Breakout Zone Retest Confirmation Target Zones
Bullish Above 4,049–4,050 Retest 4,045–4,047 4,060 → 4,072 → 4,085
Bearish Below 4,018–4,010 Retest 4,015–4,012 4,004 → 3,992 → 3,970
⸻
📊 INDICATORS SUMMARY
Indicator Reading Bias
RSI (H1) 70 (Overbought) ⚠ Cooling phase
MACD (H1) Positive, flattening ✅ Still bullish
EMAs (20/50) Rising, wide gap ✅ Trend intact
Volume Normalizing ⚠ Pre-news pause
Parabolic SAR Below price ✅ Trend supportive
⸻
🧭 SESSION OUTLOOK (US SESSION)
• Base Case (60% probability):
Controlled pullback toward 4,024–4,010 (Golden Zone) before continuation to 4,060–4,078.
• Alternative (30% probability):
Extended range between 4,030–4,049 with sideways consolidation.
• Low Probability (10%):
Breakdown below 4,010 → deeper correction to 3,990–3,970.
⸻
✅ SUMMARY
Gold remains bullish overall, but short-term momentum is softening after reaching 4,049 resistance.
A pullback into 4,024–4,010 (Golden Zone) is the ideal setup for bullish continuation.
As long as price holds above 4,018, trend bias stays upward;
only a confirmed breakdown below 4,010 would signal short-term bearish correction.
Bias: 🟢 Bullish above 4,018
⚪ Neutral 4,018–4,010
🔴 Bearish below 4,010
⸻

Gold Analysis (XAUUSD) | 1H Timeframe
🔹 Current Status: Gold is aggressively breaking new highs and showing strong bullish moves. This suggests that we might be experiencing the best year for gold in several decades.
🔹 Scenario 1: If the price reaches 3,840 and 3,860 levels, there’s a possibility of a pullback to lower green areas (around 3,700 or 3,680). These green zones can be ideal for entering long positions with lower risk.
🔹 Scenario 2: If the price swiftly breaks through the higher levels and moves further up, it might indicate the continuation of the bullish trend. In this case, look for long positions on lower timeframes (such as 5 minutes) with confirmation from candlestick patterns and price action.
🔹 Key Points:
The price is breaking new highs and continuing the bullish trend.
Look for long positions in lower timeframes in the green zones for confirmation.
Enter long near 3,700 and 3,680 with low risk.

ElDoradoFx PREMIUM 2.0 – LONDON FORECAST (08/10/2025)Current Price: 4,035
Session Bias: Bullish with short-term correction potential
Market Structure: Continuation within ascending channel — bulls still dominant, but slowing momentum after reaching 4,037
⸻
🕐 1️⃣ DAILY TIMEFRAME (D1)
• Gold continues its parabolic rise, forming consecutive bullish candles since 3,940 breakout.
• Price reached 4,037, the highest level since August 2020 equivalent, before consolidating.
• 20 EMA (3,971) and 50 EMA (3,867) both trending sharply upward → strong trend momentum.
• RSI at 78, showing overbought territory → potential short-term pullback.
• Parabolic SAR below price → trend intact.
Summary:
Uptrend fully intact. A pullback toward 3,990–3,970 is possible before continuation toward 4,050+.
⸻
⏱ 2️⃣ H1 TIMEFRAME
• Price trading within an ascending channel; current range 4,015–4,037.
• Higher highs and higher lows still forming — structure unbroken.
• 20 EMA = 4,018 / 50 EMA = 3,984 → clear bullish separation.
• MACD shows fading histogram but above zero line → losing momentum, not reversal.
• RSI 65 → cooling from overbought zone.
• Volume decreasing → Asian range likely transitioning into London volatility.
Key Observation:
A retest of 4,018–4,015 (previous BOS area) may serve as next buy opportunity.
⸻
📉 3️⃣ M15 TIMEFRAME
• Recent swing high at 4,037, followed by minor pullback to 4,020–4,024 support zone.
• EMA confluence and previous CHoCH confirm bullish structure remains.
• Fibonacci retracement from 3,984 → 4,037 gives:
• 38.2% = 4,017
• 50% = 4,010
• 61.8% = 4,004
→ This forms the Golden Zone (4,017–4,004) — ideal for long re-entries.
• MACD histogram returning to equilibrium → preparing for next leg.
• RSI 55 → neutral, confirming potential continuation.
Summary:
Watch for retest of 4,017–4,004 → key support zone to reload longs before any breakout attempt above 4,037.
⸻
⚡ 4️⃣ M5 TIMEFRAME (SCALPING STRUCTURE)
• Price rejected 4,037, retracing toward 4,024–4,020 with MACD histogram turning red.
• Short-term bearish divergence seen on RSI but minimal strength.
• As long as price holds above 4,018, buyers remain in control.
• If 4,018 breaks, next liquidity zone lies at 4,010–4,005 (Golden Zone base).
Scalping Summary:
• Aggressive scalpers can look for buy scalps between 4,018–4,010 with 60-pip risk window.
• Short-term exhaustion likely followed by bullish continuation.
⸻
✨ FIBONACCI GOLDEN ZONE (CURRENT MOVE: 3,984 → 4,037)
Retracement Level Price
38.2% 4,017
50% 4,010
61.8% 4,004
Golden Zone = 4,017 – 4,004 → Key intraday buy area.
⸻
🚨 BREAKOUT LEVELS TO WATCH
Direction Breakout Zone Retest Confirmation Target Zones
Bullish Above 4,037–4,040 Retest 4,033–4,035 4,050 → 4,060 → 4,078
Bearish Below 4,018–4,010 Retest 4,015 4,004 → 3,990 → 3,970
⸻
🧭 SESSION OUTLOOK
• Base Case (60% probability):
Minor pullback to 4,018–4,010 (Golden Zone) followed by bullish continuation toward 4,037–4,050.
• Alternative (30% probability):
Range between 4,020–4,037 before breakout continuation in New York session.
• Low Probability (10%):
Drop below 4,004 leading to correction into 3,990–3,970.
⸻
✅ SUMMARY
Gold remains in a strong uptrend, consolidating near the top of its ascending channel.
A healthy pullback toward 4,018–4,010 (Golden Zone) could offer fresh bullish continuation opportunities.
Momentum is softening but trend structure remains intact.
Only a clean break below 4,004 would indicate deeper correction risk.
Bias: 🟢 Bullish above 4,010
⚪ Neutral between 4,010–4,004
🔴 Bearish only below 4,004
⸻
🥇 ElDoradoFx PREMIUM 2.0 – PERFORMANCE 07/10/2025 💸
📊 MARKET RECAP
✅ BUY +20 pips
✅ BUY +20 pips
✅ SELL +110 pips
✅ SELL +60 pips
✅ BUY LIMIT +210 pips
🔽 SELL – BE
✅ BUY +40 pips
✅ BUY +20 pips
💸 BTC/USD BUY +800 pips
---
🏆 GOLD TOTAL PIPS WON: +480 pips
💰 BTC/USD TOTAL: +800 pips
📈 COMBINED GAIN: +1,280 pips
📊 RESULT: 9 Signals → 8 Wins | 1 BE
🎯 ACCURACY: 89 %
---
🔥 Another strong performance across Gold & BTC!
Precision entries, layered accuracy, and massive profits 🚀
👏 Congratulations if you profited ✅✅✅🚀🚀🚀

XAU/USD Bullish Setup Toward 4115XAU/USD is trading around 4038, holding bullish momentum with support near 4032. Price targets are set at 4060 and 4087, with potential to reach a new ATH at 4115 if buyers maintain strength.

Gold Price Analysis – Gold Retracement Setup $3,955 TargetGold remains in a bullish structure, holding above the ascending trendline. Price has recently faced rejection near $3,956, which marks the weekly high, and a short pullback is expected before the next leg up. The ideal buy zone lies between $3,905–$3,890, aligning with previous structure support and the trendline base. A bullish reaction from this zone could push price toward $3,956, and if momentum continues, an extended move toward $3,990 is possible. The stop-loss should be placed below $3,885 to protect against false breaks, keeping the bias bullish as long as price stays above $3,890.
Note
Please risk management in trading is a Key so use your money accordingly. If you like the idea then please like and boost. Thank you and Good Luck!
