Gold Price Analysis – Gold Retracement Setup $3,955 TargetGold remains in a bullish structure, holding above the ascending trendline. Price has recently faced rejection near $3,956, which marks the weekly high, and a short pullback is expected before the next leg up. The ideal buy zone lies between $3,905–$3,890, aligning with previous structure support and the trendline base. A bullish reaction from this zone could push price toward $3,956, and if momentum continues, an extended move toward $3,990 is possible. The stop-loss should be placed below $3,885 to protect against false breaks, keeping the bias bullish as long as price stays above $3,890.
Note
Please risk management in trading is a Key so use your money accordingly. If you like the idea then please like and boost. Thank you and Good Luck!
Xauusdbuy

XAUUSD – PRICE ABOVE $4000: TRULY INSANE FOR TRADERSXAUUSD – PRICE ABOVE $4000: TRULY INSANE FOR TRADERS
Gold has officially surpassed the $4000 mark, marking one of the most robust rallies in recent history.
Let's take a look at key price zones and short-term opportunities 👇
🔻 SELL Scenario
SELL 4025–4027 → SL 4033 → TP 4015 – 4000 – 3980
SELL 4042–4044 → SL 4049 → TP 4030 – 4015 – 4000 – 3980
🟩 BUY Scenario
BUY 3993–3995 → SL 3988 → TP 4005 – 4013 – 4023 – 4040
BUY 3980–3983 → SL 3975 → TP 3998 – 4005 – 4013 – 4023 – 4040
📈 Technical Analysis
The medium-term uptrend channel continues to be maintained steadily.
Rising lows indicate that buying pressure remains very strong.
The nearest psychological resistance is around the 4043 area, coinciding with the Fibonacci extension.
The expected buying zone is at the POC Volume Profile area — a high liquidity zone, previously where many traders expected gold prices to be rejected, but now could become a strong demand area.
🧭 Macro Perspective
If the Federal Reserve (Fed) continues to cut interest rates, the market could aim for the next milestone – 5000 USD/ounce.
Although short-term fluctuations may occur (such as temporary ceasefires in the Middle East or Ukraine), the core drivers of this trend remain unchanged:
US public debt is increasing
Central banks are diversifying foreign exchange reserves
The USD is weakening
All support the medium-term uptrend of gold.
⚡️Summary
Gold remains in a solid bullish structure, even as it approaches overbought territory.
There may be strong corrections, but as long as the uptrend structure is maintained, buyers remain in control.

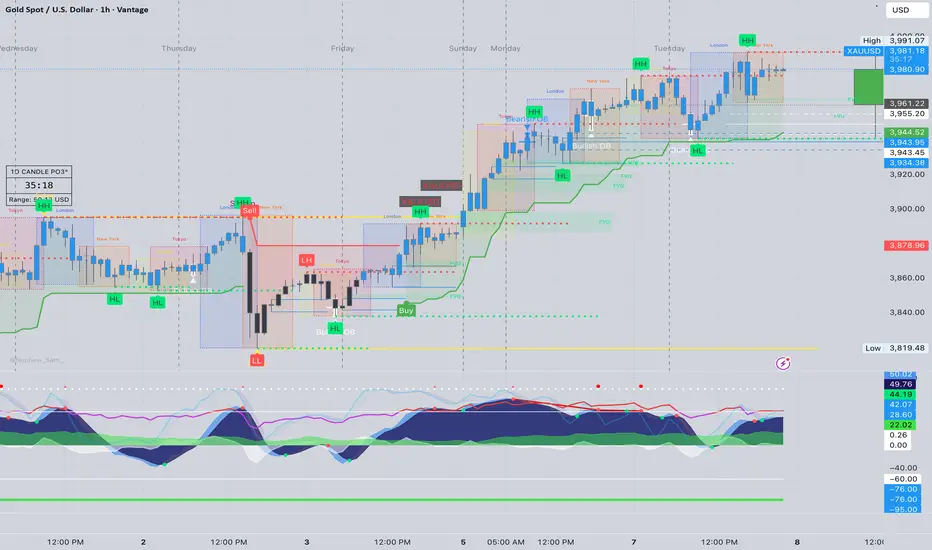
XAU/USD – 1H Bullish Playbook🪙 XAU/USD – 1H Bullish Playbook
🗓️ October 8, 2025
Gold continues to respect bullish structure after a clean sweep of internal liquidity and is now trading within a Bullish Fair Value Gap (FVG) on the 1H timeframe. Price action suggests potential continuation toward upside liquidity.
🔍 Current Price: $3,990.18
📍 Key Levels:
🔼 BSL (Buy Side Liquidity): $3,991.07
📉 1H FVG Support Zone: Just below current price
🟥 Sell Side Liquidity Levels (SSLs):
$3,983.31
$3,978.61
$3,974.23
🧱 30M Demand Support Zone: $3,947.13 – $3,941.18
⚪ 1H Bullish Structure Confirmed
📊 Bias: Bullish Continuation – Expecting price to hold above FVG and internal SSLs for a move into the BSL and beyond.
✅ Ideal Scenario:
Price retraces into the 1H FVG or lower SSLs, finds support, and continues higher.
🔁 Plan: Watch for bullish confirmations in the FVG or 30M support zone before re-entry or add-ons.
🚫 Invalidation: Clean break below $3,941.18 (30M demand zone)
💡 Smart Money Insight: With internal sell stops swept and a clean FVG formed on the rally, this could be the fuel needed to take out buy stops above $3,991.07.
Greetings,
MrYounity

ElDoradoFx PREMIUM 2.0 – ASIAN FORECAST (08/10/2025)Gold closed the US session around 3,981, consolidating within a narrow range after a strong impulsive move from 3,946 → 3,991.
The pair continues to show bullish structure on all major timeframes, but with signs of momentum fatigue at current highs.
Asian session likely to provide either a minor correction or accumulation phase before next directional move during London.
⸻
📊 1️⃣ DAILY TIMEFRAME (D1)
• Structure: Strong bullish continuation since breaking out above 3,866 (last week’s BOS).
• EMAs: Price trading well above the 20 EMA (3,918) and 50 EMA (3,837) → showing strong trend control by buyers.
• RSI: 77 → overbought, risk of a short-term correction before further upside.
• Parabolic SAR: Still below price, confirming uptrend intact.
• Immediate resistance: 3,991–4,000 (psychological zone)
• Key support: 3,918–3,914
🔹 Bias: Trend remains bullish, but watch for exhaustion near 4,000. A corrective pullback toward 3,965–3,940 would be healthy for continuation.
⸻
📉 2️⃣ 1H TIMEFRAME (H1)
• Price trading in a rising channel, currently at upper boundary (~3,981).
• Previous BOS confirmed at 3,965, turning that area into dynamic support.
• EMAs 20/50 (3,970–3,961) acting as intraday support band.
• MACD histogram slightly fading → momentum cooling, but still positive.
• RSI 64 → neutral, providing space for another push higher if buyers defend supports.
• Structure forming potential ascending triangle → breakout may target 3,991 → 4,000 zone.
🔹 Bias: Bullish above 3,961, neutral between 3,961–3,946, bearish only below 3,946.
⸻
⏱ 3️⃣ 15M TIMEFRAME (M15)
• Clear liquidity sweep below 3,961 earlier, followed by a Change of Character (CHoCH) to bullish.
• Price forming higher lows, consolidating between 3,977–3,982 → tight compression before breakout.
• MACD recovering from minor bearish phase, RSI 58 → modest bullish pressure.
• EMAs crossing upward again, aligning with structure support at 3,973–3,970.
🔹 Expect accumulation within 3,973–3,982 before breakout confirmation.
⸻
📈 4️⃣ 5M TIMEFRAME (M5 – Scalping Focus)
• Micro-structure: short-term consolidation with support at 3,970 and resistance at 3,983.
• Momentum: MACD showing flattening histogram, RSI neutral (~52) → potential low-volume Asian range.
• EMAs flatlining → ideal setup for scalpers awaiting breakout or pullback to golden zone.
⸻
✨ FIBONACCI GOLDEN ZONE (SHORT-TERM)
Measured from 3,946 (swing low) → 3,991 (swing high):
• 38.2% = 3,974
• 50% = 3,968
• 61.8% = 3,962
🔸 This forms the Golden Zone = 3,974–3,962 — high-probability buy reaction area if tested.
Aligns with trendline + EMA support, increasing confluence.
⸻
🚨 BREAKOUT LEVELS TO WATCH
Direction Breakout Zone Retest Confirmation Target Zones
Bullish Above 3,983–3,985 Retest 3,980–3,982 3,991 → 4,000 → 4,015
Bearish Below 3,961–3,958 Retest 3,962–3,965 3,946 → 3,940 → 3,927
⸻
🧭 ASIAN SESSION OUTLOOK
• Base Case (60% probability):
Sideways-to-slightly bullish consolidation above 3,970 ahead of London volatility.
Price likely to respect Golden Zone (3,974–3,962) before continuation.
• Alternative (30% probability):
Brief dip into 3,958–3,946 liquidity pocket before strong bounce upward.
• Low Probability (10%):
Sustained bearish breakdown below 3,946, invalidating intraday uptrend.
⸻
📊 SUMMARY
• Gold remains in a strong bullish uptrend, consolidating near the top of the channel.
• 3,974–3,962 (Golden Zone) remains key area for buyers to defend.
• Breakout above 3,985 will confirm continuation toward 4,000–4,015.
• Only a confirmed drop below 3,946 shifts structure bearish short term.
Bias for Asian Session:
🟢 Bullish above 3,962
⚪ Neutral between 3,962–3,946
🔴 Bearish below 3,946
⸻
🟡 Conclusion:
Expect calm range trading during Asia with bullish continuation probability if 3,970–3,962 holds.
Aggressive moves likely resume in London session.
Overall structure and indicators favor dip accumulation rather than shorting.
⸻
GOLD (XAU/USD) TECHNICAL ANALYSIS — BUY SETUP FROM SUPPORT ZONEPair: Gold (XAU/USD)
Timeframe: 1H
Current Price: 3985.23
Trend: Bullish channel (ascending)
📊 Chart Structure Analysis
Ascending Channel:
Gold has been moving in a well-defined upward channel (highlighted in pink).
The price recently touched the upper boundary, suggesting a possible short-term pullback.
Support Zone (Blue Area):
Around 3870–3880, identified as the support level.
This area has confluence with the midline of the channel, making it a potential buy zone.
Entry Point:
Marked at 3871.28 — ideally at or slightly above the support region after a pullback.
Stop Loss:
3857.81, just below the support zone.
This protects against a channel breakdown.
Target Point:
4017–4018, which aligns with the upper resistance or projected extension of the bullish channel.
This gives a reward-to-risk ratio > 3:1, which is favorable.
🔍 Price Action Expectation
Price is expected to retest the blue support zone (possibly after a minor drop).
If it holds, a bounce upward toward 4017–4020 is anticipated.
A break below 3857 would invalidate the bullish setup and open the path to 3820 or lower.
✅ Summary
Parameter Level (USD) Notes
Entry 3,871 Near support
Stop Loss 3,857 Below structure
Target 4,018 Channel resistance
Bias Bullish Buy from dips
RR Ratio ~3.3:1 Good reward setup

ANFIBO | XAUUSD - Fibo 2.618 at $4000 is coming soon [10.7.2025]Hi traders, Anfibo is here!
XAUUSD Analysis – Daily Trading Plan
Overall Picture:
It appears that gold OANDA:XAUUSD is moving exactly according to the two projected waves outlined in yesterday’s plan. The market continues to demonstrate strong bullish momentum, steadily seeking new all-time highs .
The current uptrend shows no significant signs of weakening, with safe-haven demand still dominating price action. However, the $4,000/oz level remains a key psychological resistance, which also aligns with the Monthly Fibonacci extension target. As price approaches this zone, a technical correction or profit-taking phase is highly likely to occur.
The degree of this potential correction will depend heavily on macroeconomic data and geopolitical developments, so it’s essential to closely monitor and reassess the market as new information unfolds.
Technical Outlook:
Primary Trend: Strong bullish momentum on both Daily and Monthly timeframes.
> SUPPORT KEY / BUY ZONES : 3942 - 3926 - 3909 - 3900 - 3890
> RESISTANCE KEY / SELL ZONES : 3970 - 3975 - 3984 - 3999
Trading Plan for Today:
>>> SELL ZONE:
ENTRY: 3995 - 4005
SL: 4010
TP: 3900 - 3800 - ...
>>> BUY ZONE:
ENTRY: 3885 - 3900
SL: 3880
TP: 3940 - 3970 - 3995 - ...
Risk Management:
- Maintain a minimum Risk:Reward ratio of 1:2.
- Manage position sizing carefully; avoid overtrading at psychological highs.
- Monitor U.S. economic data and geopolitical news closely, as these could act as catalysts for corrective moves.
Conclusion:
Gold continues to follow the planned technical path, reaffirming the strength of its bullish structure. The $4,000/oz zone will serve as a key psychological milestone — a level where temporary corrections or consolidations are likely before another potential leg higher.
For now, the strategy remains clear: prioritize the bullish side, and closely observe price reactions around $4,000 to adjust accordingly. In this market, “following the trend” remains the wisest approach.
GOODLUCK GUYS!

Gold Price Analysis – Bullish Above $3910Gold price is currently showing a mild correction after testing the upper trendline of the ascending channel. The chart suggests a possible short-term pullback toward the $3925–$3913 zone, which aligns with the 0.382–0.618 Fibonacci retracement levels. As long as price holds above $3910, the bullish structure remains intact, and a rebound toward $3976 and possibly $4016 can be expected. A break below $3900 would weaken bullish momentum and could extend the decline toward $3875 support.
Support: $3925 / $3910 / $3875
Resistance: $3976 / $4016
Bias: Bullish above $3910; correction possible before next leg up.
Note
Please risk management in trading is a Key so use your money accordingly. If you like the idea then please like and boost. Thank you and Good Luck!

ElDoradoFx PREMIUM 2.0 – US FORECAST (07/10/2025)
Gold is trading around 3,971, showing renewed bullish strength into the early US session after rejecting the 3,955–3,946 demand zone during London.
The market continues its primary uptrend, though price is now retesting the previous supply zone 3,972–3,977, where bulls previously lost momentum.
Momentum indicators confirm intraday buying pressure but highlight overextension — signaling a possible reaction or rejection before any continuation.
⸻
🔍 Technical Outlook
Daily Chart (D1):
• Strong bullish trend remains dominant, with price far above 20 EMA (3,914) and 50 EMA (3,837).
• RSI (78) → extremely overbought, suggesting the market is nearing exhaustion.
• Parabolic SAR remains below price, confirming bullish structure; however, a close below 3,950 would trigger a correction signal.
• Upside targets remain 3,985 – 4,000, but limited unless US dollar weakens sharply.
1H Chart (H1):
• Structure remains bullish after a BOS (Break of Structure) above 3,965.
• Price is forming higher lows and higher highs; however, current candle shows signs of rejection at 3,972–3,977 (supply zone).
• RSI ~63 → moderate bullish momentum.
• MACD turning positive again with histogram expanding — buyers remain in control.
• 20 EMA (3,961) and 50 EMA (3,949) → immediate support levels to monitor.
15M Chart (M15):
• Strong bullish leg formed after a double-bottom at 3,946 with a confirmed CHoCH (Change of Character).
• Price now testing Fibonacci resistance and supply area 3,972–3,977.
• RSI at 70+ → overbought short term.
• MACD positive but showing early signs of slowing momentum — a retest to 3,965 before continuation is likely.
5M Chart (M5):
• Short-term bullish channel intact.
• MACD histogram remains green, RSI above 65 → intraday bullish continuation bias.
• Possible minor retracement toward 3,964–3,961 for liquidity grab before continuation.
• No bearish divergence yet; structure favors intraday buys on pullbacks.
⸻
✨ Fibonacci Golden Zone
Drawn from 3,946 swing low → 3,977 swing high:
• 38.2% → 3,965
• 50% → 3,962
• 61.8% → 3,958
➡ The Golden Zone (3,965–3,958) aligns with strong EMAs and intraday trendline confluence.
A bounce from this zone would offer high-probability bullish setups for continuation toward 3,977 → 3,985 → 3,990.
⸻
🎯 High Probability Entries
Scalping Setups (M5–M15, ≤60 pips SL):
• Buy Setup #1: Buy at 3,965–3,958 (Golden Zone) after rejection or engulfing candle.
🎯 Targets → 3,972 → 3,977 → 3,985
🛑 SL below 3,952 (60 pips)
• Buy Setup #2: Buy above 3,977 breakout & retest.
🎯 Targets → 3,985 → 3,995 → 4,000
🛑 SL below 3,972 (50–60 pips)
• Sell Setup: Only valid if rejection occurs at 3,977–3,985 zone with bearish engulfing confirmation.
🎯 Targets → 3,965 → 3,958 → 3,946
🛑 SL above 3,985 (60 pips)
⸻
📅 Fundamental Outlook – US Session
• Today’s main catalyst: Fed Chair Powell’s remarks (late session).
• US Dollar Index (DXY) trading around 104.90, stable but showing slight weakness — supportive for gold.
• US Treasury yields are softening, which typically fuels gold demand.
• No major data releases, so market likely to follow technical structure unless Powell’s tone shifts sentiment.
Sentiment: Cautiously bullish — intraday momentum favors dips for continuation, but rejection near 3,977 must be watched closely.
⸻
⚠ Key Levels to Watch
Resistance: 3,972 – 3,977 / 3,985 / 3,995 – 4,000
Support: 3,965 / 3,958 – 3,952 / 3,946 – 3,940
⸻
✅ Summary
Gold maintains bullish momentum above 3,965 but enters a critical resistance zone (3,972–3,977).
The Golden Zone (3,965–3,958) remains the best area to seek new longs on dips.
Only a confirmed breakout above 3,977 opens the path to 3,985–4,000,
while rejection here could trigger short-term pullback to 3,958–3,946 before any continuation.
Bias for US session:
➡ Bullish above 3,958
⚠ Bearish only if 3,946 breaks with strong volume
— ElDoradoFx PREMIUM 2.0 – Deep Analysis Team

GOLD Best Places To Buy And Sell Cleared , 500 Pips Waiting !Here is m y opinion on GOLD On 30 Mins T.F , We have a Huge movement To Upside since Last 6 weeks , started between 3870.00 to 3980.00 so we can buy and sell Gold This Week from 2 areas , 3940.00 will be the best place for Buy and 3975.00 will be the best place for Sell , now the price very near buy area so we can wait the price to retest the support area and then enter a buy trade and targeting 3975.00 and when the price touch it and give us a good bearish P.A , we can enter a sell trade and targeting 3940.00 , It`s All Depend On Price action . I`m Sure that the main direction now is buy so i`m interesting to buy gold from 3940.00 but the best place for me will be 3895.00 cuz the price didn`t retest it until now and you can check my analysis about 3895.00 , so my res area it should be a scalping trade but my main focus will be on buy gold until end of the year .
Entry Reasons :
1- Highest Level The Price Touch It
2- Broken Res
3- New Support Created .
4- Clear Price Action .
5- Clear Support & Res .

ElDoradoFx PREMIUM 2.0 – LONDON FORECAST (07/10/2025)Gold (XAUUSD) is trading around 3,955, retracing slightly after reaching 3,977, its highest level since early summer.
The metal remains in a strong bullish trend, but momentum indicators suggest temporary exhaustion as price retests the key intraday support zone around 3,952–3,946.
London session opens with early downside pressure and potential short-term retracement before buyers attempt to re-enter.
⸻
🔍 Technical Outlook
Daily Chart (D1):
• Bullish structure remains intact; price is well above both 20 EMA (3,909) and 50 EMA (3,837).
• RSI at 78 indicates overbought territory, suggesting limited upside without a pullback.
• Parabolic SAR remains below price, confirming overall bullish bias.
• A daily close below 3,938 would indicate cooling momentum; otherwise, the trend remains long-biased.
1H Chart (H1):
• Clear ascending channel structure; price recently rejected from the upper boundary near 3,977.
• 20 EMA (3,956) and 50 EMA (3,946) provide immediate dynamic support.
• MACD shows weakening histogram and potential bearish cross; RSI declining from 73 → 59, confirming short-term exhaustion.
• A clean break below 3,946 could extend correction toward 3,927–3,918 liquidity zone.
15M Chart (M15):
• Short-term BOS (Break of Structure) occurred below 3,960, confirming minor bearish shift.
• Price currently testing 200 EMA (3,955) with a possible retest of 3,946 support.
• RSI hovering near 48, neutral but leaning bearish.
• MACD below zero line — momentum currently favors intraday sellers unless 3,962 is reclaimed.
5M Chart (M5):
• Price is bouncing around the lower intraday trendline, showing weak attempts by bulls to defend 3,954–3,952.
• MACD negative; histogram red but flattening.
• RSI near 35–40, indicating possible short-term relief bounce but no reversal confirmation yet.
⸻
✨ Fibonacci Golden Zone (Intraday Focus)
Measured from 3,927 swing low → 3,977 swing high
• 38.2% Fib: 3,958
• 50% Fib: 3,952
• 61.8% Fib: 3,946
➡ The Fibonacci Golden Zone = 3,958–3,946, aligning perfectly with today’s intraday support area.
If bulls hold this zone, London could see a buy reaction toward 3,965–3,972, otherwise break below 3,946 confirms deeper pullback to 3,927–3,918.
⸻
🎯 High Probability Entries
Scalping (M5–M15, ≤60 pips SL):
• Buy Setup: If bullish confirmation appears within 3,952–3,946 (Golden Zone).
🎯 Targets → 3,965 → 3,972 → 3,977
🛑 SL below 3,940 (≈55 pips)
• Sell Setup: If price breaks and retests below 3,946.
🎯 Targets → 3,935 → 3,927 → 3,918
🛑 SL above 3,955 (≈60 pips)
Intraday/Swing Opportunities (H1):
• Buy: Only after rejection or engulfing confirmation from 3,946–3,952 with targets 3,972–3,985.
• Sell: If hourly candle closes below 3,940, target 3,925–3,902.
⸻
📅 Fundamental Outlook – London Session
• No major UK or EU economic releases this morning.
• Focus on US Fed speakers and ISM Services PMI revisions later in the day.
• DXY is hovering near 105.00, showing minor strength which could limit gold’s upside temporarily.
• Treasury yields remain steady, keeping volatility moderate until the NY session.
Overall sentiment: Neutral-to-slightly bearish in early London, with buying interest expected lower near the Fibonacci zone.
⸻
⚠ Key Levels to Watch
Resistance: 3,962 – 3,972 / 3,977 / 3,985
Support: 3,958 / 3,952 – 3,946 / 3,927 – 3,918
⸻
✅ Summary
Gold remains in a strong bullish trend, but London opens with short-term profit-taking.
The Fibonacci Golden Zone (3,958–3,946) is key — holding this area will likely trigger a bullish rebound toward 3,972–3,977,
while a decisive break below 3,946 could accelerate a correction to 3,927–3,918 before any new rally forms.
Bias for London session: Buy dips if 3,946 holds, cautious sells if 3,940 breaks.

ANFIBO | XAUUSD Weekly Plan [10.6 - 10.10.2025]Hi traders, Anfibo is here!
XAUUSD Analysis – Daily Trading Plan
Overall Picture:
Gold’s bullish trend remains extremely clear, reflecting the market’s strong confidence in this safe-haven asset amid ongoing global economic and geopolitical uncertainties. The continuous series of new ATHs highlights that buyers are firmly in control of the market.
However, from a technical perspective, the $4,000/oz level stands out as a significant psychological round-number resistance. This zone also coincides with the Monthly Fibonacci extension target, making it highly likely that profit-taking will emerge once price approaches this level. Any reaction here will largely depend on external factors and key news events, which must be closely monitored.
Technical Outlook:
Primary Trend: Strong bullish momentum on both Daily and Monthly timeframes.
Momentum: Still positive, though $4,000 may trigger short-term corrections.
> SUPPORT KEY / BUY ZONES : 3800- 3787 - 3750 - 3723 - 3713 - 3703
> RESISTANCE KEY / SELL ZONES : 3825 - 3835 - 3865 - 3880
Trading Plan for Today:
>>> SELL ZONE:
(1) ENTRY: 3969 - 3973
SL: 3976
TP: 3900 - 3890
(2) ENTRY: 3995 - 4005
SL: 4010
TP: 3900 - 3800 - ...
>>> BUY ZONE:
ENTRY: 3885 - 3900
SL: 3880
TP: 3940 - 3970 - 3995 - ...
Risk Management:
- Maintain a minimum Risk:Reward ratio of 1:2.
- Manage position sizing carefully; avoid overtrading at psychological highs.
- Monitor U.S. economic data and geopolitical news closely, as these could act as catalysts for corrective moves.
Conclusion:
Gold remains in a powerful bullish cycle with no signs of cooling down yet. However, the $4,000/oz mark is a critical psychological and technical barrier where corrective pullbacks are likely to occur. Traders should continue to favor long setups but remain vigilant around this zone, closely observing price reactions to refine their strategies.
WISH EVERYONE A PROFITABLE NEW WEEK!

Gold Price Outlook – Trade Setup (XAU/USD)📊 Technical Structure
OANDA:XAUUSD TVC:GOLD Gold (XAU/USD) continues its strong upward momentum, currently trading around $3,974 after printing fresh all-time highs above the $3,950 threshold. On the intraday chart, price action remains within an ascending channel, with immediate support at $3,955–$3,959 (support zone + trendline confluence). If this area holds, bulls may attempt another push toward the $3,990–$3,995 resistance zone, where profit-taking could emerge.
Momentum indicators remain in overbought territory, suggesting the potential for short-term pullbacks before the next leg higher. Failure to defend the $3,955 level could open the door toward $3,930–$3,920, but the broader uptrend structure remains intact as long as price holds above $3,900.
🎯 Trade Setup
Entry (Buy): $3,955 – $3,959 (support zone / channel bottom retest)
Stop Loss: $3,953
Take Profit 1: $3,990
Take Profit 2: $3,995 – $4,000 (psychological level)
Risk–Reward Ratio: ~1 : 5.78
🌍 Macro Background
Gold’s rally is fuelled by political turmoil and safe-haven demand. Japan’s LDP leadership change, France’s government instability, and the ongoing US government shutdown have amplified market uncertainty. Additionally, comments from Fed officials highlight policy caution, with traders still pricing in a 94% probability of an October Fed rate cut.
The Dollar has weakened despite risk aversion, as markets increasingly expect Fed easing to counteract slowing growth and labour market risks. In such an environment, gold remains well-supported, especially with investors hedging against heightened political risk.
🔑 Key Technical Levels
Resistance: $3,990 – $3,995, $4,000 (psychological level)
Support: $3,955 – $3,959
📌 Trade Summary
Gold remains in a strong bullish structure, but intraday charts show potential for pullbacks toward support before buyers step back in. A buy-on-dip strategy near $3,955 looks attractive with upside targets at $3,990 and $4,000. Macro uncertainty continues to favour safe-haven flows into gold, keeping dips well-bid.
⚠️ Disclaimer
This analysis is for reference only and does not constitute trading advice. Trading involves significant risk, and proper risk management is essential.

ElDoradoFx PREMIUM 2.0 – ASIA FORECAST (07/10/2025)Gold (XAUUSD) is trading around 3,961, consolidating after reaching the weekly high at 3,970. The market remains firmly bullish, but momentum has started to slow near the upper boundary of the ascending channel.
The Asian session opens with mixed sentiment — traders are monitoring whether gold will break above 3,970 for continuation or correct toward 3,950–3,940 to gather liquidity.
⸻
🔍 Technical Outlook
Daily Chart (D1):
• The uptrend remains dominant, supported by the 20 EMA and 50 EMA — both widely separated, indicating sustained bullish strength.
• RSI is hovering near 80, confirming overbought conditions but not yet reversing.
• Parabolic SAR remains below price, showing the trend is still intact.
• A close below 3,938 would be the first early sign of cooling momentum; above 3,970, bulls remain in full control.
1H Chart (H1):
• The structure shows consistent higher highs and higher lows since 3,820.
• Price is currently testing the upper trendline resistance of the ascending channel (3,968–3,972).
• MACD remains positive, but histogram bars are flattening — signaling potential consolidation.
• RSI at 70–72 confirms mild exhaustion, suggesting limited upside before a pullback.
• The 20 EMA (3,951) and 50 EMA (3,938) are the nearest dynamic supports.
15M Chart (M15):
• Price action shows tightening range structure with a sequence of short-term BOS (breaks of structure) between 3,956–3,962.
• MACD histogram decreasing, indicating reduced bullish pressure.
• RSI around 65–68 supports potential short-term retracement.
• Immediate support seen at 3,954, with deeper liquidity sitting at 3,944–3,940, which aligns with the Fibonacci zone.
5M Chart (M5):
• The short-term intraday momentum is slowing after repeated rejections around 3,962–3,964.
• Minor bearish divergence spotted between price and RSI, hinting at a temporary pullback.
• The nearest micro-support zones are 3,956, 3,952, and 3,944.
• Short-term structure remains bullish unless 3,940 breaks decisively.
⸻
✨ Fibonacci Golden Zone (Intraday Focus)
From 3,922 swing low → 3,970 swing high
• 38.2% Fib: 3,952
• 50% Fib: 3,946
• 61.8% Fib: 3,940
➡ This defines the Golden Zone between 3,952 – 3,940, ideal for bullish re-entries if price retraces during Asia.
If price bounces from this zone with confirmation, we could see renewed upside toward 3,968 → 3,975 → 3,985.
If the zone fails and 3,940 breaks, deeper correction may follow into 3,925–3,918.
⸻
🎯 High Probability Entries
Buy Setup: Wait for rejection or bullish confirmation in 3,952–3,940 (Golden Zone).
🎯 Targets: 3,962 → 3,970 → 3,975
🛑 SL: Below 3,935 (≈60 pips)
Sell Setup: Short only on clear rejection from 3,968–3,972 resistance zone (double-top / bearish engulfing confirmation).
🎯 Targets: 3,954 → 3,946 → 3,940
🛑 SL: Above 3,975 (≈55 pips)
Intraday / Swing Plays (H1–H4):
• Buy: If 3,940–3,946 holds on retest, looking for continuation toward 3,985–4,000.
• Sell: Break and close below 3,938 opens downside toward 3,918–3,902.
⸻
📅 Fundamental Outlook – Asia Session
No major Asian macroeconomic events expected early in the session.
However, traders should monitor:
• China’s market sentiment (risk appetite or yuan strength often influences gold demand).
• Upcoming US data later in the day: Federal Reserve members speaking and trade balance data could affect USD volatility.
• US Dollar Index (DXY) remains steady around 105.10, showing no major pressure, giving gold space to range or slightly extend gains.
Overall tone remains risk-neutral for the session.
⸻
⚠ Key Levels to Watch
Resistance: 3,962 – 3,970 / 3,975 / 3,985
Support: 3,952 / 3,946 – 3,940 / 3,925 – 3,918
⸻
✅ Summary
Gold remains in a bullish structure but is losing short-term momentum near the top of the channel.
A retracement into the Fibonacci Golden Zone (3,952–3,940) may offer the best high-probability buy setup for continuation toward 3,970–3,985.
If sellers push below 3,940, expect an intraday correction into 3,925–3,918, where fresh liquidity could form for the next bullish leg.
The bias for the Asia session remains bullish but cautious, awaiting reaction near 3,952–3,940 for confirmation.
⸻
🥇 ElDoradoFx PREMIUM 2.0 – PERFORMANCE 06/10/2025 🥇
📊 GOLD TRADES RECAP
✅ BUY +110 pips
✅ SELL +110 pips
✅ BUY +110 pips
✅ SELL +60 pips
✅ BUY LIMIT +150 pips
💰 TOTAL PIPS WON: +540 pips
🎯 RESULT: 5 Wins | 0 SL
📈 ACCURACY: 100 %
🔥 Flawless start to the week!
Strong setups, perfect execution, and consistent profits.
👏 Congratulations if you profited ✅✅✅🚀🚀🚀
FOLLOW US IN YOUTUBE FOR FREE DAILY FORECAST.

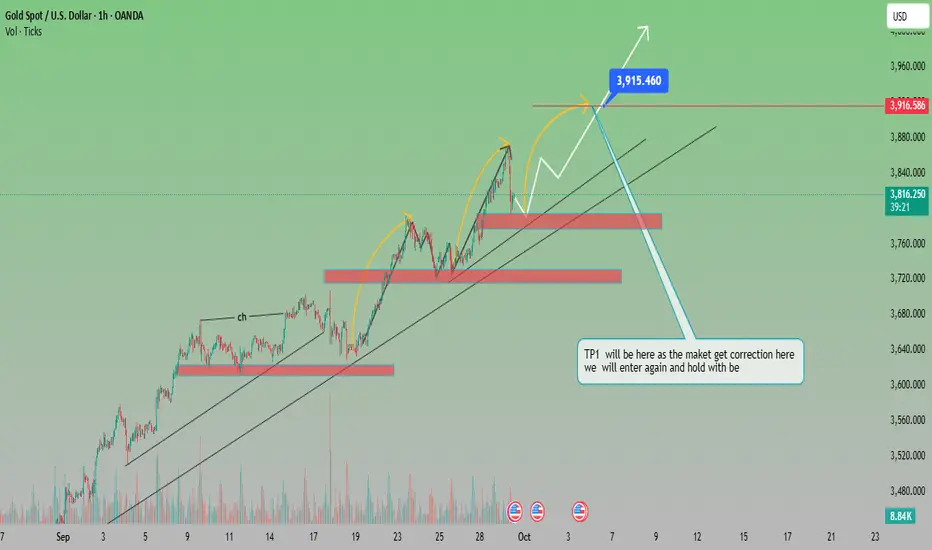
“Gold Price Action: Bullish Momentum with Key Correction Zones
Analysis of XAU/USD (Gold Spot)
The chart shows a clear uptrend channel, supported by higher highs and higher lows.
Price recently pulled back after testing the $3,915 zone, which is acting as a short-term resistance.
Multiple support zones are highlighted (around $3,760 and $3,700), which can provide strong buying opportunities on retracement.
The structure suggests impulse–correction–impulse movement, aligning with bullish continuation patterns.
Bullish Scenario
If price holds above the $3,760–$3,780 support, continuation towards $3,915 (previous high) is expected.
A breakout above $3,915–$3,920 will open the door for further upside, targeting $3,960–$3,980.
Bearish Scenario
If price breaks below the trendline support (~$3,760), deeper correction is possible toward $3,680–$3,640 (TP1 zone).
That zone is mentioned on the chart as a strong re-entry point for long positions.
✅ Suitable Target (Bullish):
Immediate Target: $3,915 (previous high)
Extended Target: $3,960 – $3,980
⚠️ Correction Target (Bearish Pullback):
$3,680 – $3,640 (strong buy zone for re-entry)
Gold Trade Secured 150 PipsSet up played out perfectly. 15m support held followed by a 15m CISD with a retest to secure 150 pips to the upside
www.tradingview.com

Gold Trade Set Up Oct 6 2025Price is trading above PDH and created a new ATH so i am overall bullish. For me to look for buys i want to see price close above the CISD and the 15m and retest it to continue higher but it fails to do that and closed under support i will look for internal sells to 1h demand before taking buys back up

Gold Maintains Bullish Momentum Above Uptrend SupportAnalysis:
The 1-hour chart of XAU/USD shows a strong upward trendline, which has been consistently respected by price action. After a clear bullish momentum breakout around September 25th, gold has continued to post higher lows, confirming buyers’ control of the market.
Currently, gold is trading at $3,878, consolidating just below the $3,924–$3,935 resistance zone. The chart suggests two possible scenarios:
Continuation: If the price respects the upward trendline and breaks above the $3,924–$3,935 resistance, gold could aim for new highs, extending the bullish run.
Short-Term Pullback: A minor correction to retest the trendline is possible, but as long as the trendline holds, the bullish structure remains intact.
Technical Outlook:
Support: $3,855 / $3,785
Resistance: $3,924 – $3,935
Trend: Strongly bullish, supported by ascending trendline
Bias: Buy on dips towards the trendline, targeting a breakout above $3,935

GOLD Breakout Done , Long Setup Valid To Get 300 Pips !Here is My 30 Min Gold Chart , and here is my opinion , the price going up very hard without any correction so we should move with it and we have a 4H Candle closure above our Res 3895.00 And Perfect Breakout and this give us a very good confirmation , so we have a good confirmation now to can buy after the price go back to retest the broken area 3895.00 , and we can be targeting 100 to 300 pips . if we have a daily closure below this area this mean this idea will not be valid anymore .
Reasons To Enter :
1- Perfect Touch For The Area .
2- Clear Bullish Price Action .
3- Bigger T.F Giving Good Bullish P.A .
4- The Price Take The Last High .
5- Perfect 4H Closure .

ElDoradoFx PREMIUM 2.0 – LONDON FORECAST (06/10/2025)Gold is trading around 3,946, pushing strongly upward after breaking out of last week’s consolidation zone. Buyers are firmly in control, supported by momentum across all intraday timeframes. Price is now testing a critical resistance area near 3,949–3,952, aligning with the upper boundary of a long-term ascending channel.
⸻
🔍 Technical Outlook
Daily Chart (D1):
The bullish trend continues strongly, with price maintaining distance above both the 20 EMA and 50 EMA, showing clear market strength.
• RSI is at ~79, indicating overbought conditions but not yet a confirmed reversal.
• The daily structure remains intact unless price closes below 3,876.
• Any dip into 3,920–3,910 may serve as a healthy pullback before continuation.
1H Chart (H1):
Price action shows clean structure — after a Break of Structure (BOS) at 3,886, gold has rallied impulsively.
• MACD histogram and signal lines remain strongly bullish.
• RSI sits around 74, confirming strong buying momentum.
• Nearest dynamic supports: 3,933, 3,925, and the 20 EMA at 3,918.
• Key resistance: 3,949–3,952, where we may see a short-term reaction or rejection.
15M Chart (M15):
Momentum remains bullish, but candles show early signs of exhaustion near resistance.
• MACD histogram is flattening but still positive.
• RSI is near 70, suggesting possible intraday correction before another push.
• Structure: Higher highs and higher lows remain consistent.
• Watch for a potential retest toward 3,933–3,931, which is the nearest Fibonacci 38.2% retracement from the last impulse.
5M Chart (M5):
The short-term trend remains bullish with a sequence of micro higher highs and clean BOS confirmations.
• Support levels to monitor: 3,940 → 3,933 → 3,925.
• MACD shows deceleration, implying price may temporarily consolidate before the next leg.
• Price above all EMAs (20 / 50 / 200) confirms strong buyer control.
⸻
✨ Fibonacci Golden Zone
The latest impulse leg on the M15 chart, from 3,922 (swing low) to 3,949 (swing high), places the Fibonacci Golden Zone (0.618–0.65) between 3,933–3,930.
➡ Scenario A – Bullish Continuation:
If gold retests this golden zone and finds support, expect renewed buying pressure with targets 3,949 → 3,960 → 3,972.
➡ Scenario B – Bearish Intraday Correction:
Failure to hold 3,930 could trigger deeper retracement into 3,918–3,910, still within the larger bullish structure.
⸻
🎯 High Probability Entries
🔹 Scalping (M5–M15, ≤ 60 pips SL):
• Buy Setup: Look for bullish confirmation (hammer/engulfing) near 3,933–3,930 (Fib Golden Zone).
🎯 Targets: 3,945 → 3,949 → 3,960
🛑 SL: Below 3,925 (≈60 pips)
• Sell Setup: Short only if price forms a double-top or bearish engulfing at 3,949–3,952 resistance.
🎯 Targets: 3,933 → 3,925 → 3,910
🛑 SL: Above 3,955 (≈55 pips)
🔸 Swing / Short-Term Intraday:
• Buy: On retracement to 3,925–3,918, if price respects structure and holds the EMA support.
🎯 Targets: 3,949 → 3,972 → 3,985
🛑 SL: Below 3,910
• Sell: Only if a confirmed break and retest below 3,918, which could open room for 3,902–3,886.
🛑 SL: Above 3,926
⸻
📅 Fundamental Outlook – London Session
No major UK or EU economic data during the morning session.
However, upcoming US Fed speeches and ISM services data later today could create volatility in the NY session.
• Hawkish Fed tone → bearish for gold (USD strength).
• Dovish tone or weak ISM data → bullish for gold (USD weakness).
DXY currently stable near 105.2, while yields show mild retracement — slightly supportive for gold intraday.
⸻
⚠ Key Levels to Watch
Resistance: 3,949 – 3,952 / 3,960 / 3,972
Support: 3,940 / 3,933 – 3,930 / 3,918 – 3,910
⸻
✅ Summary
Gold remains in a strong uptrend with price nearing overbought intraday conditions.
A pullback into the Fibonacci Golden Zone (3,933–3,930) may offer the best high-probability buy opportunity toward 3,949–3,972, as long as the structure holds above 3,918.
If sellers reject strongly at 3,949–3,952, expect short-term correction back to 3,933–3,925, providing new liquidity for the next bullish impulse.

ANFIBO | XAUUSD - Trend is Friend, Buy and Win [02.10.2025]Hello, Anfibo's here!
We’ve been winning all week mainly with buy orders following the trend. That’s why the saying “trend is your friend” is so important.
OANDA:XAUUSD Analysis – Daily Trading Plan
Overall Picture:
OANDA:XAUUSD continues to print new ATHs, reaffirming the undeniable strength of the current bullish trend. Our buy zone around 3860 – 3870 yesterday has already delivered about 200 PIPS in profit, a clear validation of staying aligned with the dominant momentum.
With global geopolitical tensions still unresolved, safe-haven flows remain strong, keeping demand for gold intact. Unless major negative news arises, gold is likely to continue conquering new highs in both the short and medium term.
The strategy remains straightforward: favor the buy side over sell side until the trend structure is decisively broken.
Technical Outlook
Short-term trend: Strong bullish continuation on both H4 and Daily timeframes.
Momentum: Healthy and sustainable, with steady higher highs and higher lows.
SUPPORT KEY / BUY ZONES: 3855 - 3840 - 3834 - 3816 - 3800
RESISTANCE KEY / SELL ZONES: 3890 - 3904 - 3918 - 4000
Trading Plan Today
>>> BUY ZONE:
ENTRY: around 3840
SL: 3830
TP: 3890 - 3915 - ATH
>>> SELL ZONE:
ENTRY: 3920 - 2915
SL: 3930
TP: 3870 - 33840
Risk Management
- Favor long trades in line with the prevailing trend; sell setups only for intraday scalps at key resistances.
- Keep a Risk:Reward ratio ≥ 1:2.
- Control position sizing and avoid overtrading during consolidation phases.
- Stay alert to global news headlines, as unexpected geopolitical updates may trigger high volatility.
TODAY IS YOUR DAY ;)

Gold (XAU/USD): Bullish Rise to 3925?OANDA:XAUUSD is gearing up for a bullish move on the 1-hour chart , with an entry zone between 3793-3821 near a key support level.
The target at 3925 aligns with the next resistance, signaling strong upside potential.Set a stop loss on a daily close below 3784 to manage risk effectively. 🌟
A break above 3840 with solid volume could trigger this rise, driven by inflation fears and USD weakness. Watch economic data! 💡
📝 Trade Plan:
✅ Entry Zone: 3793 – 3821 (support area)
❌ Stop Loss: Daily close below 3784 to manage risk
🎯 Target: 3925 (next resistance)
Ready for this push? Drop your take below! 👇

Gold Price Analysis – Bullish Channel Points to $3,936+Gold is trading around $3859 and is moving within an upward channel, keeping the overall structure bullish. Price has recently tested support near $3844 and is showing signs of holding this zone. As long as gold stays above $3840, upside momentum may continue towards $3896 first, and then extend higher towards $3936–$3960 in line with the channel’s upper boundary. On the downside, a break below $3827 could trigger a deeper pullback towards $3793, which is the channel’s base support. In summary, gold remains bullish above $3840, but a drop below $3827 would shift momentum towards further correction.
Overall, the structure remains bullish while price stays inside the ascending channel, but short-term volatility and false breakouts should be expected.
🔑 Key Levels to Watch:
- Resistance: $3896 → $3936 → $3960
- Support: Immediate support $3844 → $3827 → $3805
Note
Please risk management in trading is a Key so use your money accordingly. If you like the idea then please like and boost. Thank you and Good Luck!

Gold Eyes $3920–3950 as Bulls Defend $3800 ZoneGold is currently trading around 3830, after testing the higher zone near 3870–3880. The chart shows a pullback from the highs, and price is now entering a support & consolidation area around 3819–3805 (Fib 0.382–0.5 zone). This zone is crucial because it aligns with trendline support and previous breakout levels. If buyers defend this region strongly, gold has potential to resume upward momentum toward 3870–3880 (recent swing high) and then 3920–3955 (Fib extension and resistance zone).
On the downside, if 3800–3790 fails to hold, then a deeper correction toward 3760–3740 is possible before buyers step back in. Trendline and market structure are still bullish overall, so pullbacks are expected to be opportunities rather than trend reversals.
Summary:
Immediate support: 3819–3805, then 3787–3760
Immediate resistance: 3870–3880, then 3923–3955
Bias: Bullish while holding above 3790; upside targets 3920–3955.
Note
Please risk management in trading is a Key so use your money accordingly. If you like the idea then please like and boost. Thank you and Good Luck!
