XAUUSD LONG SETUP 1:2 RR ( NOV 05, 2025 )If you have doubt on our trades you can test in demo.
OANDA:XAUUSD NEW LONG SETUP
EP: 3972.539
TP: 3996.226
SL: 3960.454
Trade Ideas:
Idea is clearly shown on chart + we have some secret psychologies and tools behind this.
Trade Signal:
I provide trade signals here so follow my account and you can check my previous analysis. So don't miss trade opportunity so follow must.
Xauusdbuy

Gold Bearish Continuation After Range BreakdownThe chart shows that gold (XAUUSD) recently broke down from a clear consolidation range highlighted by the red rectangle. This range acted as a distribution zone where price repeatedly failed to break higher. Once the lower boundary of that range broke, sellers gained momentum, pushing price downward.
Price has now pulled back toward the broken structure, forming a corrective bullish move — likely a retracement before further downside. The projection on the chart suggests a lower-high formation followed by continuation to the downside.
Key observations:
Breakdown from consolidation: The range around 3960–4000 was rejected multiple times, confirming strong resistance.
Pullback to structure: Current bullish candles appear corrective, not impulsive.
Bearish projection: The chart shows expected continuation toward levels around 3929, 3900, and potentially lower.
Stop-loss area: The SL is clearly marked at 4000.234, above the former resistance zone.

Support and trend line coincide, pullback to buy.#XAUUSD OANDA:XAUUSD TVC:GOLD
So far, gold has failed to break out of the converging triangle boundary to choose a clear trading direction, but as time goes on, the price is gradually approaching the end of the triangle, and the battle between bulls and bears may come to a critical decision during the NY session. Looking at the hourly chart, multiple attempts to break through the 4000 resistance level have failed, confirming the pressure above, and gold prices may see further pullback in the short term. The support zone below coincides with the upward trend line, which may be the key area for gold to test during a pullback. Therefore, continue to pay attention to the support level of 3970-3960. If the price retraces to the support level during the NY session and does not break down, you can try to go long on gold with a small position.

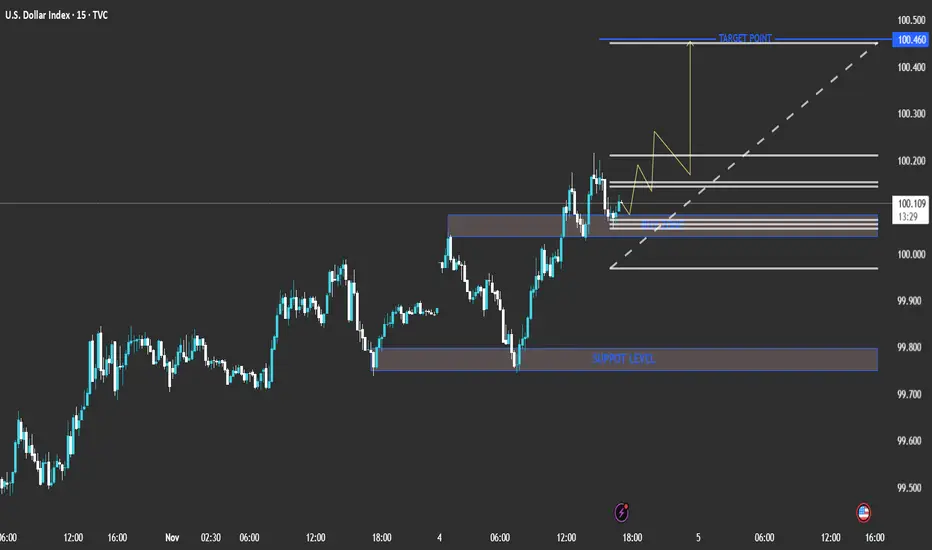
technical analysis of the chart you shared (U.S. Dollar Index Current Price: 100.112
Bias: Bullish short-term
Timeframe: 15-min
The chart shows a clear bullish structure with higher highs and higher lows forming. The price recently bounced from a minor support zone around the 100.00 level and is showing momentum to the upside.
📊 Key Levels
Support Level: 99.750 – 99.850 (major zone from previous lows)
Buy Zone: 100.000 – 100.050 (minor support/entry zone)
Target Point: 100.460
⚙️ Analysis Summary
Price has broken above short-term resistance and is now retesting the buy zone, suggesting a possible continuation higher.
The ascending trendline (dotted white line) supports this bullish bias.
The yellow zigzag projection indicates expected consolidation before a push upward.
🎯 Trading Plan (Based on Chart Setup)
Entry Zone: Around 100.000 – 100.050
Stop Loss: Below 99.900 (below structure support)
Take Profit: 100.460 (target zone)
Risk/Reward Ratio: Approximately 1:3
🔍 Conclusion
The chart suggests a short-term bullish scenario for DXY (U.S. Dollar Index). A successful bounce from the 100.00 zone could lead to a move toward the 100.46 target point. However, a break below 99.90 would invalidate the setup and shift bias to neutral or bearish. TVC:UKX FTSE:UKX FTSE:MCX FTSE:FBMKLCI FTSE:AIM1 FTSE:ASX FTSE:NMX FTSE:AW01 FTSE:JAPAN FTSE:GEISAC FTSE:FBM100 FTSE:AIM5 CBOEEU:BUK100P FTSE:XIN0 FTSE:AXX FTSE:XIN0U
XAU/USD (Gold) 15-Min Chart AnalysisCurrent Price: $4,005
Resistance Zone: $4,020 – $4,040
Gold is approaching a strong resistance area that previously triggered a pullback.
Trend Structure:
The market is moving inside a short-term ascending channel, but momentum shows signs of exhaustion near the upper boundary.
Key Observation:
A false breakout or rejection at the resistance could initiate a downward correction.
Bearish Signal Setup:
Entry Zone (Sell): $4,015 – $4,035 (look for rejection candles or bearish engulfing near resistance)
Target 1: $3,960
Target 2 (Main Target): $3,913
Stop Loss: $4,045 above resistance zone
Risk/Reward Ratio: Approx. 1:2.5
Confirmation:
Wait for bearish confirmation candle on 15M or 30M timeframe.
Break below $3,980 will strengthen bearish momentum toward target.
Signal Summary (📉 Sell Setup):
Direction Entry TP1 TP2 SL
🔻 SELL 4,015 – 4,035 3,960 3,913 4,045 TMX:SXF1! TMX:CRA1! TMX:SXA1! TMX:FHO1! TMX:CGF1! TMX:CGZ1! TMX:FBA1! TMX:FSH1! TMX:SXM1! TMX:SXM1! TMX:FFL1! TMX:FOP1! TMX:FRW1! TMX:FFV1! TMX:FEQ1! TMX:FRQ1!

XAU/USD - Setup Analysis / Bullish ReversalPrice has recently swept the Previous Day’s Low (PDL), a key swing point often associated with potential reversal zones.
However, the current structure suggests that price may continue its liquidity run, targeting the Previous Week’s Low (PWL) and the unfilled weekly Fair Value Gap (FVG) positioned just below.
Upon completion of this liquidity sweep and mitigation of the weekly imbalance, a reversal is anticipated.
The projected draw on liquidity aligns with the unfilled H1 order block on the buy-side, in confluence with an engineered liquidity pool formed around the Previous Day’s High (PDH) and the London Session high.

GoldXAUUSD
- Symmetrical Triangle as an corrective pattern in Long Time Frame
- RSI - Divergence
- Change of Characteristics
- Falling Wedge in Short Time Frame
- Fair Value Gap

XAUUSD LONG SETUP INTRADAY ( NOV 04, 2025 )If you have doubt on our trades you can test in demo.
Details:
Entry: 3981.277
Target Price: 4005.181
Stop loss: 3969.178
Trade Ideas:
Idea is clearly shown on chart + we have some secret psychologies and tools behind this.
Trade Signal:
I provide trade signals here so follow my account and you can check my previous analysis. So don't miss trade opportunity so follow must.

Gold Remains Range-Bound — Focus on Selling ReboundsAs time passes, the 4-hour moving average resistance continues to shift lower, with the key resistance area now around 4004/4030. From the current candlestick structure, bearish momentum still dominates. On the daily chart, the MA30 serves as the crucial pivot level, while MA20 can be used to gauge broader trend direction. In other words, only a firm hold above the MA30 would give bulls a chance to compete, and a full trend reversal would require a confirmed breakout above the MA20.
Key short-term support remains at 3948-3921, followed by the previous low near 3885. If these levels fail to hold, attention should shift to the 3800 psychological level and support from the daily MA60.
On the news front, geopolitical tensions continue to escalate, which has provided some safe-haven demand for gold. However, given the strong rally over the past two months, gold’s traditional safe-haven appeal has weakened, and volatility has increased, giving it characteristics closer to a risk asset at times. Therefore, geopolitical factors should be referenced cautiously, with primary focus remaining on core price structure and trading logic.
Meanwhile, uncertainty around whether there will be a rate cut in December also contributes to the current consolidation. Until there is clear direction, trading should remain cautious—focus on opportunities you clearly understand and avoid greed. When the market structure becomes unclear, stay patient and reduce unnecessary trades to manage risk.

Today's gold trading strategyCentral bank gold purchases + Diversification away from the US dollar
Global central banks increase holdings to record levels: In the third quarter of 2025, global central banks' net gold purchases reached 220 tons (up 28% compared to the previous period), and 95% of the surveyed central banks plan to continue increasing their holdings in the next 12 months. Central banks in China, Kazakhstan, and others have been increasing their purchases continuously, forming a "buying buffer" at the $4,000 level, which provides a long-term supporting logic that is irreversible.
The acceleration of de-dollarization is beneficial: 73% of the surveyed central banks predict that the share of US dollar reserves will decrease in the next five years. The substitutive value of gold as a non-credit asset is prominent, and the willingness of central banks in emerging markets to increase their holdings is particularly strong (48% plan to increase holdings). Structural demand supports the upward movement of the gold price median.
Investment demand experiences explosive growth: In the third quarter of 2025, global gold investment demand reached 537 tons (up 47% compared to the previous year), and the "fear of missing out" (FOMO) mentality pushed individual and institutional funds to continuously flow in, forming a positive cycle of "fundamental factors + capital factors".
Today's gold trading strategy
buy:3990-4000
tp:4010-4020
sl:3980

Today's gold trading strategyExtreme Risk Hedging: The Underestimated "Black Swan" Defense Value
The "gray rhino" threat of global debt risks: According to the International Finance Association (IIF), the global debt scale will exceed 400 trillion US dollars in 2025, with the debt/GDP ratio reaching 360%, setting a new record high. The default rate of emerging market dollar bonds has risen from 5% in 2024 to 8%, and countries like Argentina and Turkey have shown signs of debt restructuring. Gold, as the "ultimate payment tool during a debt crisis", has been severely undervalued in terms of its hedging value - during the 2008 financial crisis and the 2012 European debt crisis, the increase in gold prices during the stage of debt risk outbreak was over 20%, and currently, the debt risk premium corresponding to 4023 US dollars only reflects 30%, with significant upward potential.
Inflation hedging of global supply chain "fragmentation": The World Bank's "Global Supply Chain Report 2025" shows that the "regionalization" of global supply chains has led to a 12% increase in intermediate product costs, with the transportation costs of energy and metals rising by more than 20%. This "supply chain inflation" is different from traditional demand-driven inflation and has the characteristics of "strong stickiness and long duration", while the hedging efficiency of gold against supply chain inflation (correlation 0.8) is significantly higher than that against demand-driven inflation (correlation 0.5). Currently, the market's pricing of supply chain inflation is insufficient, and the anti-inflation attribute of gold has not been fully exerted.
Hedging demand for "multi-point spread" of geopolitical conflicts: In addition to the conflicts in the Middle East and Russia-Ukraine, "hidden geopolitical risk points" such as shipping safety in the Red Sea, the situation on the Korean Peninsula, and political unrest in South America are also brewing - the number of attacks on merchant ships in the Red Sea increased by 50% month-on-month in October, the number of intercontinental missiles launched by North Korea reached a new high since 2017, and the new government of Argentina's implementation of the "dollarization" policy has triggered domestic unrest. These risk points have not yet formed a market consensus, but if a "single point breakthrough" occurs (such as the interruption of shipping in the Red Sea), it will trigger concentrated buying of gold for hedging, pushing the gold price to increase by more than 2% in a single day.
Today's gold trading strategy
buy:4000-4010
tp:4020-4030
sl:3990

Today's gold trading strategyThe probability of the Fed cutting interest rates remains high: Despite the growing influence of the hawkish voices, the CME "Fed Watch" data shows that the probability of a 25 basis point rate cut in December still stands at 69.8%. Moreover, Fed officials such as Fisher have explicitly supported the rate cut, believing that the weak job market constitutes a reason for easing policies. The general trend of policy shift has not been altered by short-term differences.
Policy divergence hides potential for expectation differences: The market has overreacted to the hawkish remarks from within the Fed, but has overlooked the reality that the US real estate market has entered a recession and housing transaction volume has reached a 30-year low. If the non-farm payrolls data subsequently becomes even weaker, the probability of a rate cut is expected to rise to above 75%, becoming a catalyst for the rebound in gold prices.
The easing policy in emerging markets continues to intensify: The "hidden easing" effect of cumulative interest rate cuts by central banks in emerging markets (such as Brazil and India) by 150 basis points in the third quarter has continued to be released. These central banks have simultaneously increased their gold holdings while cutting interest rates, creating a dual benefit of "loose liquidity + asset allocation". The $4010 level has not fully priced in this benefit.
Today's gold trading strategy
buy:4000-4010
tp:4020-4030
sl:3990

XAUUSD, BUY TILL 4045XAUUSD, if this running M5 Candle will clsoe above the 4016, market will surely going to touch 4045 level very easily,

With Bears in Control, Gold May Fall Toward 3800Gold has been trading in a low-level consolidation recently. Although the price briefly broke above the MA5 on the daily chart, the overall structure remains bearish. Only a breakout and firm hold above 4080–4100 would offer bulls a genuine trend opportunity; otherwise, under bearish control, the current sideways movement should still be viewed as a bearish continuation pattern.
Price is currently moving within a triangle consolidation:
Resistance: 4013 / 4030 / 4063-80
Support: 3986-75 / 3948-21
Under the continuation-downtrend scenario, the strategy remains focused on selling into rebounds or entering short positions in staged batches. If Wave 5 unfolds, gold could push below 3800.
Patience is key during this phase. Should major bullish news emerge, the market may trigger a sharp upside move (potentially a bull trap), so stay flexible and adapt to price action rather than locking into one bias.

XAU/USD Analysis — Awaiting Breakout Confirmation for Bull Entry🏆 XAU/USD GOLD vs U.S. DOLLAR 🏆
📊 Swing/Day Trade Opportunity Guide
🎯 THE THIEF STRATEGY SETUP
Market: Precious Metals | Pair: XAU/USD (Spot Gold)
Timeframe: Multi-Timeframe Confirmation
Strategy Type: Breakout + Dynamic Support/Resistance
💡 BULLISH CASE CONFIRMED ✅
The bulls are on patrol! 🚨 Multiple confluences suggest an upside move:
✨ LSMA (Least Squares Moving Average) acting as dynamic support with multiple touch confirmations — classic reversal signal for swing traders. The metal is respecting this lower boundary like a fortress wall.
⚠️ Breakout Confirmation Required: Watch for a decisive close above 4,060.00 — this level marks a critical moving average resistance zone. Once breached, this becomes our green light for layered entries.
💰 ENTRY STRATEGY: "THE LAYERING THIEF METHOD" 💎
Instead of FOMO-ing into one position, we deploy the layered entry approach — multiple limit orders like a professional accumulator:
📍 Buy Limit Layers (After Breakout Confirmation):
Layer 1️⃣: 3,920.00 ← Initial dip catch
Layer 2️⃣: 3,960.00 ← Continuation entry
Layer 3️⃣: 4,000.00 ← Mid-zone accumulation
Layer 4️⃣: 4,040.00 ← Final confirmation level
⚡ Pro Tip: Scale these layers based on your account size and risk tolerance. You can add more layers every $20-$40 intervals.
🔔 CRITICAL:
✋ Wait for breakout confirmation above 4,060.00 before placing any buy orders. Premature entries = Stolen profits going nowhere! ❌
🛑 STOP LOSS (Risk Management)
Thief SL Level: 3,880.00 🎯
This is where the heist ends if the plan fails. Close below this support = Exit the building! 🚪
⚠️ Disclaimer Note: This stop loss is suggested as a reference point. Your SL placement depends on your risk appetite, account size, and trading personality. We're not financial advisors — only fellow traders sharing our playbook! Trade at your own risk. 💪
🎪 PROFIT TARGET: "THE POLICE BARRICADE" 🚔
Target Zone: 4,360.00 🏁
Why this level? Multiple reasons converge here:
📈 Strong historical resistance acting as a "police barricade"
🔴 Overbought conditions signal potential pullback territory
⚠️ Trap zone detected — this is where smart money takes profits!
Strategy: Scale out your positions as price approaches this zone. Don't get greedy and lose the win!
⚠️ Disclaimer Note: This profit target is OUR suggested zone, but YOU decide when to take profits. The choice is yours — stack those wins or hold for more. No financial advice here, just trading wisdom shared among Thief OG's! 🎩
🔗 CORRELATED PAIRS TO MONITOR 📡
Watch these related instruments for confluence signals:
💵 USD Index ( TVC:DXY ) — Inverse relationship with gold. If DXY weakens → XAU/USD strengthens. Monitor for divergence opportunities.
🏦 SPX500 ( CAPITALCOM:US500 ) — Risk sentiment indicator. Rising stocks = potential gold weakness. Use as confirmation filter.
FX:EURUSD — EUR strength = potential gold support. Cross-market divergences often precede major moves.
FX:GBPUSD — Pound weakness often correlates with gold rallies. Track for multi-timeframe alignment.
TVC:US10Y (10-Year Treasury Yield) — Inverse correlation. Rising yields = headwind for gold. Monitor daily for macro context.
📋 QUICK CHECKLIST ✅
Confirm LSMA support holds
Wait for 4,060.00 breakout confirmation
Place layered buy limits at 3,920/3,960/4,000/4,040
Set stop loss at 3,880.00
Scale profits into 4,360.00 resistance zone
Monitor correlated pairs for confluence
Respect risk management — never exceed 2% per trade
🎬 THE BOTTOM LINE 🎬
Gold is setting up for a potential swing trade move. The LSMA support is holding, and a breakout above 4,060.00 could trigger a run toward 4,360.00. Use the layering strategy to build positions methodically, protect capital with your chosen stop loss, and exit into resistance zones.
This is a confluence-based breakout play — not a guarantee, just probability on our side. 🎲
✨ If you find value in my analysis, a 👍 and 🚀 boost is much appreciated — it helps me share more setups with the community!
#XAU/USD #GoldTrading #TradingStrategy #SwingTrade #DayTrading #ForexAnalysis #TechnicalAnalysis #ThiefStrategy #LSMA #BreakoutTrading #RiskManagement #TradingCommunity #MarketAnalysis #Commodities #MetalsMarket

GoldXAUUSD
- Bullish Channel as an corrective pattern in Short Time Frame
- RSI - Divergence
- Completed " 12345 " Impulsive Waves and " ABC " Corrective Waves
- Falling Wedge as an corrective pattern in Long Time Frame
- Order Block

XAUUSD- Trend reversal - New ATH incoming?OANDA:XAUUSD has turned bullish on the daily timeframe after holding key dynamic support and reclaiming the volatility ribbon. The structure now supports continuation toward higher Fibonacci levels, provided price remains above the $3,940 support zone.
Momentum is shifting in favor of buyers, and with strong absorption of previous selling, the bias now leans toward further upside movement.
Bullish Confluences:
Structure Shift: Price has broken above the short-term descending channel, confirming a bullish structure change after forming a higher low near the mid-band support.
EMA / Volatility Ribbon Reclaim: Candles have closed back inside the green volatility ribbon, signaling renewed bullish momentum and a shift in trend sentiment.
Strong Daily Rejection: The recent candle shows a clear rejection wick from the lower volatility band (blue zone), indicating that buyers absorbed selling pressure and stepped back in.
Momentum Turn: Oscillators and momentum tools (if used) confirm upward acceleration, consistent with previous bullish continuation setups.
Support Confirmation: The previous base around $3,920 – $3,940 held firmly as support, creating a foundation for an upward leg.
🎯 Fibonacci Extension Targets (Upside)
Measured from the latest swing low to swing high:
Target 1 (38.2%) → $4,091
Target 2 (61.8%) → $4,143
Target 3 (100%) → $4,210

XAU/USD Market Structure Reveals Potential Upside Move!🥇 XAU/USD: "Gold Heist Wealth Map" - Swing/Day Trade Blueprint 🚨
🎉 Ladies & Gentlemen, Thief OGs! Welcome to the Gold Heist Wealth Map for XAU/USD (Gold vs. U.S. Dollar) — a cheeky, calculated swing/day trade plan to snatch profits from the metals market! 😎 This setup is designed with a thief-style layered entry strategy, bullish vibes, and a pro-level escape plan to dodge the "police barricades" (resistance zones). Let’s dive into this shiny opportunity with a fun yet professional edge! 💰
📈 Trade Setup: The Gold Heist Plan
Asset: XAU/USD (Gold vs. U.S. Dollar)
Outlook: Bullish 📈
Strategy: Thief-Style Layered Limit Orders — multiple buy limit entries to maximize your loot! 🕵️♂️
Entry Levels:
🔔 Buy Limit @ 3850
🔔 Buy Limit @ 3880
🔔 Buy Limit @ 3900
🔔 Buy Limit @ 3930
Pro Tip: Feel free to add more layers based on your risk appetite! Stack those entries like a master thief. 😜
Stop Loss (SL): Set at 3800 (the "Thief’s Exit Door"). 🚪
Note: This SL is my suggestion, but you’re the boss of your heist! Adjust based on your risk tolerance. 💸
Take Profit (TP): Aim for 4100 — a juicy target where a police barricade (strong resistance + overbought zone) might set a trap. Escape with profits before the market cuffs you! 👮♂️
Note: TP is my call, but take your loot when you feel the heat! Your trade, your rules. 😎
🛠️ Strategy Breakdown: Why This Setup?
Thief-Style Layering: Using multiple buy limit orders spreads your entry risk across price levels, letting you sneak into the market like a pro. 🕵️♀️
Bullish Momentum: Gold’s been shining bright with macroeconomic tailwinds (USD weakness, inflation hedges). 📡
Resistance Watch: The 4100 zone is a psychological and technical barricade. Overbought signals + potential traps mean it’s time to cash out smartly. 🏦
Risk Management: The 3800 SL keeps your downside locked, but always tailor it to your account size and risk profile. ⚖️
🔗 Related Pairs to Watch (in USD)
Keep an eye on these correlated assets to boost your market awareness:
OANDA:XAUUSD (Silver vs. U.S. Dollar): Silver often moves in tandem with gold. Watch for similar bullish setups or divergences.
USD Index ( TVC:DXY ): A weaker USD typically fuels gold rallies. Monitor DXY for inverse correlation signals. 📉
OANDA:AUDUSD : Gold prices often align with the Aussie dollar due to Australia’s gold exports. A rising AUD/USD could support our bullish XAU/USD bias. 🇦🇺
Key Correlation Insight: Gold thrives in low-rate environments or when USD weakens. Check economic calendars for Fed rate decisions or inflation data (CPI, PPI) to time your entries. 📅
⚠️ Disclaimer
This Thief-Style Trading Strategy is for fun and educational purposes only! Trading involves risks, and you’re responsible for your own decisions. Always do your own research (DYOR) and manage risk wisely. No financial advice here — just a playful map to navigate the markets! 😄
✨ If you find value in my analysis, a 👍 and 🚀 boost is much appreciated — it helps me share more setups with the community!
#XAUUSD #Gold #SwingTrading #DayTrading #ThiefStrategy #Bullish #Forex #MetalsMarket

Is the XAU/USD Breakout the Next Major Trade Opportunity?💰 GOLD vs USD — “Thief Trader’s Golden Breakout Playbook” ⚡️
Asset: XAU/USD (Gold vs U.S. Dollar)
Market: Metals
Type: Day Trade Setup
Bias: 🟢 Bullish plan – pending order after breakout
🧭 TRADE BLUEPRINT
Entry Zone:
Wait for a clean breakout above 4160.00 before entering.
(Breakout confirmation > impulsive candle > retest optional)
Stop Loss:
“Thief SL” parked at 4040.00 — move only after breakout validation.
💡 SL isn’t mandatory — your money, your call!
Target:
Ride the move up to 4380.00, where strong resistance meets overbought traps.
🧨 Escape with profits before the crowd gets greedy!
💬 NOTE TO ALL “THIEF OG’s”
Dear Ladies & Gentlemen,
I’m not asking you to use only my SL or TP — they’re examples.
You’re the master of your risk. Make money. Take money. Stay legendary. 💸
🧩 CORRELATION CHECKLIST
Keep your eyes on these key pairs to confirm gold’s direction:
TVC:DXY (U.S. Dollar Index): If the dollar drops, gold usually pops.
OANDA:XAGUSD (Silver): Often follows gold’s mood — good double-check.
FX:USDJPY & OANDA:USDCHF : Safe-haven cousins. If they fall, gold shines brighter.
OANDA:XAUJPY : A stealth correlation — helps catch sentiment early.
🧠 Gold doesn’t move alone — it dances to USD rhythm and global risk tone.
⚙️ THIEF INSIGHT:
Gold’s sitting near a major pivot resistance (4160) — a breakout signals momentum ignition.
Risk/Reward is balanced: 4040 SL vs 4380 TP (~1:1.8).
Institutional footprints suggest buy interest post-breakout zone.
Stay sharp — watch volume spikes & candle closes above breakout line.
🏁 FINAL WORDS
Trading isn’t robbery — it’s legalized patience.
The real theft is done with discipline, not greed.
Grab your profits like a pro, not a desperado. 🕶️💼
✨ “If you find value in my analysis, a 👍 and 🚀 boost is much appreciated — it helps me share more setups with the community!”
⚠️ DISCLAIMER:
This is a Thief Style Trading Strategy — just for fun & education.
Not financial advice. Always DYOR & trade responsibly. 🧠💰
#XAUUSD #Gold #DayTrading #Breakout #ThiefTrader #Forex #MetalsMarket #GoldAnalysis #USD #DXY #TradingView #RiskManagement #TechnicalAnalysis #FunTrading #MarketPlaybook

XAU/USD Bullish Outlook - Strategic Entry & Exit Plan🟡💰 XAU/USD — “Gold Rush or Police Trap?” ⚡ Thief Strategy Playbook 🎯
Asset: XAU/USD “Gold vs U.S. Dollar”
Market Type: Crypto / Metals Cross (Swing / Day Trade)
Bias: Bullish 🟢
🔓 Thief’s Entry Game Plan (Layer Method)
This isn’t your typical sniper-entry… this is the Thief Strategy™ — a layering style method using multiple limit orders for flexible accumulation.
💎 Layer Entries:
4000.00 ✅
4025.00 ✅
4050.00 ✅
(You can increase or adjust the layers based on your risk appetite & setup.)
🛡️ Stop Loss (Thief’s SL): @3950.00
“Dear Ladies & Gentlemen (Thief OG’s) — I’m not recommending my SL; it’s just my escape route.
Trade smart, take your profits, and move at your own risk.”
🎯 Target Zone — “Police Barricade Ahead 🚨”
The 4200.00 zone acts as a strong resistance + potential trap area — heavy liquidity and overbought conditions live there.
Be wise, secure the bag 💼, and slip out before the market cops show up.
📊 Key Technical Notes
Momentum shows gold buyers reclaiming upper zones after liquidity grabs.
Higher-timeframe structure: Still bullish unless 3950.00 breaks cleanly.
RSI divergence & volume spike hint at layered re-accumulation potential.
🔗 Related Pairs to Watch & Correlations
💵 TVC:DXY — Inverse correlation; stronger dollar → gold pullback risk.
BITSTAMP:BTCUSD — Occasionally follows gold sentiment under risk-off conditions.
💹 TVC:SILVER (XAGUSD) — Often moves in tandem; can confirm metal-sector strength.
💱 FX:USDJPY — Watch for safe-haven flows; yen strength = gold demand uptick.
⚙️ Market Sentiment (London Session Focus)
📈 Bullish tone continuing through European hours.
🔍 Institutions layering bids near 4000–4050 liquidity pocket.
⏱ Short-term pullbacks expected before breakout continuation.
✨ “If you find value in my analysis, a 👍 and 🚀 boost is much appreciated — it helps me share more setups with the community!”
📜 Disclaimer:
This is a Thief-style trading strategy — just for fun & educational purposes only.
Not financial advice. Trade responsibly — steal profits, not peace. 🕶️
#XAUUSD #Gold #ThiefTrader #SwingTrade #LayerEntry #Forex #DayTrading #TechnicalAnalysis #MarketStrategy #GoldTrading #XAU #PriceAction #SmartMoney #LondonSession #TradingViewIdeas

Core Data and Event Analysis for the Super WeekCore Data and Event Analysis for the Super Week
The upcoming week will see a dense window of key data releases and events, featuring "PMI + ADP Employment + Central Bank Rate Decision" — each with the potential to break the current range-bound market pattern for gold:
Nov 3: Global Manufacturing PMIs
Market expectations point to a reading of 49.2 for the U.S. October ISM Manufacturing PMI, while China’s SPGI Manufacturing PMI is projected to remain below the 50.0 expansion-contraction threshold at around 49.0%.
- A U.S. PMI print below 48.5 would reinforce expectations of economic slowdown, fueling bets on monetary easing and lifting gold sentiment.
- A reading above 49.5, however, could further weigh on gold prices by signaling relative economic resilience.
Nov 5: U.S. ADP Employment Report
As a leading indicator for nonfarm payrolls, the ADP report is expected to show 170,000 new jobs added in October.
- If the actual figure falls below 150,000, the probability of a Fed rate cut in December may rise above 70%, directly driving gold to test the 4,040 USD resistance level.
- A print above 200,000 could trigger a pullback in gold to the 3,970 USD support zone.
Nov 6: Bank of England (BoE) Rate Decision
Market sentiment is divided ahead of the BoE meeting: most institutions anticipate rates to stay unchanged at 4.0%, but Goldman Sachs forecasts a 25-basis-point cut.
- Should the BoE initiate an interest rate cut cycle, it would boost global expectations for monetary easing, providing indirect support to gold prices.
Nov 7: Collective Remarks by FOMC Members
Five core members of the U.S. Federal Open Market Committee (FOMC) will deliver speeches. Key focus will be on their comments regarding a potential December rate cut and inflation trends.
- Hawkish signals (e.g., emphasizing persistent inflationary pressures) may trigger a short-term correction in gold.
- Dovish comments (e.g., noting signs of softening in the labor market) are likely to act as a catalyst for gold to break above key resistance levels.
Next week's trading strategy and analysis
buy:4000-4010
tp:4025-4035-4100
sl:3995

Gold Strategy Analysis for Next WeekGeopolitical Front: Multiple regional conflicts escalate, risk premium continues to accumulate
The Israeli-Palestinian conflict has reached a boiling point: Israel's military strikes on Gaza have continued to intensify, resulting in over 11,000 Palestinians killed, with children accounting for over 40%. The humanitarian crisis has drawn global condemnation. Although a hostage exchange agreement was reached between the two sides, Netanyahu explicitly stated that "after eliminating Hamas, we will fully control Gaza", indicating a clear trend of prolonged conflict; Hezbollah has issued a warning to the United States about a naval strike, and the risk of conflict spillover has significantly increased.
The intensity of the Russia-Ukraine conflict has risen: The Russian army has eliminated approximately 4,825 Ukrainian soldiers within a week, achieving breakthroughs in several directions such as Kupiansk and Donetsk. The Ukrainian ammunition depot has been destroyed, and NATO's assistance to Ukraine has been limited due to funding issues (the Pentagon has only 1 billion US dollars left for aid to Ukraine), and the balance of the conflict continues to tilt, making the demand for geopolitical risk aversion difficult to abate.
Global credit system turmoil: Moody's has downgraded the outlook for the US rating to negative, and in addition to the policy divergence of the Federal Reserve, the credit foundation of the US dollar has been impacted, and the attractiveness of gold as the "ultimate value storage tool" has significantly increased.
Next week's trading strategy and analysis
buy:4000-4010
tp:4025-4035-4100
sl:3995
XAU/USD Short to Longs idea Yes — I still believe Gold remains bullish overall. The recent downside movement looks like a healthy correction before price continues its rally upward. I’m noticing price building liquidity, so I’ll wait for a breakout and a clean tap into one of my key POIs.
Currently, price is sitting in a 30min demand zone near a 2hr supply, where I expect a possible short-term reaction. After that, I’ll be waiting for the next solid buying opportunity — ideally from the 3hr demand around 3,860, or from a new demand that may form closer to current price this week.
Confluences for Buys:
- Price broke major structure to the upside and is now retracing
- Liquidity above (trendline + Asia highs) waiting to be taken
- 3hr demand around 3,860 could fuel the next rally
- Bullish candlestick momentum remains strong
- Higher time frames still show clear bullish structure
P.S.If price breaks below 3,850 with clear bearish structure, I’ll consider a short-term bearish phase. Until then, I’ll stay focused on long opportunities in line with the dominant trend. Have a great trading week!
