Gold May Retest 3800 — How to Trade It?Today, gold pulled back to the 20 area and formed a short-term bottom confirmation on the 30M chart with several long lower wicks.
Next, watch the 58 resistance. If price breaks and holds above, bulls will gain a clear advantage, with a likely move to test 3800.
During this move, the 72–77 zone may provide resistance, but strong bullish momentum is likely to break through it.
If gold reaches around 3800 and pulls back, this level will become a new support zone.
Xauusdbuy

ElDoradoFx PREMIUM 2.0 – GOLD FORECAST (26/09/2025)🔍 Multi-Timeframe Technical Analysis
Daily (D1)
• Gold is trading at 3,752, holding above the 10EMA and the 3,732 pivot support.
• Momentum remains bullish overall after the rally from early September, but candles show hesitation under 3,791 high → signs of consolidation before a potential new breakout.
• As long as 3,732 holds, the structure remains bullish.
⸻
1H (Intraday Structure)
• Price has broken above the descending trendline resistance (~3,748), now retesting this area.
• Support cluster: 3,745–3,740 (aligned with EMA + structure lows).
• Resistance zone: 3,752–3,755 (capping upside before 3,764).
• MACD: momentum just flipped positive, but histogram is shallow → momentum still fragile.
• RSI: mid-zone (~55) → suggests potential to expand higher if resistance breaks.
⸻
15M (Short-Term View)
• Price consolidating 3,745–3,752.
• Higher lows forming since Asian session → bullish micro-structure.
• MACD showing bullish divergence after last sweep of lows near 3,734.
⸻
5M (Scalping View)
• Strong sweep earlier at 3,751, rejection but held 3,747–3,745 base.
• Micro ascending channel → scalpers eyeing breakout confirmation.
• Momentum picking up, but volume still thin → London likely decides breakout direction.
⸻
📌 Fibonacci Golden Zone
Swing High 3,791 → Swing Low 3,732:
• 38.2% = 3,754
• 50% = 3,761
• 61.8% = 3,767
➡️ Golden retracement lies at 3,754–3,767 → exactly where London session resistance sits. A break into this zone will decide continuation vs. rejection.
⸻
🎯 Scalping Setups (Max 60 Pips SL)
✅ Buy Setup (Preferred if bullish momentum holds)
• Entry: Above 3,752–3,754 breakout & retest.
• SL: 3,746 (≈ -60 pips).
• TP1: 3,761
• TP2: 3,767 (Fib 61.8%).
• Reasoning: Break above golden zone support confirms bullish continuation.
✅ Sell Setup (If rejection at resistance)
• Entry: Rejection at 3,754–3,755 or confirmed break below 3,740.
• SL: 3,760 (≈ -60 pips).
• TP1: 3,734
• TP2: 3,722.
• Reasoning: Failure to hold golden zone leads to pullback toward London lows.
⸻
⚠️ Key London Session Levels
• Bullish Breakout: 3,754 → opens 3,761–3,767.
• Bearish Breakdown: 3,740 → exposes 3,734 then 3,722.
• Pivot Level: 3,745 (control zone for scalpers).
⸻
✅ Summary:
Gold sits at a decision point. If 3,752–3,754 breaks and holds, expect bullish continuation into 3,761–3,767 (golden zone). If rejected, scalpers can look for shorts back toward 3,734–3,722. London open will likely provide the breakout.

Gold Price Outlook – Trade Setup (XAU/USD)📊 Technical Structure
Gold (XAU/USD) is trading near $3,740, consolidating below the descending trendline resistance. The support zone lies at $3,723 – $3,719, while the resistance zone is around $3,761 – $3,765. The price structure shows a “buy-the-dip” bias as long as support holds, but near-term pressure remains capped by the downtrend line. A breakout above $3,765 could open the path toward $3,785.
🎯 Trade Setup
Entry: $3,719 – $3,723 (support retest)
Stop Loss: $3,715
Take Profit: $3,764 / $3,785
Risk/Reward (R:R): ~1 : 5.4
🌍 Macro Background
Markets await the US Core PCE Inflation data later today – the Fed’s preferred inflation gauge. Stronger-than-expected PCE could strengthen the USD and pressure gold lower. On the other hand, a softer reading may revive rate cut expectations, supporting gold. Additionally, Trump’s new tariffs (100% on pharmaceuticals, 50% on cabinets, 30% on furniture, etc.) and ongoing geopolitical risks with Russia provide safe-haven flows that keep gold attractive. Despite the USD holding at three-week highs, investors continue to see gold as a hedge amid policy uncertainty and trade tensions.
🔑 Key Technical Levels
Resistance: $3,764 / $3,785
Support: $3,723 / $3,719
📝 Trade Summary
The overall structure favours a buy-the-dip strategy near support zones, with upside potential toward $3,764 – $3,785 if US PCE comes in softer. However, a stronger inflation print may trigger a deeper pullback below $3,719. Traders should stay alert for volatility around the data release.
⚠️ Disclaimer
This analysis is for reference only and does not constitute trading advice. Trading involves significant risk, and proper risk management is essential.

9/25: Buy at Lows, Watch Resistance at 3758–3763Good morning everyone!
Yesterday, gold rebounded from support but failed to break resistance, then continued its decline to around 3720, completing the divergence correction on the 30M chart. This downside move was well captured.
Currently, price is in a rebound phase:
3752–3758 is the key resistance zone. A clean breakout and consolidation above would give the bulls stronger momentum.
3733–3726 is the key support area. If price retests without breaking lower and forms bullish candles (especially strong bullish candles without long upper wicks), the probability of another upward move increases.
If volume supports a breakout, watch the 3770–3780 resistance area, as it may trigger further upside.
📌 Trading Outlook:
Trend setups:
Long opportunities below 3710;
Short opportunities above 3780;
If price breaks above 3770 and retests near 3760 without losing 3752, this could present another long entry.
Range setups:
Consider swing trades within the 3766–3726 range.
⚠️ Reminder: If your account condition is not favorable, avoid unnecessary trades. Focus on higher-probability setups to steadily grow profits while controlling risk.

Gold: Opportunities for both longs and shorts.Gold still pulled back downward overnight, which is the time window we reminded everyone to pay attention to yesterday. On the daily timeframe, the price has started to approach MA5. After a relatively large short-term gain, it is facing correction pressure. Today, focus on the support from MA10; there is also a need for a pullback on the weekly timeframe. However, note that there will still be an upward move after the correction—fundamentals have not changed, and the main trend remains intact.
After the strong one-way trend shifted to consolidation, short positions can also be traded; there are opportunities for both short-term long and short positions, but it is necessary to seize the right levels. Pay attention to shorting on rebounds near the 3765/3770 resistance, and look to go long near the 3710 support and the daily MA10 level. Currently, price volatility is relatively high, so be sure to control risks properly.
Buy 3730 - 3740 TP 3750 - 3760 - 3770 SL 3725
Sell 3760 - 3770 TP 3770 - 3775 SL 3758
Daily-updated accurate signals are at your disposal. If you run into any problems while trading, these signals serve as a reliable reference—don’t hesitate to use them! I truly hope they bring you significant assistance

ANFIBO | XAUUSD - A psychological zone $3800 ? [09.25.2025]Hi guys! Anfibo's here!
Overall Picture Today:
OANDA:XAUUSD is currently maintaining stability within the H4 bullish channel, reflecting the sustainability of the prevailing uptrend. Although no major breakout has occurred in recent sessions, the technical structure indicates that buyers still hold the advantage. However, the market is showing signs of stalling at a key resistance zone, so short-term trading plans should focus on resistance and support levels to optimize profits.
> SUPPORT KEY LEVELS: 3748 - 3733 - 3703
> RESISTANCE KEY LEVELS: 3768 - 3777- 3788 - 3799
Here's my Trading Plan today:
>>> SELL SCALP:
ENTRY: 3770 - 3765
SL: 3780
TP: 3720 - 3705
>>> BUY ZONE:
ENTRY: 3700 - 3705
SL: 3695
TP: 3760 - 3800
Always set stop-loss and good money management for success!
GOODLUCK GUYS!!!

Gold Price Forecast – Long Setup (XAU/USD)📊 Technical Structure
Gold price retraced from the 3777–3785 resistance zone and is currently consolidating during Asia Session. The chart indicates a solid support base around 3714–3723, while resistance is capped near 3777–3785. As long as price holds above support, the bullish bias remains intact, with potential to retest upper resistance.
🎯 Trade Setup
Entry (Buy): 3723
Stop Loss: 3712
Take Profit: 3785
Risk/Reward (R:R): 1 : 5.62
🌍 Macro Background
Gold holds firm near $3,750 in early Asian trading, supported by expectations of further Fed rate cuts and elevated geopolitical risks. The Fed has already cut rates by 25bps in September, bringing the Federal Funds Rate to 4.00%–4.25%, with projections showing two more cuts this year and one in 2026. Lower interest rates reduce the opportunity cost of holding non-yielding assets like gold, boosting demand.
Meanwhile, heightened geopolitical tensions — with NATO warning Russia over repeated airspace violations — continue to fuel safe-haven flows. However, Fed Chair Powell’s cautious comments about balancing labour market weakness with inflation risks may limit the upside momentum in the short term. Despite this, the medium-term structure still favours the bulls.
🔑 Key Technical Levels
Resistance (R): 3777 / 3785 / 3790
Support (S): 3723 / 3714
📝 Trade Summary
Gold remains supported by rate cut expectations and safe-haven demand. A buy setup near 3723 with stops below 3712 and target at 3785 offers a favourable risk/reward profile. Sustained momentum above 3785 could open the path towards the 3800 psychological level.
⚠️ Disclaimer
This analysis is for reference only and does not constitute trading advice. Trading involves significant risk, and proper risk management is essential.

Go long on pullbacks; avoid chasing highsToday, as long as it breaks through 3780, I will stop going long and continue to monitor the market 📊. If it climbs to around 3800, we can attempt short positions and set the SL properly ⚠️
I reminded everyone multiple times yesterday to exit long positions at 3790 to avoid pullbacks 📉, and our stance remains unchanged today: we still favor looking for long opportunities during pullbacks 🐂—under no circumstances should we chase long positions at high levels ⚠️
Buy 3750 - 3755
TP 3760 - 3770 -3780
Sell 3798 - 3800
TP 3780 - 3770 - 3760
SL 3802
Accurate signals are updated every day 📈 If you encounter any problems during trading, these signals can serve as your reliable guide 🧭 Feel free to refer to them! I sincerely hope they'll be of great help to you 🌟 👇

Gold: still go long on pullbacksGold hit a high near 3790 yesterday, then retraced in the early morning. When prices rise a lot, everyone fears the high, but that’s no reason to short. Even with the pullback, yesterday’s big gains aren’t wiped out,so this isn’t weakness, but still strength. A rally followed by a pullback just means upward momentum slowed, not a top.
So you can wait if you fear the high: don’t chase longs or go long, but never go against the trend to short at the top. In trends, remember: follow the trend, follow the trend, follow the trend.
Today, gold tested 3750 in the morning then rebounded. Short-term momentum is still strong—no sustained pullback, and the market isn’t weak. Don’t short blindly; the bias is still long. Hold 3730, and gold will rally again. Even if 3730 breaks and it pulls back to 3700, it’s still a long chance.
Buy 3750 - 3760
TP 3770 - 3780 - 3790
SL 3745
Daily-updated accurate signals are at your disposal. If you run into any problems while trading, these signals serve as a reliable reference—don’t hesitate to use them! I truly hope they bring you significant assistance

Gold operation strategy, firmly bullish and unwaveringCurrently, gold's technical indicators still show an overbought condition, given its recent sharp upward trend. Therefore, some correction is expected. Support remains at the low level of 3746-3754. If this level is broken, a new downward trend could emerge in the short term. Overall, the upward momentum hasn't yet dissipated, but consolidation at these high levels could lead to a potential reversal. After yesterday's attempt to break through 3791, the bullish momentum weakened, requiring a brief pullback. Gold's upward trend pattern generally follows a "three steps forward, one step back" pattern, aiming for new highs. With both the international market and technical indicators pointing to further gains, the probability of a sustained downward correction is very low. Therefore, our trading strategy for today remains to buy on dips.
From the 4-hour analysis, the effective support below is maintained at around 3746-54, and the upper pressure is focused on the 3800 line. The operation is mainly to go long on pullbacks. For the middle position, watch more and do less, be cautious in chasing orders, and wait patiently for key points to enter the market.
Gold Trading Strategy:
Buy on dips at 3756-60; add to positions on dips at 3746-50; stop loss at 3738; target 3790-3800.

GOLD Very Bullish , Can We Buy Again And Get 200 Pips ?Here is My 30 Mins Gold Chart , and here is my opinion , the price going up very hard without any correction so we should move wit it and now we finally above 3760.00 With 4H Candle ! and we have a 4H Candle closure above it And Perfect Breakout and this give us a very good confirmation , so we have a good confirmation now to can buy after the price go back to retest the broken area 3760.00 , and we can targeting 100 to 200 pips . if we have a daily closure below this area this mean this idea will not be valid anymore .
Reasons To Enter :
1- Perfect Touch For The Area .
2- Clear Bullish Price Action .
3- Bigger T.F Giving Good Bullish P.A .
4- The Price Take The Last High .
5- Perfect 30 Mins Closure .

Gold Price Outlook – Trade Setup (XAU/USD)📊 Technical Structure
OANDA:XAUUSD is consolidating around $3,760, holding within a tight range after retreating from record highs near $3,791. The support zone sits at $3,752–3,754, while the resistance zone remains capped at $3,784–3,786. The structure suggests a possible bullish continuation if buyers defend support, targeting a retest of the highs.
🎯 Trade Setup
Entry: $3,752 – $3,754 (buy near support)
Stop Loss: $3,749 (below support zone)
Take Profit: $3,784 / $3,786 (resistance retest)
Risk/Reward: ~1 : 6.6
🗝️ Key Technical Levels
Resistance Zone: $3,784 – $3,786
Support Zone: $3,752 – $3,754
Major Resistance Above: $3,791 (all-time high)
🌐 Macro Background
The Federal Reserve’s recent 25 bps rate cut and expectations for two more cuts (October and December) continue to underpin gold. Fed Chair Powell acknowledged challenges with inflation and labour market weakness, but emphasized flexibility on further easing. This supports gold as lower rates reduce opportunity cost of holding bullion. Additionally, geopolitical tensions between NATO and Russia, particularly airspace violations and military escalation, further fuel safe-haven demand. However, traders are also eyeing the upcoming US PCE inflation data — a hotter reading could lift the USD and weigh on gold in the near term.
📌 Trade Summary
The bias favours long positions near $3,752–3,754, aiming for a move back toward $3,784–3,786. Holding above $3,752 keeps momentum bullish, while a break below would shift focus to $3,740 support.
⚠️ Disclaimer
This analysis is for reference only and does not constitute trading advice. Trading involves significant risk, and proper risk management is essential.

Gold All Time High Continue – Next Target?Gold is currently trading around $3688, just above the 3675–3680 breakout zone, which has now turned into a crucial support. Price is moving within an upward channel, but the recent breakout above equal highs and the labeling of a “weak high” suggest that buyers may still push towards the 3740–3750 resistance area before facing stronger rejection. A decisive break above the $3,700–3,750 zone would open the way to targets in the $3,800+ region and eventually toward $4,000 if the Fed proves dovish and ETF/central-bank demand remains strong.
However, failure to hold above 3680 would shift momentum back towards the lower channel, where immediate supports lie at 3565, 3530, and 3498. A deeper breakdown below these levels would open the door for further downside towards the 3440–3400 zone. Any surprise hawkish Fed commentary, a meaningful USD recovery, or a quick drop in inflation expectations could trigger sharper mean-reversion.
Buy Zone & Buy Trigger:
- Buy Zone: 3670 – 3680 area
- Buy Trigger: A clean breakout and 4H close above 3700 will be a buy trigger.
Note
Please risk management in trading is a Key so use your money accordingly. If you like the idea then please like and boost. Thank you and Good Luck!

Gold Analysis: Breakout Potential Toward $3,800Gold is trading around $3,715, showing strong bullish momentum after breaking out of the recent consolidation zone between $3,595 – $3,640. Price has respected the ascending channel and is now approaching the $3,725–$3,740 resistance zone, which is a key area to watch. A sustained break above this zone could open the way toward $3,760+ and possibly extend into the $3,800 region if bullish momentum continues.
Gold is consolidating after a strong rally. Holding above the trendline is key—breaking below may lead to a deeper pullback, while a breakout above resistance could push prices toward $3,800. Despite short-term swings, the longer-term outlook stays bullish.
On the downside, immediate support lies near $3,680–$3,660, followed by the support levels at $3,638 and $3,616. Holding above these levels will keep the bullish structure intact.
📌 Sell Zone & Sell Trigger:
- Buy Zone: $3,660 – $3,680 area
- Buy Trigger: A clean breakout above $3,725 – $3,740 resistance → Upside target $3,760 – $3,800.
Note
Please risk management in trading is a Key so use your money accordingly. If you like the idea then please like and boost. Thank you and Good Luck!

9/24: Sell at Highs, Watch Resistance at 3769–3773Good morning everyone!
Gold has pulled back into the 3760–3748 zone. Previous short positions delivered solid profits, while the short-term long strategy also yielded small gains. At the moment, price is hovering around a key support area and requires close observation:
If gold holds above 3770, it could still retest 3790–3800.
If support breaks, the next downside targets are 3742–3733/3721.
📌 Trading Outlook:
Bias remains toward selling at higher levels. For conservative traders, patience may offer better risk-reward setups:
Look for short opportunities around 3790 or above 3800.
Watch the 3740–3730 area for potential long entries.
⚠️ If considering longs near the current zone, monitor resistance at 3772 closely. Failure to break above should be a signal to exit quickly.
Remember: the market is always full of opportunities. Stay patient, disciplined, and focus on setups with stronger probability.

Gold to push for 3800 this weekCurrently, gold has been rising steadily since Monday’s opening 📅, repeatedly setting new all-time highs at any moment 🆙—and it may even make a direct attempt to break through the 3800 level this week. However, we must stay vigilant about potential pullbacks ⚠️ to avoid account losses during such corrections.
Notably, the 3750 resistance level—one that remained unbroken yesterday—was breached with remarkable ease today 📈. Looking ahead, a pullback in gold still demands our attention ⚠️: the probability of it surging directly to around 3780 right now is relatively low. Instead, it is far more likely to pull back further to the 3720-3730 range first 📉, after which it will resume its upward trajectory 🚀
Buy 3720 - 3730
TP 3740 - 3750 - 3760
Accurate signals are updated every day 📈 If you encounter any problems during trading, these signals can serve as your reliable guide 🧭 Feel free to refer to them! I sincerely hope they'll be of great help to you 🌟 👇
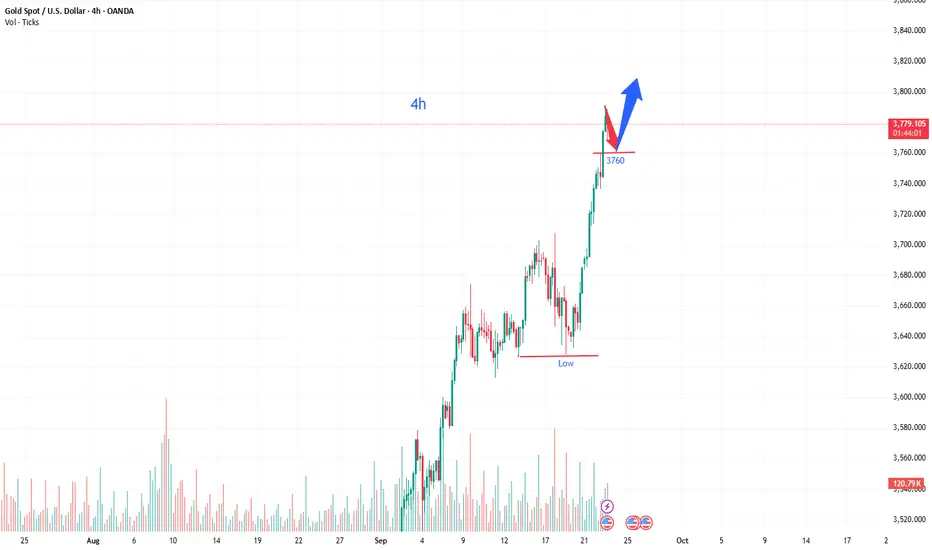
Gold is advancing robustlyLooking back at the gold 4H chart, the price is moving steadily higher with limited pullback room—bullish momentum is absolutely strong! Gold has already moved above the 3700 key level, with an intraday high touching 3780. The technical outlook has improved significantly: short-term resistance to the upside lies in the 3800 zone, while the 3730 level has now turned into a support level, followed by the 3700 level below. Gold’s short-term support is relatively solid.
A pullback in this bull market is a buying opportunity—simply continue to enter long positions on dips above 3730.
Buy 3750 - 3760
TP 3770 - 3780 - 3790
SL 3745
Daily-updated accurate signals are at your disposal. If you run into any problems while trading, these signals serve as a reliable reference—don’t hesitate to use them! I truly hope they bring you significant assistance

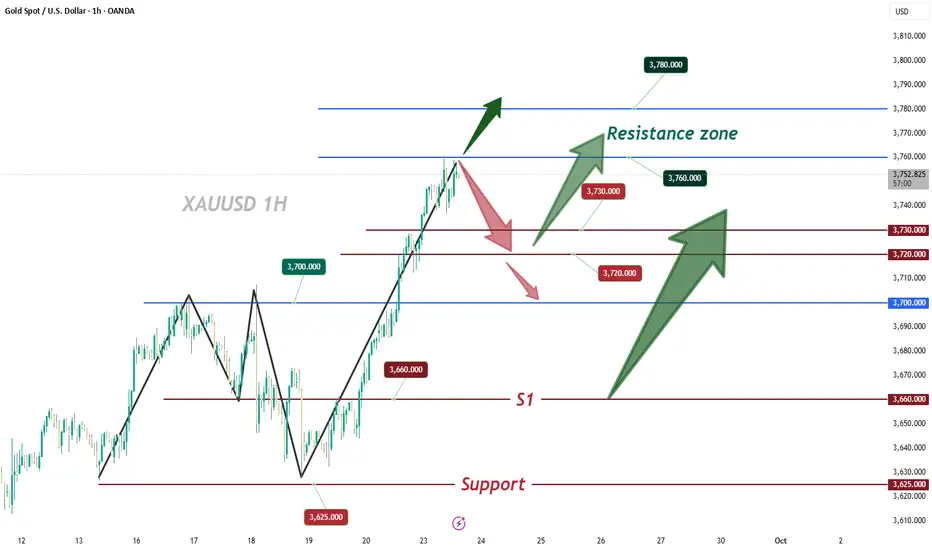
#XAUUSD: Neutral View On Gold May Go Either Side Gold has rallied to $3700 making it all time high level. However, at this moment gold remain uncertain as it can go either way of the trend. Therefore we have two point of view on current time; firstly since heavily bought, we can see a nice correction taking price to almosr 3550 area which remain crucial. The problem with this approach is we need strong confirmation snd currently we do not have. Second view is that price may continue the bullish approach and may take price to a record high.
Team Setupsfx

9/23: Focus on Shorts, Watch Support at 3712–3706Good morning everyone!
Gold extended its bullish momentum yesterday with a one-sided rally. After holding above 3680, price tested 3721 resistance, pulled back to 3712-3706 support without breaking, and then climbed further toward 3750.
📊 Technical Outlook:
30M chart shows bearish divergence, suggesting possible short-term pullback.
1H chart still supports the bullish structure, though momentum is slowing.
Daily close with a strong bullish candle confirms buyers remain in control, but profit-taking and psychological resistance near record highs could weigh on momentum.
📌 Trading Strategy:
Avoid chasing longs near 3750 and above; look for short opportunities in this zone.
Watch support at 3734-3728, with key zones at 3712-3706 / 3685. If support holds, consider long entries on pullbacks.

Gold breaks through high and falls back to continue to go longToday's gold morning situation mirrored that of last Friday and Monday. The US market saw a strong rise, closing strongly at a high in the early morning. This double-strength trend is extremely strong. Don't hesitate the next morning; the opportunity lies between 7 and 8 o'clock. Watch for a surge to the 3760 level. Same situation, same approach.
So now, wait for a pullback to 3760 to see if there's a second leg up. Alternatively, give up and wait and see, waiting for peak signals and patterns to emerge before turning bearish! In short, we're currently in an accelerated peaking phase, and there's still room for growth above 3760.
Gold Trading Advice: A dip in gold is the best time to buy. Don't worry about a further decline; the upward trend is already a major trend. Let's see when gold breaks through 4000.
Market fluctuates repeatedly, focusing on Powell's speechLast night, gold still did not provide an opportunity to pull back and go long. Instead, it continued to rise near the end of the trading day. Gold rose again after opening this morning and once approached 3760 before falling back, maintaining a narrow range of high fluctuations during the day. The daily line closed with a positive sign, but the MA5 and MA10 moving averages did not move up accordingly, indicating that yesterday's rise in gold was purely caused by news. At this time, we should be more vigilant about gold rising and falling. Pay attention to the upper pressure of 3760-3770. If gold touches the upper side again in the short term and encounters resistance and pressure, aggressive investors may consider shorting with a light position and waiting for a pullback. The focus below is 3730, which was the trend suppression yesterday and also the dividing point between short-term gains and losses for bulls and bears. A more conservative approach is to wait for a pullback to 3740-3730 before buying gold.

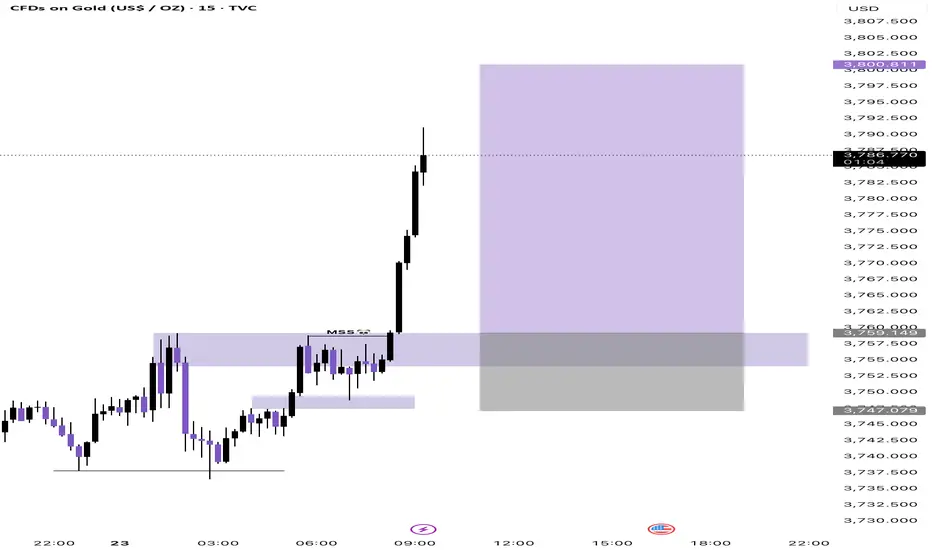
Gold Trade Set Up Sep 23 2025Gold once again has push far above PDH in london session creating yet another ATH. So as long as price stays closed above the 15m swing low and makes HL/HH on the 5m i will look for buys from a 5m OB to take higher
www.tradingview.com

Gold ATH , PULLBACK SHARP SETUP TO CREATE NEW ATH AGAIN Gold Buy Reasons
RBS / BRB / FVG / MSS
Gold Buy Zones
3760 , 3754
3750 , 3745
Got It Guys ? Use Proper MM
Good Luck With Your Trading 🤞