𝐌𝐓𝐗 | Buy-Side Sweet Spot in Gold’s Correction📌 From previous analysis:
• We anticipated corrective pullbacks and highlighted reversal zones.
• Focus was on 436–432 as the first critical support/resistance area.
⸻
1️⃣ Key Reversal Levels
There’s two scenarios in this rally:
A)
• 436 – 432 → First potential bullish reversal zone.
• 4H close above 435 → upside continuation toward 442 → 447 → 452.
B)
• 4H close below 432 → decline into 420.
• 420 – 415 is the strongest weekly demand zone (high-probability bullish bounce).
⸻
2️⃣ Continues Bullish Scenario
• 4H close above 454 → opens the way to 467.
• Stabilization above 467 → next major upside target 484.
✴️Plus Tip:
Daily closes above 420-415 zone supports the bullish momentum.
⸻
⚖️ Summary:
Gold is starting the month at a decisive zone (436–432). Holding above 435 favors further upside toward 452, while losing 432 puts the strong 420–415 demand zone into play. A confirmed breakout above 454 could accelerate the rally toward 484.
Xauusdbuy

Gold bullish surge With weekly high pierced I'm looking to take a buy around 3423.5 - 3430 area where there is previous support, I should be targeting 3467.03 area. i will not jump on the shorting band wagon, will observe price action and will take it from there. but initial bias is long
But if the price does not respect my buy area, I have another zone to take a long from, the area is 3414.871 - 3420 respectively. The market does whatever it wants so let's observe and be patient.

Gold🔸Last week, the price continued its upward trend by hitting our first entry point and rejected the expected ranges.
🔹Now the price is at an important point on the 4-hour chart and since it could not close above the price of 3451.62, there is a possibility of a price reversal.
🔸If the 3451.62 break is confirmed, the new demand ranges are suitable for buying.
🔹If the price closes below the 3404 range, the trend is down and we can sell on pullbacks.

PLAN NEXT WEEK XAUUSD 3500Related Information:!!!
📌A sustained move beyond this level could allow Gold to reclaim the key $3,400 mark, which, if decisively breached, may negate the bearish outlook and shift the short-term bias in favor of bullish traders. XAU/USD could then advance towards the intermediate resistance at $3,434–$3,435, on its way to the $3,451–$3,452 region — or the nearly two-month high reached last week — and potentially the all-time high around the psychological $3,500 level.
Personal opinion:!!!
🎯 Gold price recovered to break through 3450 to gain liquidity and continue the uptrend
Important price zone to consider : !!!
🌟Resistance zone point: 3440 zone
Sustainable trading to beat the market

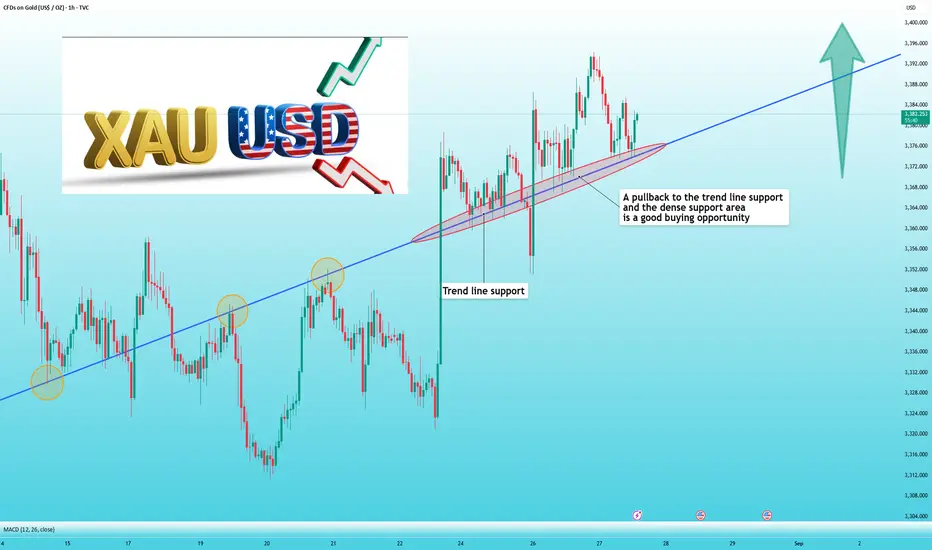
GOLD XAUUSD - Pullback Expected before the Next Leg UpGold (XAUUSD) has been on a solid bullish run, consistently pushing higher after each minor retracement. Now, we’re eyeing a potential pullback toward a key support zone at 3420–3400, where buying interest is likely to resurface.
If price action confirms a bounce from this zone, we could see a continuation of the uptrend toward 3450, and if momentum holds, possibly stretching to 3490–3500.
🔻 Trade Setup – Long Opportunity on Pullback
Entry: Buy Gold (XAUUSD) at 3420
Add-on Dip: 3400
Targets: 3450, then 3490–3500 (marked on chart)
Invalidation: Daily close below 3385
📌 Risk/Reward Outlook
This setup presents a tight risk with attractive upside potential. As always, stick to solid risk management and size your positions based on your personal trading plan.
👍 Agree with this view?
Drop a like, leave your comments, and let’s discuss this setup together!
Your feedback keeps the community sharp and growing. 🔥
Happy Trading,
– The InvestPro Team

XAU/USD – Bullish Breakout: Buy Dips Toward $3,409 Target📊 XAU/USD (Gold) – 2H Analysis
Gold has just broken out of its descending channel, showing a clear change of character (CHOH) around the $3,348–$3,358 support zone. This breakout suggests bullish momentum is taking control after weeks of compression.
Key Observations:
✅ Support Zone: $3,348–$3,358 is now a strong demand zone (previous rejection area flipped to support).
✅ Moving Averages: Price is above both the EMA 70 ($3,342) and EMA 200 ($3,346), strengthening the bullish bias.
✅ Projection: A potential continuation rally toward $3,409 (major liquidity target).
⚠️ Risk: If the support zone fails, price could re-test $3,334 or even $3,326.
Trading Plan (Short-Term):
Entry (Buy): Around $3,358–$3,348 (support retest).
Stop Loss: Below $3,342 (under EMAs).
Target 1: $3,390
Target 2: $3,409
👉 In summary: Gold is in a bullish reversal phase, and buying dips into the support zone offers the best risk-reward setup.

8/29: Sell in the 3446–3458 ZoneGood evening, everyone!
After testing the 3419–3427 resistance zone, gold pulled back briefly, then found support and broke higher, keeping the 1D uptrend intact. However, after such a sharp short-term rally, a pullback is likely.
📌 Key Supports: 3433–3428–3423
📌 Trading Plan: Short first, then buy
Main sell zone: 3446–3463
Look for short-term buys near support retests
Watch resistance reaction at 3438–3448
Heading into the weekend, news-driven uncertainty may increase — risk management is essential.

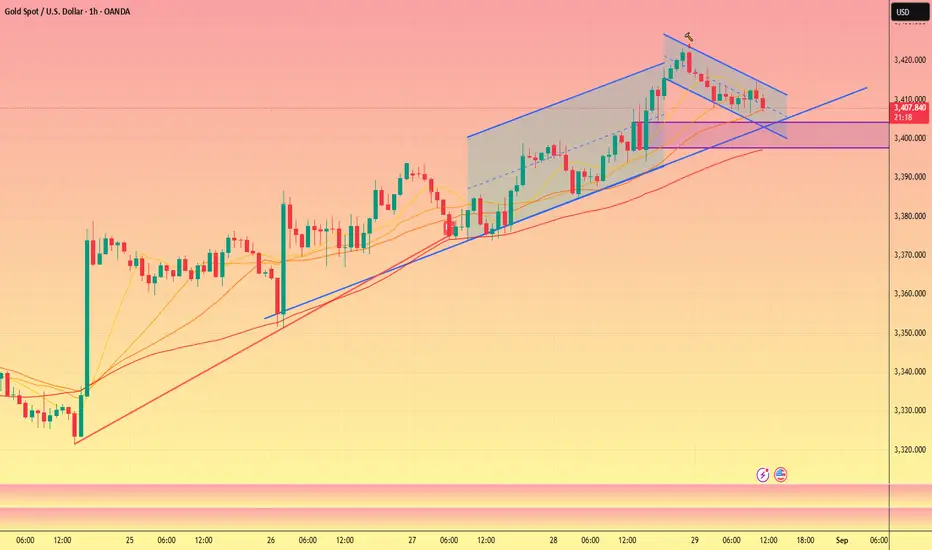
Gold retreats, buying opportunity reappearsAfter stabilizing at 3400 yesterday, gold prices continued their upward trend, reaching a high of 3423. This is very consistent with my view yesterday. The only regret is that gold prices did not return to 3400 after the article was published, and we missed this wave of gains.
Yesterday, in his speech on monetary policy, Waller expressed support for a 25 basis point interest rate cut in September and predicted further rate cuts within the next three to six months. If the employment data shows "significant weakness" in the US economy, he may support a larger rate cut (which is bullish for gold).
Based on gold's trend, 3400 OANDA:XAUUSD is definitely a key level. After yesterday's breakthrough, it has clearly become strong support. Therefore, I believe that as long as gold prices remain above 3400, the range of gold prices will likely be between 3400 and 3450.
Gold prices just retreated again. Not wanting to miss out, I bought around 3405, with a take-profit of $10-30 depending on the situation, and a stop-loss of $3395-3390.
If the 3395-3390 range is broken, don't go long on gold.

Gold 150 Pips SecuredOANDA:XAUUSD
www.tradingview.com
perfect play, swept SSL on the 15m, closed above high, target BSL/PDH

Gold Trade Set UpOANDA:XAUUSD
www.tradingview.com
Price has been making HH/HL so im overall bullish above this 15m high. I want to see a close above, and retest to target PDH/HH

Gold Sets Up for potential Upside Expansion as Buyers Step InGold (XAUUSD) is showing renewed bullish momentum after defending the mid-range support and reclaiming ground above the $3,410 zone. The structure suggests potential continuation higher with multiple bullish confluences aligning.
✅ Bullish Confluences:
Fibonacci Alignment: Price holding above the 38.2% retracement ($3,405) signals strength and potential for a higher retracement swing.
Volatility Band Support: Bounce from mid-band confirms buy-side defense and continuation potential.
Higher Low Structure: Recent consolidation maintained bullish structure, avoiding breakdown and favoring upside expansion.
🎯 Fibonacci-Based Targets:
TP1 – $3,429 (38.2%): First resistance target for partial profit-taking.
TP2 – $3,436 (61.8%): Next upside extension aligning with volatility resistance.
TP3 – $3,448 (100%): Full measured move completion toward upper band.
SL: Below $3,407 to invalidate the bullish thesis in case of breakdown.

Whether gold can hold steady at 3400 is the keyThe current market is bullish, primarily due to the developments surrounding Trump's proposed firing of Cook. Of the seven members of the Federal Reserve Board, three already support a rate cut: Bowman, Milan, and Waller. With the addition of another supporter, Trump's goal would be achieved. If Cook were to be fired and a more compliant candidate were to be promoted, the rate cut would be achieved, but the Fed's independence would also be undermined.
The dollar, US stocks, and US Treasuries would all be affected, and gold, the best safe-haven asset, would inevitably soar.
Today, we're focusing on two levels: 3400 and 3380.
If gold can stabilize above 3400 OANDA:XAUUSD , it's likely to head towards 3430-3450. At that point, you could consider buying around 3400.
Conversely, if it can't hold above 3400, it could test support at 3380. As long as it doesn't fall below 3380, it would be a good buying opportunity.
Good luck to everyone💪
📣If you have different opinions, please leave a message below to discuss
Is the entire network bullish? Trade with cautionGold rose yesterday without any obvious pressure, and bulls continued to exert their strength, 🐂but various technical indicators were close to the overbought area yesterday, and there is a need for technical correction in the short term. 📊
At the same time, due to the lack of certain news to drive gold, it is inevitable that gold will experience a correction today. 📉
Today's general trend is to go long when it falls back to support.📈 Focus on the effectiveness of the support at 3405-3395 below. After stabilizing here, you can consider going long and looking towards 3420-3430.🎯
Key data will be released later in the day, with core PCE data closely watched for new clues on whether the Fed will ease policy further after its September meeting. Any unexpected downside in the core PCE data could increase bets on a Fed rate cut, thereby weakening the US dollar and driving gold prices higher.👀
Today is Friday, and the weekly and monthly lines are about to come to an end. 📊It is necessary to be cautious in trading during the day to prevent unexpected events or possible one-sided market conditions. Strictly eliminate uncontrollable consequences caused by frequent transactions. 🙅♂️If there are any adjustments, we will notify you before the market opens.
XAUUSD – 1H | OB / CCH map Green = Buy OB, Red = Sell OB. Current price ~ 3410.7.
Key zones I’m tracking:
CCH / 1H supply: 3415–3422
HTF HIGH supply: 3435–3448
1H OB (near): 3382–3372
1H OB (deeper): 3334–3320
Scenario 1 – Rejection from supply (sell):
If price sweeps into 3415–3422 (CCH) or pushes into 3435–3448 (HTF HIGH) and 3–5m closes fall back below 3420, I’ll look for shorts targeting 3382–3372 first, then the 3334–3320 OB. Invalidation for the idea is sustained acceptance above 3450.
Scenario 2 – Mitigation then continuation (buy):
If price pulls back to 3382–3372 (1H OB) and prints a bullish shift (3–5m BOS/CHoCH), I’ll look for buys back to 3415/3422, and, if accepted above 3420, continuation into 3435–3448. If the first OB fails, the next buy zone is 3334–3320 (reaction-only with confirmation).
Execution: entries on 3–5m, always require a clear shift; no blind orders.

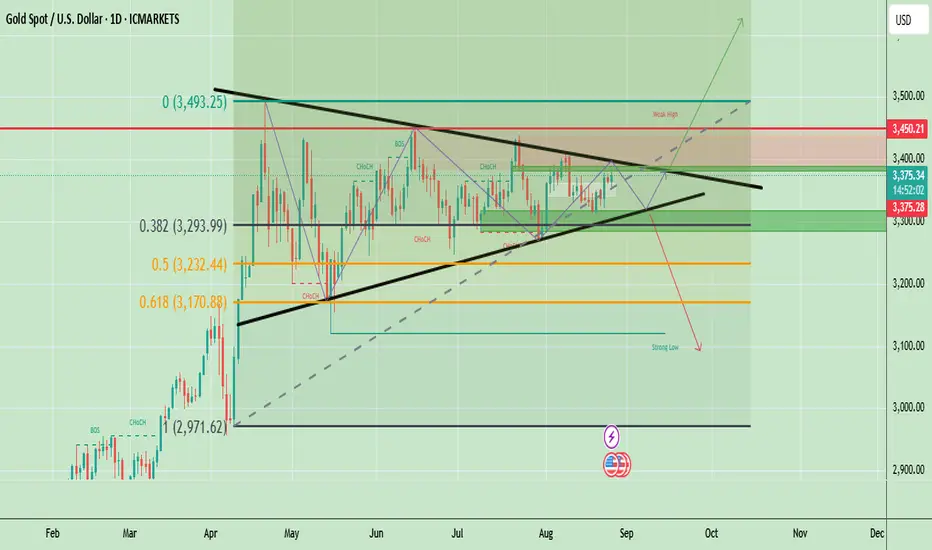
Gold Price Update – Neutral Trend with Key Breakout Levels AheadAs of August 26, 2025, gold (XAU/USD) is trading around $3,375 and remains in a consolidation phase inside a symmetrical triangle. Price is holding between $3,170 support and $3,450 resistance, with $3,493 as a major supply zone. A breakout above $3,450–$3,493 could extend the rally toward $3,600, while a breakdown below $3,293–$3,170 may trigger a decline toward $3,000. Until a clear breakout occurs, the overall trend is neutral with a slight bullish bias due to the long-term uptrend still intact.
🔑 Key Levels to Watch
- Resistance: $3,383 → $3,450 → $3,493
- Support: $3,317 → $3,293 → $3,232
- Breakout Zones: Below $3,293: Opens room to $3,170. Above $3,390: May lead to fresh highs toward $3,450+
Price has been ranging for months between $3,170 (Fib 0.618) support and $3,493 (supply/weak high) resistance. Market structure shows multiple CHoCH (Change of Character) signals, indicating indecision and sideways consolidation.
Gold 1hr Chart
Gold is in an uptrend, but watch $3,378 resistance for breakout confirmation; otherwise, expect a dip toward $3,345–$3,357 before resuming higher.
Buy Zone: $3,345 – $3,357 (ideal retracement support)
Buy Trigger: Break and close above $3,378 (confirmation for upside move)
Note
Please risk management in trading is a Key so use your money accordingly. If you like the idea then please like and boost. Thank you and Good Luck!
8/28 Focus on Selling Above 3412Good evening, everyone!
Gold pulled back near 3398 earlier today but held above the 3386–3378 support before rallying again and breaking through the 3400 level. Price is now above 3410, with the next major resistance zones at 3412–3419–3427 (and previous highs at 3433–3438). These levels are likely to be tested multiple times, but the closer price gets to 3419–3427, the heavier the selling pressure will be.
📌 Key Supports: 3404–3398–3386
📌 Trading Plan: Above 3412, focus on sell setups first; then look for potential buy opportunities after pullbacks confirm support.
Stay calm, trade with the trend, and capture profits wisely.

GOLD Very Bullish , Can We Buy Again And Get 200 Pips ?Here is My 15 Mins Gold Chart , and here is my opinion , we finally above 3400.00 and we have a 4H Candle closure above it and we have a Perfect Breakout and this give us a very good confirmation , so we have a good confirmation now to can buy from 3400.00when the price back to retest it , we need the price to go back and retest it and give us a good bullish price action and then we can enter , we can targeting 100 to 200 pips . if we have a daily closure below this area this mean this idea will not be valid anymore .
Reasons To Enter :
1- Perfect Touch For The Area .
2- Clear Bullish Price Action .
3- Bigger T.F Giving Good Bullish P.A .
4- The Price Take The Last High .
5- Perfect 15 Mins Closure .

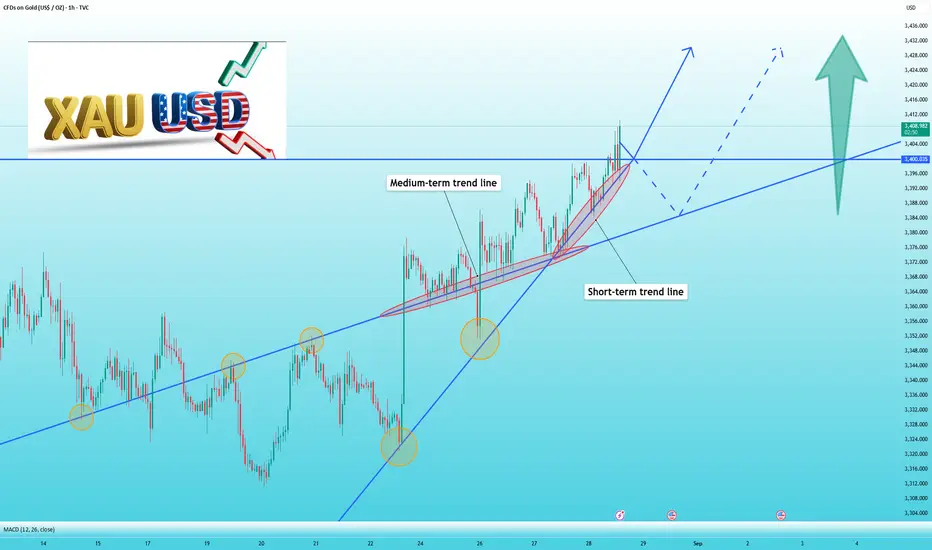
The gold rally is not over yet, stabilizing at 3400 is the keyThis week, Trump once again severely undermined the independence of the Federal Reserve. He has been attacking Chairman Powell for months and now threatens to fire Fed Governor Tim Cook. His actions are all part of his quest to pressure the Fed into cutting interest rates, ultimately forcing his will and ultimately achieving a rate cut, perhaps even a larger one.
Influenced by the Fed's independence and the expectation of rate cuts, gold prices have continued to rise this week, approaching the high of 3,400 points.
I personally believe that as long as gold doesn't fall below 3,350, it's only a matter of time before it breaks above 3,400.
From the 1-hour chart, we can clearly see that gold is steadily rising, supported by the trend line. Buying on a pullback to the trend line is a good opportunity, with a take-profit and stop-loss in place, presents a significant profit opportunity.
Currently, the optimal buying range for gold is between 3,365 and 3,375 OANDA:XAUUSD , with a target price of $10-20 and a stop-loss of $10.
📣If you have different opinions, please leave a message below to discuss
GOLD Still Very Bullish , 2 Chances To Buy And Get 200 Pips !Here is My 15 Mins Gold Chart , and here is my opinion , we finally above 3377.00 and we Still Not have a 4H Candle closure above it but we have a Perfect Breakout and this give us a very good confirmation , so we have a good confirmation now to can buy from 2 places , first one and best one for me will be 3377.00 , we need the price to go back and retest it and give us a good bullish price action and then we can enter , or if you a aggressive trader you can enter from 3381.00 cuz we have a small double bottom reversal pattern so we can enter from neckline also . we can targeting 100 to 200 pips . if we have a daily closure below this area this mean this idea will not be valid anymore .
Reasons To Enter :
1- Perfect Touch For The Area .
2- Clear Bullish Price Action .
3- Bigger T.F Giving Good Bullish P.A .
4- The Price Take The Last High .
5- Perfect 15 Mins Closure .
6- Small Reversal Pattern .

3400, the upper edge of the triangle, is gold long or short?#XAUUSD OANDA:XAUUSD
I reminded you yesterday not to chase the rising prices easily. 💻Gold retreated today as expected, hitting a low near 3385.
Gold is currently in a consolidation phase and has not given a clear trading direction, or it is waiting for the release of initial jobless claims data.📊
As the price of gold rises, the short-term support also moves up. 🌈The focus below is on the 3390-3380 support line. 🥅If it falls back but does not break, you can consider going long.📈 Pay attention to the short-term resistance range of 3402-3412 on the upside. Once it breaks through, it is expected to set a new high. Otherwise, it will maintain a high-level fluctuation pattern during the day.📉

Gold (XAU/USD) Targets $3,397 – $3,406 Amid Bullish MomentumAnalysis:
The 4H chart of Gold (XAU/USD) shows strong bullish momentum after a corrective phase. Price has broken above consolidation and is currently trading around $3,382, with upside targets at $3,397 and $3,406 (highlighted resistance zone).
The supply zone on the higher timeframe remains intact below $3,280, acting as a long-term support.
Immediate support levels lie at $3,371, $3,356, and $3,348. A break below these could shift momentum bearish.
Current bullish structure suggests that as long as price holds above $3,371, buyers may drive the price higher toward the resistance levels.
A rejection from $3,406 may lead to a pullback toward the mid-support zone before another attempt higher.

Gold Shows Potential Breakout at $3,390Gold (XAU/USD) has been exhibiting mixed price action over the past few weeks. On the 4-hour chart, we notice a critical resistance trendline forming a descending pattern that has contained price movement for some time. The current price stands at $3,390.26, indicating a potential breakout scenario.
Key Levels to Watch
Resistance: $3,400 – A level that has repeatedly capped upward movements.
Support: $3,325 – The lower boundary of recent price consolidation.
Immediate Buy Level: $3,390.54
Immediate Sell Level: $3,390.32
The price is currently testing the descending trendline, suggesting a possible upward momentum if bulls sustain above this level. Traders should be cautious of a false breakout, as consolidation is still evident around $3,375 – $3,400.
RSI Analysis
The Relative Strength Index (RSI) 14-period shows the momentum hovering near the 60-65 zone, indicating moderately strong buying pressure but not yet overbought. Previous RSI peaks near 70 triggered minor pullbacks, highlighting the importance of this indicator for spotting reversals.
ZigZag Indicator Insight
The ZigZag 5 10 indicator highlights the swing highs and lows, helping traders visualize the trend reversal points. The recent formation suggests a potential shift toward an upward trend if the current breakout holds above the resistance.
Trading Strategy
1. Bullish Scenario:
Entry above $3,400 with a target near $3,450.
Stop loss around $3,375 to manage risk.
2. Bearish Scenario:
If the breakout fails and price dips below $3,375, short positions could target $3,325.
Confirm with RSI moving below 50 for stronger conviction.
Conclusion
XAU/USD is showing signs of a potential bullish breakout after a prolonged period of consolidation. Traders should monitor the $3,400 resistance level closely and watch RSI behavior for momentum confirmation. With careful risk management, this could be a profitable swing trade opportunity.

Trump manipulates the market, bulls still have a chance#XAUUSD
Yesterday, I gave everyone a targeted trading plan. 📊First, it took into account the trading strategy of most people who wait for gold to pull back and go long. 📈Secondly, it supplemented the trading idea for large capital accounts to consider shorting with a light position near 3370 and waiting for a pullback.📉
This morning, gold fell to the ideal trading range of 3356-3345 as expected,🎯 and then rebounded, providing bulls with good profit margins. 🐂
I believe that as long as people who seriously refer to the trading strategy, 🤔whether they are partners who follow up on short orders and seize the profits of callbacks, or friends who arrange long orders at support levels to capture opportunities for pull-up, they will all be able to reap good returns. 🤑
This also once again verifies that our strategic logic around the "key range game" is in line with the current market rhythm.⚖️
Influenced by the morning news, gold rose in the short term and then entered a high-level fluctuation. 📊
From a trend perspective, bulls remain dominant, with gold prices remaining above the mid-range. A pullback presents an opportunity.🌈 Next, if gold stabilizes at 3375-3380, the bullish momentum will be further released, and it is expected to touch 3400-3410 and the upper edge pressure of the daily triangle.🚀
Whether it breaks upward or not will determine how far the bullish counterattack can go. If an effective breakthrough can be achieved, the upward space will be fully opened and is expected to set new highs.📊
In terms of operation, the main strategy is to go long during the day. You can consider going long based on the support of 3370-3355, with the target at 3385-3400.🏅
