Today's gold trading strategyTaking advantage of the rebound after the bottoming out and capturing the intraday breakout opportunities
The convergence of risk aversion demand and the expectation of easing: The Federal Reserve has cut interest rates as scheduled, although it retains the policy uncertainty for December, the low-interest-rate environment has not changed. Uncertainties such as the doubt over the implementation of the China-US trade agreement and the government shutdown in the US, continue to provide support for gold as a hedge, even though the strengthening of the US dollar has failed to suppress the rise in gold prices, highlighting the strong buying power.
Volatility premium in the Americas session: There are significant time differences in gold trading globally. The overlapping period of the European and American sessions from 20:00 to 23:00 Beijing time is the most concentrated and volatile "gold window" of the day, with the volatility typically reaching 15-20 US dollars per ounce. Currently approaching this period, after the previous fluctuations have built up strength, the concentrated entry of funds is likely to drive the price to break through the intraday range.
Today's gold trading strategy
buy:4005-4015
tp:4035-4045
sl:3995
Xauusdbuy

Today's gold trading strategyThe foundation for a rebound after negative news fades: The core policies of the Federal Reserve, including the 25BP interest rate cut in October and the termination of quantitative tightening in December, have been implemented. Previously, the market's divergent reactions to the "hawkish actions + dovish guidance" gradually subsided. Powell emphasized that the 12-month interest rate cut "is not a certainty" and although this dampened expectations for aggressive easing, the liquidity easing brought about by the termination of quantitative tightening (full re-investment of maturing bonds) is a definite positive factor. Currently, the gold price has not fully priced in this long-term support, and there is short-term room for expectation correction.
Dual support from interest rates and liquidity: The federal funds rate has dropped to the range of 3.75%-4.00%, coupled with the easing of liquidity pressure in the money market after the termination of QT in December, the holding cost of non-interest-bearing assets has further decreased. Historical data shows that within 1-2 weeks after the Fed's first rate cut, the probability of gold rising was 68%. This time, in addition to the rate cut, the termination of quantitative tightening also occurred, and the easing intensity was greater than that in the same period in 2019, providing stronger support.
The rational return of market expectations: The expectation of a December interest rate cut has narrowed from over 90% to 60%-70%. Excessive optimistic expectations have been corrected. The current expectation level is more in line with the policy orientation of the Federal Reserve based on "data dependence". After the negative news is cleared, funds will once again focus on the substantive positive impact of the termination of quantitative easing, driving the gold price to rebound.
Today's gold trading strategy
buy:4005-4015
tp:4035-4045
sl:3995

GoldXAUUSD
- Resistance Level
- Bullish Channel as an corrective pattern in Long Time Frame
- RSI - Divergence
- Symmetrical Triangle as an corrective pattern in Short Time Frame
- Completed " 12345 " Impulsive Waves and " ABC " Corrective Waves

gold await breakout to buy or sell#XAUUSD we await price to fall below 4017 on 2 times breakout before selling. The price is reforming a new trend.
Sell below 4017 2 times breakout, target 3982, stop loss 4028.
H1 closure above 4030-32 will continue bullish till 4050.
Await for breakout before trading

ElDoradoFx PREMIUM – GOLD ANALYSIS (31/10/2025, US SESSION)
1️⃣ Market Overview
Gold is consolidating near $4,009 ahead of the US Core PCE release — a key inflation figure likely to inject high volatility.
After testing the Golden Zone (4,023–4,008) multiple times, bulls remain in control above 3,995, but momentum has slowed.
Overall structure shows accumulation within a rising channel — suggesting a potential bullish continuation if price breaks above 4,026.
⸻
2️⃣ Technical Breakdown
🟢 D1: Gold remains above the 100 EMA (3,860), showing long-term strength. Short-term retracement from 4,046 with RSI ~51 = neutral pressure.
🟡 H1: Consolidation range 3,995–4,026 forming; 50EMA at 4,008 acting as dynamic support. Price is compressing between EMAs and trendlines.
🔵 15M–5M: RSI climbing from 40→55; MACD showing early bullish histogram; price coiling under 4,014 — ready for expansion.
⸻
3️⃣ Fibonacci Analysis
Last swing: 3,985 → 4,046
• 38.2% ➤ 4,023
• 50.0% ➤ 4,016
• 61.8% ➤ 4,008
🎯 Golden Zone: 4,023 – 4,008 (currently active)
⸻
4️⃣ High-Probability Trade Scenarios
📈 BUY SCENARIO (Main Bias)
✅ Entry Zone: 4,023 – 4,008 (Golden Zone Re-entry)
🎯 Targets: 4,026 → 4,046 → 4,060 → 4,082
🛑 Stop Loss: Below 3,995
⚡ Confirmation: Bullish CHoCH or engulfing on 5M/15M timeframe.
💥 BREAKOUT BUY
Trigger: Break & close above 4,026
Retest: 4,022–4,024
🎯 Targets: 4,046 → 4,060 → 4,082 → 4,100
🛑 SL: Below 4,010
⸻
📉 SELL SCENARIO (Countertrend)
⚠️ Sell Zone: 4,026 – 4,046 (Strong liquidity / supply area)
🎯 Targets: 4,016 → 4,008 → 3,985 → 3,965
🛑 SL: Above 4,050
⚡ Confirmation: RSI divergence or bearish engulfing on rejection.
🚨 BREAKOUT SELL
Trigger: Clean break below 3,985
Retest: 3,995–3,990
🎯 Targets: 3,965 → 3,945 → 3,920
🛑 SL: Above 4,005
⸻
5️⃣ Fundamental Watch
📊 Key Event: US Core PCE (High Impact)
• If inflation prints higher → USD strengthens → possible gold pullback.
• If weaker → USD drops → gold rallies above 4,046.
💵 DXY near 106.20, limiting upside pressure for now.
⚠️ Month-end flows may cause whipsaws and liquidity grabs before direction confirms.
⸻
6️⃣ Key Technical Levels
Resistance: 4,026 / 4,034 / 4,046 / 4,060
Support: 4,016 / 4,008 / 3,995 / 3,985
Golden Zone: 4,023 – 4,008
Break Buy Trigger: > 4,026
Break Sell Trigger: < 3,985
⸻
7️⃣ Analyst Summary
Gold continues to respect the Golden Zone (4,023–4,008) while coiling within a narrowing range.
If buyers defend 4,008–3,995, we can expect continuation toward 4,046–4,060.
Only a confirmed break below 3,985 will flip the bias bearish.
⸻
8️⃣ Final Bias Summary
Primary Bias: 🟢 Bullish above 4,008 → Target 4,046–4,060
Secondary Bias: 🔴 Bearish below 3,985 → Target 3,965–3,945
Volatility: ⚡ High (due to US PCE + month-end rebalancing)
⸻
— ElDoradoFx PREMIUM 3.0 Team 🚀
⸻

ANFIBO | XAUUSD - Soboring today [10.30.2025]Hi traders, I'm here, Anfibo.
XAUUSD Analysis – Daily Trading Plan
Trading Plan for Today:
>>> SELL ZONE:
ENTRY: 4135 - 4150
SL: 4165
TP: 4045 - 4010 - 4000
>>> BUY ZONE:
ENTRY: around 3935
SL: 3915
TP: 4020 - 4080 - 4135 - ...
Risk Management:
- Prioritize Buy setups following the higher-timeframe trend; Sell only for intraday scalps.
- Maintain a minimum Risk:Reward ratio of 1:2.
- Avoid entries during major geopolitical or economic announcements.
- Monitor the Head & Shoulders pattern closely — confirmation will guide the next major move.
Conclusion:
Gold has completed a healthy correction after its parabolic surge to $4,400, and the market is now regrouping around the $4,000 zone, with early signs of renewed bullish momentum. As long as $3,890 remains intact, the broader trend remains bullish, and I expect a potential rebound toward $4,200 in the near term.
GOODLUCK, LOVE U GUYS!

GOLD HIGH PROBABILITY SETUP SOON!!!🚨 XAUUSD HIGH PROBABILITY BUY SETUP 🚨
* Here We Can See Clearly The Next Potential Moves For GOLD Coming Hours/Days.
* Keep Your Eyes Close On Your Trading Positions.
* Happy PIP Hunting Traders.
FXKILLA.

GoldXAUUSD
- Fair Value Gap
- RSI - Divergence
- Completed " 12345 " Impulsive Waves and " ABC " Corrective Waves
- Demand Zone
- Bearish Channel as an corrective pattern in Short Time Frame

Gold Price Outlook – Trade Setup (XAU/USD)📊 Technical Structure
TVC:GOLD Gold rebounded from the $3,931–3,937 support zone, regaining traction above $3,950. The chart shows potential upside toward the $3,981–3,988 resistance zone, though price is still within a short-term range. If buyers maintain momentum, a break above $3,988 could open the way to $4,000. Conversely, failure to hold above $3,931 may trigger renewed downside pressure.
🎯 Trade Setup
Entry: $3,937 – $3,931 (support retest)
Stop Loss: $3,929
Take Profit: $3,981 – $3,987
Risk-Reward Ratio: ≈ 1 : 5.67
🌐 Macro Background
Gold attracted safe-haven bids after snapping a four-day losing streak. As FXStreet’s Haresh Menghani notes: “The US Dollar drifts lower amid shutdown concerns, lending some support to Gold.” 【FXStreet】
The USD weakened despite the Fed’s hawkish stance, pressured by economic uncertainty from the prolonged U.S. government shutdown.
The Trump–Xi meeting offered a softer equity market tone, reflecting lingering geopolitical caution.
The Fed cut rates by 25 bps as expected, but Chair Powell rejected expectations of another December cut, limiting Gold’s upside.
Traders now await FOMC member speeches for clues on the future rate-cut path.
This combination leaves Gold supported by safe-haven demand but capped by Fed’s hawkish tilt.
🔑 Key Technical Levels
Resistance: $3,981 – $3,988
Support: $3,931 – $3,937
Psychological Level: $4,000
📌 Trade Summary
Gold holds firm above $3,950 with renewed safe-haven flows, but faces resistance near $3,985. A bullish setup favours buying dips into support ($3,931–3,937) with targets at $3,987. Caution is warranted as Fed commentary could inject volatility.
⚠️ Disclaimer
This analysis is for reference only and does not constitute trading advice. Trading involves significant risk, and proper risk management is essential.

Gold Has Entered the Fifth Wave — A Drop Below 3800 Is PossibleGold continued its Wave-4 rebound today, but following a news catalyst, Wave-5 downward momentum began, and the market structure has become clearer. In such conditions, what traders need most is patience.
From the daily chart perspective, there still appears to be room for further downside. Based on my expectation, this decline may break below 3800. Of course, the market is always changing, and our outlook is based on probabilities — no one can guarantee the market will move exactly as expected. However, recent price action has been largely in line with our forecast, and I believe many of you have already secured profits from this move — that’s what matters.
Additionally, I will be traveling tomorrow and won’t be able to monitor the market in real time. So during your trades, please stay alert and prioritize risk control. Protect your capital first — profits will come naturally afterward. The market never lacks opportunities, so don’t sacrifice long-term stability for short-term gains.
Stay calm, stay disciplined, and trade safely!

Gold Holds Firm Ahead of FOMC DecisionGold has shown a clear break of structure (BOS) on the 1H timeframe, confirming a shift from a previous downtrend into a bullish continuation phase. After rebounding from the support area, the price is holding above both moving averages, signaling strong buying interest. A short-term consolidation phase could lead to another upside move toward the next resistance zone as long as support holds.
Key Levels:
Buy Entry: 4000
Take Profit: 4070
Stop Loss: 3960
Reasoning:
Technically, price action confirms a trend reversal with multiple bullish structure breaks (BOS 1H & 2H) and consistent higher lows. Buyers continue to defend the support area, keeping momentum aligned with the broader bullish bias.
Fundamentally, softening U.S. dollar sentiment and stable Treasury yields support gold’s recovery, as traders look for safety ahead of key U.S. economic data and the upcoming FOMC communication.
Disclaimer:
This analysis is for educational purposes only and does not constitute financial advice.

Gold Breaks Key Support Zone — Bearish Momentum Builds Below $4,Analysis:
The XAU/USD (Gold vs. USD) 45-minute chart shows a clear breakdown below the established support zone, indicating a shift in market sentiment from consolidation to bearish momentum.
The support zone around $4,050 – $4,000 had previously held multiple times, acting as a strong demand area.
The recent breakout below this zone confirms a potential trend continuation to the downside.
Price action suggests a bearish pattern with lower highs and lower lows forming before the breakout.
A retest of the broken support (now resistance) may occur before the next leg lower.
The next major target lies near $3,900 – $3,850, aligning with the projected measured move.
Technical Outlook:
If gold fails to reclaim the $4,050 level, further downside pressure remains likely. However, a close back above this level could invalidate the bearish breakout and signal a possible false break.

GoldXAUUSD
- Bearish Channel as an corrective pattern in Short Time Frame
- Break of Structure
- Completed " 12345 " Impulsive Waves
- Order Block
- Change of Characteristics

LONG ON GOLD XAU/USDGOLD Has swept sell side liquidity at a major support zone.
It also has bullish divergence on the lower timeframes.
Additionally there is conflict between Iran and Israel which leads investors to safe havens like gold and silver.
I am looking to catch over 300 points on GOLD which is over 3000 pips.

Gold Faces Wave 5 Danger: Prepare for a Sharp Drop AheadAt yesterday’s opening, gold dropped sharply, breaking the bullish structure. Today, the decline continued, and the gap near 3887 was successfully filled before the price rebounded toward the 3975 resistance area. The strong resistance remains around 4000–4018.
On the daily chart, the trend remains downward, with support at 3963 already broken. Although the price is now recovering, upside resistance remains dense. From a structural perspective, the movement now aligns with a five-wave decline pattern, and the market appears to be in wave 4’s rebound phase. Therefore, it’s crucial to monitor the resistance area closely — if the price fails to break and hold above it, be prepared for the onset of wave 5, which could drive prices down to around 3800.
On the weekly chart, there is potential support near 3834, but keep in mind that wave 5 declines are often stronger and faster than wave 3, meaning this support could be broken.
In summary, trade cautiously and make account safety your top priority.

XAU/USD: Bullish Rally to 4225?OANDA:XAUUSD is priming for a bullish rally on the 1-hour chart , with price pulling back to a critical support zone after a sharp decline, forming a potential reversal point as buyers defend against further downside amid overall uptrend signals. This setup highlights a classic dip-buy opportunity near the confluence of support and recent lows.
Entry zone between 4007-4037 for a long position. Target at 4225 near the resistance zone for attractive upside potential. 📊 Set a stop loss on a close below 3991 to manage risk effectively. 🌟 Keep an eye on confirmation through a bullish engulfing pattern or increased volume pushing above the entry, leveraging gold's volatility in response to USD movements.
Fundamentally , today's US Initial Jobless Claims and Existing Home Sales data could introduce volatility to gold and the dollar—Jobless Claims are forecasted at around 233K, while Existing Home Sales are expected near 4.00M, potentially strengthening USD if figures beat expectations and pressuring gold prices. 💡
📝 Trade Plan:
✅ Entry Zone: $4,007 – $4,037 (buy zone near support)
❌ Stop Loss: Close below $3,991
🎯 Target: $4,225 (resistance zone / take-profit area)
💎 Risk-to-Reward: More than 1:4, offering a strong technical edge.
What's your outlook on this trade? Share below! 👇

#XAUUSD: +6000 Pips Swing Move In Making, Patience Pays!
Gold prices have fallen sharply as the DXY has regained strength. Following the recent significant sell-off, we can anticipate the potential direction of the price. Three key targets can be considered if the price moves in our favour. The first is a nearby target at $4000 which would represent a gain of 1100 pips. Subsequent targets should be determined according to your trading plan.
There are two potential entry points; if the first is invalidated the second should be considered.
We wish you the best of luck and trade safely.
Team Setupsfx 🚀❤️

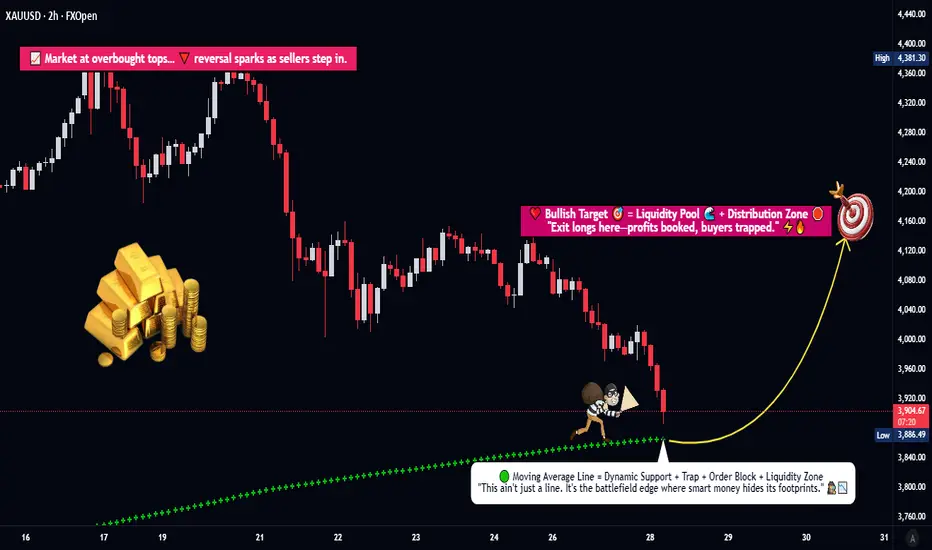
Is This the Start of Gold’s Next Major Upswing?🦸♂️ Title: XAU/USD Heist: The Golden Pullback Play (Swing/Day Trade) 💰
📈 Executive Brief (The "Why")
The shiny rock is pulling back to a key support zone! We're looking for a potential bullish continuation swing. The plan is to catch the dip as it retests a dynamic support level, aiming for a ride back up to a major resistance area. This is a classic "buy the dip" setup in a structurally strong asset.
🎯 The Trade Plan (The "How")
Asset: XAU/USD (Gold)
Bias: Bullish
Strategy: Pending Order on a Pullback
📍 Entry Zone:
YOU CAN ENTER THE MARKET AT ANY PRICE LEVEL AFTER THE WEIGHTED MOVING AVERAGE PULLBACK @ ~3860.00
(Look for a bullish rejection candle or momentum shift confirming the bounce)
🚨 Stop Loss (The "Escape Route"):
This is thief SL @ ~3760.00
Place your SL after the breakout I mentioned price level. This level is below the recent swing low, invalidating the bullish structure if breached.
🎯 Take Profit (The "Cash Out"):
OUR target @ ~4150.00
This aligns with a strong resistance + overbought + trap is there so kindly escape with profits. We're taking profits before price potentially reverses.
⚖️ Risk & Reward Management (The Fine Print)
Note to the Thief OGs: Dear Ladies & Gentleman, I am not recommending to set only my SL & TP. It's your own choice. You can make money, then take money at your own risk. Manage your position size accordingly! The provided levels are a framework, not a financial command.
🌍 Related Pairs to Watch (The Intel)
TVC:DXY (U.S. Dollar Index): Gold's arch-nemesis! 👊 A weaker DXY often means a stronger Gold price. Watch this for correlation cues.
$EUR/USD: The biggest component of the DXY. A strong Euro often pressures the Dollar, which can boost Gold.
$XAG/USD (Silver): Gold's volatile cousin. Often moves in the same direction but with more amplitude.
AMEX:GLD / AMEX:IAU : Gold ETF proxies; they track the physical metal's price.
Key Correlation Point: Gold is typically inversely correlated with the U.S. Dollar. Keep one eye on the Dollar Index for confirmation of your Gold trade's direction.
✨ Community Boost
“If you find value in my analysis, a 👍 and 🚀 boost is much appreciated — it helps me share more setups with the community!”
#Gold #XAUUSD #Trading #SwingTrading #TechnicalAnalysis #Finance #Pullback #WMA #DXY #Forex
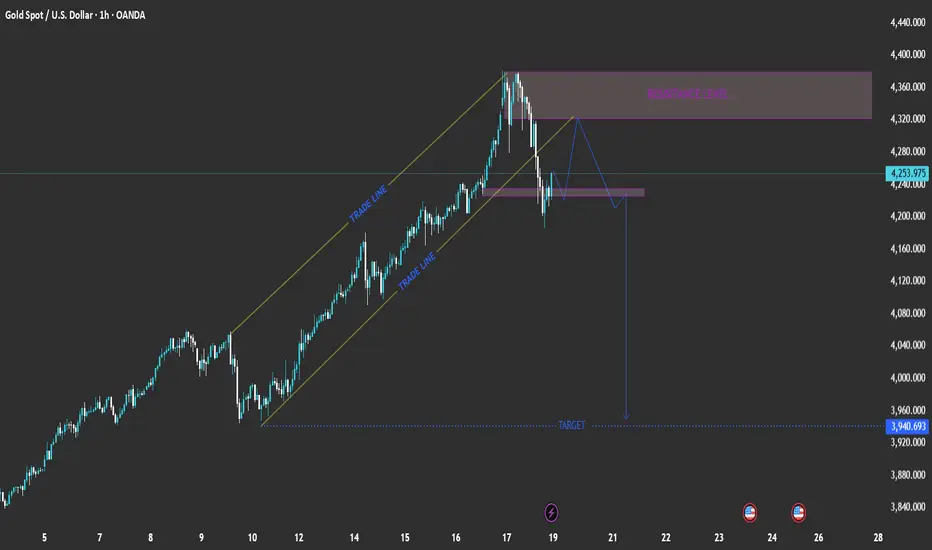
XAU/USD: Channel Breakout → Retest → Downside Target at 3,940EURONEXT:FTI1! EURONEXT:FTI1! EURONEXT:VU8F2026 EURONEXT:VM81! EURONEXT:VV6X2025 EURONEXT:V26X2025 EURONEXT:NS8Z2025 EURONEXT:YG8F2026 Pair: Gold Spot (XAU/USD)
Timeframe: 1-hour
Current Price: 4,253.975
Trend: Recently broke out of an ascending channel (bearish signal)
📉 Chart Breakdown
1. Ascending Channel (Trade Lines)
Price was moving steadily inside a rising channel, indicated by the two parallel yellow “TRADE LINE” levels.
The break below the lower trade line suggests weakening bullish momentum and potential trend reversal.
2. Resistance Level (4,320 – 4,360 zone)
Marked in purple, this zone served as a key resistance.
Price rejected strongly from this area, confirming seller presence.
3. Structure Retest and Potential Move
After the channel break, price retraced back to retest the broken channel support (now resistance).
The projected blue path shows a lower-high formation followed by a new drop, completing a bearish continuation pattern.
4. Target Zone
The projected target is near 3,940.693, aligning with previous structure support.
This level could serve as a profit-taking area for short positions.
📊 Summary of Key Levels
Zone Type Range / Level
4,320 – 4,360 Resistance Strong supply zone
4,220 – 4,240 Retest zone Potential short entry area
3,940 Target Bearish target / demand zone
⚙️ Trading Plan Concept (Hypothetical)
Bias: Bearish
Entry Idea: Wait for rejection from 4,220–4,240 zone.
Stop Loss: Above 4,280 (resistance)
Take Profit: Around 3,940 (target)
Risk/Reward: Approximately 1:3 or better
🧭 Conclusion
The chart suggests that Gold (XAU/USD) might be entering a corrective bearish phase after failing to sustain its bullish channel. A retest of broken structure before another drop aligns with typical market structure behavior.
Gold Price Analysis - Gold Breakout Levels 4200 vs 4040Gold is trading inside a tightening rising channel after forming a strong higher timeframe rejection from the ATH which pushed price into a corrective phase. Buyers have repeatedly defended the strong support zone near 4000-3980 creating a false breakout low followed by a controlled recovery showing that demand remains active.
However, each rally into the weak-high resistance at 4160-4200 has shown fading momentum meaning sellers are still protecting this zone aggressively. Until price breaks out with a clean close and retest above this resistance gold will remain in a neutral to slightly bullish consolidation phase driven by stop hunts and choppy movements inside the channel.
A successful breakout above 4200 can trigger a bullish continuation toward 4240 then 4320-4360 and possibly back to the ATH zone while a breakdown below 4040 rising support would shift the structure bearish again exposing the 3980 demand and potentially a deeper drop to 3900 if buyers fail there.
In simple terms buyers still control support, sellers still control resistance and the next big move will come once one of these critical levels breaks with strength.
✅ Option 1-Strong Bullish Bias
Gold is still respecting the rising channel and defending the strong support zone around 4000-3980. As long as price stays above the rising trendline bullish structure remains valid. A clean breakout above 4160-4200 will confirm continuation toward 4240 → 4320 → ATH retest. Buyers are still in the game, waiting for the breakout.
✅ Option 2-Neutral to Bullish
Gold is consolidating inside a rising channel after rejecting the ATH. Support remains strong around 4000-3980 while sellers continue to defend 4160-4200. A breakout on either side will define the next major move. Above 4200 bullish continuation toward 4240 and 4320+. Below 4040 deeper pullback toward 3980 and possibly 3900.
✅ Option 3-Neutral to Bearish
Gold is struggling to break above 4160-4200 showing seller strength at the top of the range. If price fails again and breaks below the rising channel near 4040 downside can accelerate toward 3980 and 3900 for liquidity. Bulls must hold support to avoid a deeper correction.
Gold remains trapped between 4040 support and 4200 resistance inside a rising wedge. Buyers holding strong at the bottom but sellers still defending the top. Break above 4200 bullish continuation toward 4320. Break below 4040 bearish move to 3980-3900. Still a range waiting for breakout confirmation.
Note
Please risk management in trading is a Key so use your money accordingly. If you like the idea then please like and boost. Thank you and Good Luck!

GOLD HIGH PROBABILITY SETUPS SOON!!!🚨 XAUUSD HIGH PROBABILITY BUY SETUP 🚨
* Here We Can See Clearly The Next Potential Moves For GOLD Coming Hours/Days.
* Keep Your Eyes Close On Your Trading Positions.
* Happy PIP Hunting Traders.
FXKILLA.

Gold Price Outlook – Trade Setup (XAU/USD)📊 Technical Structure
OANDA:XAUUSD Gold (XAU/USD) is consolidating within a symmetrical triangle formation. The resistance zone lies between $4,104 – $4,113, while the support zone is marked at $4,050 – $4,055. The price has repeatedly tested both zones, suggesting market indecision. A breakout from this tightening structure could dictate the next directional move.
📌 Trade Setup
Entry: $4,061 (near trendline support)
Stop Loss: $4,050 (below support zone)
Take Profit: $4,113 (resistance)
Risk–Reward (R:R): ≈ 1 : 4.36
🌍 Macro Background
Renewed optimism surrounding US-China trade talks has reduced safe-haven demand, leading to gold’s decline near $4,065 earlier today. US Treasury Secretary Bessent confirmed that both sides reached a framework for discussion, with China expected to delay its rare earth policy by one year. At the same time, markets are nearly certain the Federal Reserve will deliver a 25 bps rate cut at the October FOMC meeting, with another cut possible in December. While trade optimism weighs on gold, rate-cut expectations continue to provide a safety net for the metal.
🔑 Key Technical Levels
Resistance: $4,104 / $4,113
Support: $4,055 / $4,061
Upside Target (if breakout): $4,130 – $4,150
📋 Trade Summary
Gold is trapped in a tightening triangle between $4,055 and $4,113. Traders may look for long entries on dips near $4,061 with targets at $4,113, aligning with Fed rate-cut expectations. However, renewed US-China optimism caps the upside. A decisive break below $4,050 would invalidate the bullish outlook and open the door toward $4,020.
⚠️ Disclaimer
This analysis is for reference only and does not constitute trading advice. Trading involves significant risk, and proper risk management is essential.

Today's gold trading strategyExpectation of policy easing "stable with growth": Despite the presence of hawkish voices within the Federal Reserve, core officials have expressed clear signals of easing measures - the President of the St. Louis Federal Reserve, Musalem, explicitly stated that if there are further risks in the labor market, he might support another rate cut. More importantly, the probability of a rate cut at the October 28-29 interest rate meeting remains above 90% in the market. This policy expectation provides a solid support for gold. As an interest rate-sensitive asset, gold's attractiveness will continue to rise in an environment where the easing expectation is clear.
Today's gold trading strategy
xauusd @buy4060-4080
TP:4110-4130-4200
SL:4040
