GoldXAUUSD
- Bearish Channel as an corrective pattern in Short Time Frame
- Change of Characteristics
- Fair Value Gap
- Demand Zone
- Completed " 12345 " Impulsive Waves and " A " Corrective Wave
Xauusdbuy

XAU/USD FALLING WEDGE BUYING OPPIRTUNITYGold fell to 4066 Thursday morning signalling buy after long wick rejection on demand zone. with falling wedge and demand zone solidifying change of direction. im definitely ring it for short term to 4109

Where Can Gold (XAUUSD) Take a Correction?Looking at your chart, Gold is moving up in a short-term recovery, but there are strong resistance zones above where a correction (downward move) can happen.
1️⃣ Zone: 4113 – 4120 (Current Area)
This is a minor resistance.
Small pullback is possible but not a major reversal zone.
2️⃣ Major Resistance Zone: 4143 – 4147
This is the first strong supply zone.
Price fell sharply from this zone earlier.
This is the most likely area for correction.
3️⃣ Strong Resistance: 4176 – 4180
If price continues upward, this is the next major resistance.
High probability that gold will correct from here.
4️⃣ Upper Resistance: 4200 – 4207
This aligns with your upper trendline.
This is the highest and strongest reversal zone.
A deep correction can start from here.
Stay Tuned For More Updates

Gold Price Outlook: Strong Support Rebound Toward 4,255XAU/USD – Technical Analysis (16 Nov 2025)
Overall Market Context
Gold experienced a sharp decline after breaking out of its rising channel, reaching a major support zone between 4,050 – 4,065. Price is currently stabilizing above that support, attempting to form a short-term base for a bullish correction.
1. Key Technical Zones
🔵 Major Support Zone (Strong Demand)
4,050 – 4,065
This zone has acted as the first strong buy reaction after the breakdown.
Multiple wick rejections show aggressive buyers waiting here.
A clean break below → opens deeper correction towards 4,025 – 4,030.
🟦 Immediate Resistance Zones
4,100 – 4,110
First intraday resistance.
Price must break above this to confirm bullish momentum.
4,120 – 4,130
Secondary resistance.
A break above this confirms the reversal structure.
🎯 Main Bullish Target
4,255 – 4,260
This aligns with:
Former channel midline projection
Fibonacci extension zone
Previous major swing high area on the chart
The chart clearly marks the bull target at 4,255.718.
2. Market Structure Breakdown
🔻 Previous Trend
Price was trading inside an ascending channel (yellow lines).
Broke down sharply → entered correction phase.
Now attempting a bullish re-entry after hitting strong support.
🔄 Current Price Behavior
Price is forming higher lows on the micro-trend after the spike down.
A short-term wedge/bull flag structure is developing.
Bulls are defending support aggressively.
3. Expected Move (Based on Your Chart Projection)
Primary Bullish Scenario ✔️ (Most Probable)
Hold above 4,070 – 4,085
Break above 4,100 → 4,110
Pullback retest
Push toward 4,130
Bull continuation toward the target 4,255
This matches the yellow arrow path drawn on your chart.
4. Bearish Alternative Scenario ❗
If gold breaks below 4,050 with strong momentum:
Next support → 4,025 – 4,030
Deeper correction back toward 3,990–4,000 zone becomes possible.
But currently buyers are controlling the support zone.
5. Summary
Structure: Reversal attempt after channel breakdown
Momentum: Neutral → turning bullish
Key Level to Break: 4,110
Bull Target: 4,255
Support Holding: Strong
Bias: Bullish above 4,070, bearish only below 4,050 RUS:NG1! RUS:SI1! RUS:GD1! RUS:SV1! RUS:USDRUB.P RUS:MX1! RUS:NA1! RUS:RI1! RUS:IRUS.P RUS:PD1! RUS:ED1!
If you want, I can also generate:
✅ Trading signal in multiple languages
✅ Short-term & long-term forecast
✅ Buy/Sell zones with risk management
Just tell me!

Gold’s Next Rebound May Break 4100 for 4120-4140 RangeCurrently, gold’s attempt to break through 4100 has failed, and it has pulled back to around 4080. If it rebounds again, it will most likely break through 4100 directly and fluctuate within the 4120 - 4140 trading range
Accurate signals updated daily. They serve as a reliable guide for trading issues – feel free to refer to them. Hope they help!

Gold pullbacks present buying opportunities.The gold pullback has ended, with a steady rebound after retracing to the 4000 psychological level, forming an upward trend.
Therefore, the strategy should focus on buying, following the mainstream trend.
From the current price action, the 4100 resistance level has been broken and has now become support. The Fibonacci retracement level also shows the 0.382 Fibonacci retracement is around 4092.
The 1-hour moving average for gold has turned upwards, indicating continued upward momentum. After breaking and stabilizing above 4100, gold is now steadily rising on the 1-hour chart. The 4090 area has formed short-term support, and a pullback to the 4090-4100 range presents a buying opportunity.
Therefore, we simply need to wait for a pullback to the 4090-4100 range to buy.
I personally believe the US session will provide such an opportunity.

Gold RalliesToday, after the Asian session opened, gold did not continue the previous day’s downward trend but oscillated upward overall. This shows that after a short adjustment at the opening, bullish momentum has once again taken the upper hand, with strong market absorption capacity.
The key support level for today is 4025 - 4030, and the strong support remains the 4000 integer mark. A break below this level may trigger panic selling in the market.
For the upper resistance, we focus on 4120. If it breaks through smoothly, we expect it to surge towards the 4150 - 4180 range.
Buy 4080 - 4085
SL 4070
TP 4100 - 4110 - 4120
Sell 4120 - 4125
SL 4135
TP 4090 - 4080 - 4070

gold await breakout#XAUUSD price awaits breakout above 4120-4122 for bullish continuation which will target 4141-4160.
Buy stop st 4120-4122 on 2 times breakout or M15 to M30 closure above. Target 4141-4160 SL 4106.
Below the 4106 on M30 closure holds price retracement which will drop till 4091-4080 for new buy formation.

GOLD Breakout Done , Long Setup Valid To Get 300 Pips !Here is My 15 Min Gold Chart , and here is my opinion , the price going up very good and we have a 4H Candle closure above our Res 4100.00 And Perfect Breakout and this give us a very good confirmation , so we have a good confirmation now to can buy after the price go back to retest the broken area 4100.00 For the first time and hope it will give us a good chance to enter with good stop loss , and we can be targeting 100 to 300 pips . if we have a daily closure below this area this mean this idea will not be valid anymore .
Reasons To Enter :
1- Perfect Breakout .
2- Clear Bullish Price Action .
3- Bigger T.F Giving Good Bullish P.A .
4- The Price Take The Last High .
5- Perfect 4H Closure .

ElDoradoFx – GOLD ANALYSIS (19/11/2025, US SESSION)1. Market Overview
Gold enters the US session around $4,115–$4,120, continuing its bullish advance from London after breaking above the H1 descending channel. The current move pushes directly into a major liquidity pocket + intraday resistance zone, increasing the probability of a corrective pullback before any continuation.
Overall trend remains bullish above $4,095, but momentum is slowing at resistance.
⸻
2. Technical Breakdown
🔹 Daily (D1)
• Price bounces strongly from the $4,000–$4,030 demand zone.
• RSI recovering from mid-50s, suggesting momentum rebuild.
• Structure remains bullish as long as price holds above $4,030.
• Key daily resistance: $4,119 → $4,145 → $4,181.
🔹 H1
• Price broke the H1 descending trendline and retested it successfully.
• Price now facing a dense H1 supply between $4,119–$4,125.
• Holding above the 100EMA + 200EMA cluster = bullish strength.
• A clean break of $4,125 opens path toward $4,140–$4,156.
🔹 15M–5M
• Clear bullish structure with multiple BOS and CHoCH confirmations off $4,078–$4,086.
• RSI showing overbought conditions near session highs → pullback likely.
• MACD remains bullish but histogram weakening—momentum cooling slightly.
⸻
3. Fibonacci Analysis
Last swing:
Low: $4,072
High: $4,119
• 38.2% → $4,108
• 50.0% → $4,096
• 61.8% → $4,088
🎯 Golden Zone: $4,108–$4,088
Best area for a bullish continuation if US session retraces.
⸻
4. High-Probability Trade Scenarios
✅ BUY Scenario (Main Bias)
Buy zone:
→ $4,108–$4,102
or
→ Golden Zone: $4,108–$4,088
Targets:
🎯 $4,125
🎯 $4,132
🎯 $4,145
🎯 $4,156
Stop Loss:
🛑 Below $4,095
Confirmation:
• 5M–15M bullish CHoCH
• Rejection wicks at 4,108 or deeper Golden Zone retest
⸻
✅ BUY Breakout Setup
Trigger: Break & close above $4,125
Retest: $4,119–$4,121
Targets:
🎯 $4,132
🎯 $4,145
🎯 $4,156
Stop Loss:
🛑 Below $4,110
⸻
⚠️ SELL Scenario (Countertrend Only)
Sell zone: $4,119–$4,125 (major intraday supply + liquidity)
Targets:
🎯 $4,112
🎯 $4,108
🎯 $4,096 (Fib 50%)
Stop Loss:
🛑 Above $4,132
Confirmation:
• 5M/15M bearish engulfing
• RSI divergence at highs
⸻
⚠️ SELL Breakout Setup
Trigger: Break below $4,095
Retest: $4,098–$4,100
Targets:
🎯 $4,088
🎯 $4,078
🎯 $4,066
Stop Loss:
🛑 Above $4,102
⸻
5. Fundamental Watch
• US Session may bring volatility from FOMC Minutes later.
• Dollar Index holds steady; a dip could fuel a breakout above $4,125.
• If yields rise, expect a pullback back to the Golden Zone.
⸻
6. Key Technical Levels
Resistance: 4,119 / 4,125 / 4,132 / 4,145 / 4,156
Support: 4,108 / 4,102 / 4,096 / 4,088 / 4,078
Golden Zone: 4,108 – 4,088
Break Buy Trigger: > 4,125
Break Sell Trigger: < 4,095
⸻
7. Analyst Summary
Gold remains bullish above $4,102–$4,108, with continuation likely after a pullback.
Best opportunities are buying the retrace into the Golden Zone or a breakout above $4,125.
Only a break below $4,095 shifts sentiment bearish for the session.
⸻
8. Final Bias Summary
🔵 Bullish bias above $4,102
🔴 Bearish only below $4,095
— ElDoradoFx PREMIUM 3.0 Team 🚀

GoldXAUUSD
- Fibonacci Level - 50.00% / 61.80%
- Demand Zone
- Completed " 12345 " Impulsive Waves and " A " Corrective Wave
- Fair Value Gap
- S / R Level

Supporting the precise long-positioning strategyCore economic data disappointed, confirming the economic slowdown.
The core retail sales in the US dropped by 0.3% month-on-month in October (expected to remain unchanged), marking the largest decline since March 2024. At the same time, industrial output dropped by 0.6% month-on-month in October (expected to decline by 0.1%), with both core consumption and production indicators showing synchronous weakness, far exceeding market expectations. Historical data shows that when core retail sales and industrial output decline simultaneously, the probability of the Federal Reserve initiating easing policies within 3 months increases from 58% to 72%. This directly boosts the probability of a December interest rate cut from 44.4% to 48.2%. The early brewing of easing expectations provides strong support for the gold price.
The dovish faction of the Federal Reserve has spoken out, and policy differences have widened.
Federal Reserve Governor Bowman (previously hawkish) stated on November 19 that "We need to closely monitor the impact of economic slowdown signals on inflation. If the economy continues to weaken, we can assess the timing of the interest rate cut in advance." The dovish faction unexpectedly expanded, breaking the previous "hawkish dominance" of the舆论 landscape. Market sensitivity to policy shifts has significantly increased, further weakening the suppression power of hawkish remarks.
Gold trading strategy
buy:4065-4075
tp:4085-4095-4130
sl:4055
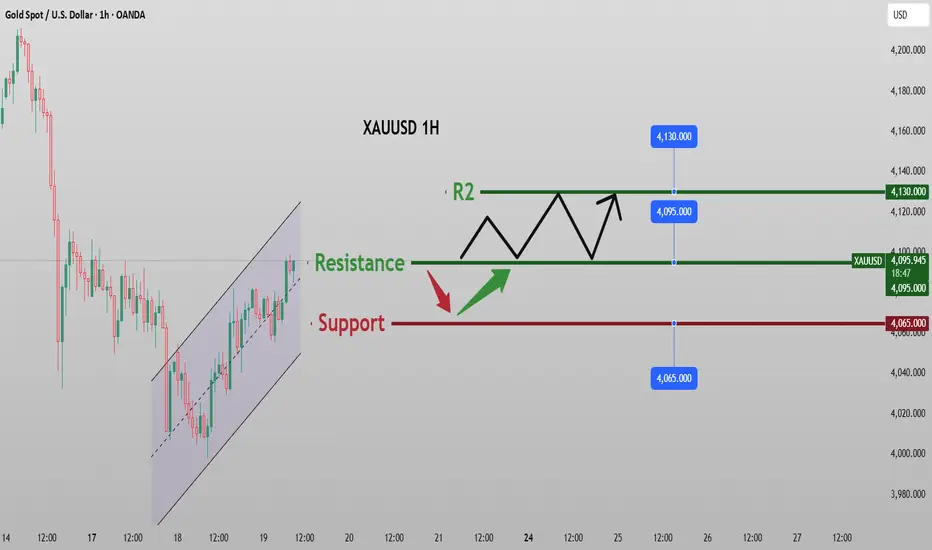
GOLD HIGH PROBABILITY BUY SOON!!!🚨 XAUUSD HIGH PROBABILITY BUY SETUP 🚨
* Here We Can See Clearly The Next Potential Moves For GOLD Coming Hours.
* Keep Your Eyes Close On Your Trading Positions.
* Happy PIP Hunting Traders.
FXKILLA.

Gold Near 4100: Breakout or Reversal?As of now, gold is maintaining a steady upward consolidation, with the price briefly approaching 4100—well in line with expectations. Most traders should have captured this wave of profit. The next focus is whether gold can break above the 4100 resistance zone. Based on the 4H chart structure, the market still shows potential for an upside breakout.
In the U.S. session, several key speeches and the FOMC meeting minutes will be released, which could trigger significant volatility. If your account is not in ideal condition, make sure to manage risk in advance.
From a technical perspective, the major short-term resistance remains the 4110–4114 area. If the news supports the bullish side, the price could extend toward 4136–4150, and with the boost from tomorrow’s NFP data, a test of 4200 is also possible.
However, if sentiment favors the bears, gold may fall back toward 4000, with further supports at 3980 and 3940/3896.
Overall, from tonight’s U.S. session to tomorrow’s NFP release, the market is entering another period of heightened volatility—full of both risks and opportunities. If you cannot react to rapid price swings, it’s safer to wait for a selling opportunity after an upward spike or a buying opportunity after a pullback, and avoid chasing highs or panic selling at lows.

Gold: 4000 Breakdown → 4080 Breakout, Short StrategyAfter breaking below the key level of 4000 today, gold staged a minor rebound. It then oscillated within the 4030-4050 range and rebounded again during the US session, successfully breaking above 4080 so far.
Resistance above remains significant – we can continue to go short at high levels
Accurate signals updated daily. They serve as a reliable guide for trading issues – feel free to refer to them. Hope they help!

ElDoradoFx – XAUUSD ANALYSIS (19/11/2025, ASIA SESSION)1. Market Overview
Gold begins Asia around $4,070–$4,073 after a strong US-session recovery from $4,056–$4,060, creating a higher low on H1. Price is currently reacting at a major confluence zone: H1 supply + descending trendline + EMA200 resistance.
Momentum remains bullish but overextended short-term, suggesting a likely Asia pullback into support before London continuation.
⸻
2. Technical Breakdown
🔹 Daily (D1)
• Gold maintains broader bullish structure above $4,030.
• Price rejected strongly from the daily bullish demand $3,940–$4,000.
• RSI is climbing toward 50+, signaling recovery.
• A daily close above $4,082–$4,095 confirms a return to upside continuation.
🔹 H1
• Clear HL structure from $3,998, with BOS into $4,072.
• Price is now inside H1 supply $4,072–$4,085, aligned with trendline + EMA200 resistance.
• First rejection appeared, indicating sellers active at the zone.
🔹 15M–5M
• Short-term bullish trend, but RSI divergence forming at $4,072–$4,075.
• Asia likely to retrace to the HL zones $4,067 / $4,064 / $4,060 before deciding direction.
⸻
3. Fibonacci Analysis
Latest swing: $4,056 → $4,073
• 38.2% = $4,067
• 50% = $4,064
• 61.8% = $4,060
🎯 Golden Zone: $4,067 – $4,060
Ideal for re-entry on bullish continuation.
⸻
4. High-Probability Trade Scenarios
📈 BUY Scenario (Primary Bias)
Buy Zone: $4,067 – $4,060 (Golden Zone)
Targets:
• TP1: $4,073
• TP2: $4,082
• TP3: $4,095
Stop-Loss: below $4,056
Confirmation: 5M–15M CHoCH or bullish engulfing.
⸻
📈 BUY Breakout Setup
Trigger: Break & 5M/15M close above $4,085
Retest: $4,078–$4,082
Targets:
• $4,095
• $4,108
• $4,122
Stop-Loss: below $4,075
⸻
📉 SELL Scenario (Countertrend)
Sell Zone: $4,082 – $4,085
(confluence of supply + trendline + EMAs)
Targets:
• $4,072
• $4,064
• $4,060
Stop-Loss: above $4,092
Confirmation: bearish rejection + RSI divergence.
⸻
📉 SELL Breakout Setup
Trigger: Break below $4,060
Retest: $4,062–$4,064
Targets:
• $4,056
• $4,048
• $4,032
Stop-Loss: above $4,067
⸻
5. Fundamental Watch
• Asia low volatility expected ahead of FOMC Minutes.
• US Dollar stabilizing; no directional force yet.
• Higher volatility expected into London.
• Gold remains driven by rate expectations; dips continue to be bought.
⸻
6. Key Technical Levels
Resistance Levels
• 4,082
• 4,085
• 4,095
• 4,108
Support Levels
• 4,067
• 4,064
• 4,060
• 4,056
Core Zones
• Golden Zone (Buy): 4,067 – 4,060
• Supply Zone (Sell): 4,082 – 4,085
Breakout Triggers
• Buy: > 4,085
• Sell: < 4,060
⸻
7. Analyst Summary
Gold is in a mid-trend retracement phase after forming a new H1 higher low at $3,998. The current zone $4,072–$4,085 is heavy with confluence sellers, suggesting Asia may retrace first.
Main bias stays bullish above $4,060, with the Golden Zone offering the cleanest continuation setup.
A clean break above $4,085 opens the path toward $4,108–$4,122.
A break below $4,060 flips momentum intraday to bearish.
⸻
8. Final Bias Summary
BULLISH above $4,060
BEARISH below $4,060
⸻
🥇 ElDoradoFx PREMIUM 3.0 – PERFORMANCE 18/11/2025 🥇
━━━━━━━━━━━━━━━
📊 XAU/USD RESULTS
🔻 SELL +60 PIPS
🟢 BUY +820 PIPS (Swing)
🔻 SELL +60 PIPS
🔻 SELL +20 PIPS
🔻 SELL +110 PIPS
🔻 SELL +40 PIPS
🟢 BUY +30 PIPS
━━━━━━━━━━━━━━━
▶️ TRADING SESSION RESULTS
🟢 BUY +240 PIPS
🟢 BUY +270 PIPS
🟢 BUY +190 PIPS
🔻 SELL +50 PIPS
━━━━━━━━━━━━━━━
💰 TOTAL PIPS GAIN: +1,890 PIPS
🎯 11 Signals → 11 Wins
⚡ 100% Accuracy
━━━━━━━━━━━━━━━
🔥 Clean setups, powerful swings, and flawless live execution.
If you caught these trades, congratulations — massive profit day! 🚀💰
— ElDoradoFx PREMIUM 3.0 Team 🚀

Gold XAUUSD at Key Support: Watching for a Retrace & BreakoutGold has recently traded down into a major support zone, a level that has historically attracted strong buying interest. 🪙📉➡️📈
If this support continues to hold and bullish momentum resumes, I’ll be monitoring the 30-minute timeframe for a clean pullback into discount pricing. From there, a decisive break in market structure would provide a high-probability opportunity to position long with the trend. 🔍⏳✨
As always, confirmation is key — chasing early entries in consolidation zones can expose traders to unnecessary risk.
🛑 Disclaimer: This is not financial advice. Educational purposes only.

BTCUSD: Consolidates Under PressureBTCUSD has extended its recent correction, presenting a low-range consolidation pattern under pressure. Bulls and bears are engaging in a tug-of-war around key support levels, with no clear one-sided direction emerging.
Immediate support has formed near the 91,000 level, while the more critical lifeline support lies at 90,500. A breakdown below this level could trigger a deep pullback. On the upside, short-term resistance is concentrated in the 95,000-96,000 range,the primary target to overcome for any rebound, as a breakout here is necessary to further open up upside momentum.
Overall, the current market sentiment remains sluggish, but there is rebound potential from a technical perspective. In the short term, the asset is likely to maintain a low-range consolidation trend.
Buy 91000 - 91500
SL 90000
TP 93000 - 94000 - 95000
Sell 95000 - 96000
SL 96500
TP 93000 - 92000 - 91000

Gold: 4000 Support TestGold extended yesterday’s correction today, showing a significant decline amid oscillatory pressure, with some support found near the $4,000 mark. After surging to a high of $4,101.76 yesterday, gold plunged sharply, and this downward correction has continued to gather momentum on the 18th.
Previously, a head-and-shoulders top pattern formed on the 4-hour chart of gold, indicating an inherent technical correction demand. Furthermore, the pullback from yesterday’s high created a clear short-term bearish pressure signal, and today’s decline represents a further digestion of these negative technical cues.
Currently, the market is in the phase of testing support near $4,000.If this level is breached, it may trigger a further pullback to the short-term buffer support at $3,980, with the key strong support at $3,950 requiring close attention.
If gold can stabilize above $4,000, it will most likely enter a range-bound consolidation phase.
The primary resistance above lies at $4,100, a critical pressure level amid the recent correction. A breakout above this level will require a significant increase in trading volume, making it quite challenging in the short term.
Sell 4060 - 4050
SL 4070
TP 4000 - 3990 - 3980
Buy 4000 - 4010
SL 3990
TP 4040 - 4050 - 4060

GOLD Risky Long!
HI,Traders !
#GOLD will soon hit
A wide horizontal support
Level around 4024.36 and
After the retest a local
Bullish rebound and a move
Up are to be expected !
Comment and subscribe to help us grow !

XAU/USD Bullish Structure Retest Offering Strategic Swing Entry🏆 XAU/USD GOLD SWING TRADE OPPORTUNITY 💰
Bullish Pullback Setup | LSMA Moving Average Confirmation
📊 TRADE PLAN OVERVIEW
Asset: XAU/USD (Gold vs US Dollar) | METALS Market
Timeframe: Swing Trade (4H-Daily Bias)
Setup Type: Bullish Continuation on Pullback
Confirmation Indicator: LSMA Moving Average
🎯 ENTRY STRATEGY
Method: Layer Entry Using Multiple Buy Limit Orders (Recommended)
Entry Zones:
Primary Entry: 4010.00 - 4020.00 (First layer - 40% position)
Secondary Entry: 3990.00 - 4000.00 (Second layer - 35% position)
Confirmation: Wait for LSMA to show bullish crossover + price rejection from support level
🛑 RISK MANAGEMENT
Stop Loss: 3960.00
⚠️ Important Note: Adjust your SL based on YOUR personal risk tolerance & trading strategy. This is a suggested level only - YOUR risk management is YOUR responsibility.
Risk/Reward Ratio: 1:2.5 minimum recommended
🚀 PROFIT TARGET
Primary Target: 4260.00
Technical Reasons:
Strong resistance level identified
Overbought zone trap setup (scalp-friendly)
Correction potential after breakdown confirmation
Historical support/resistance confluence
⚠️ Disclaimer: Take partial profits at technical levels. TP is suggestive only - YOUR profit management is YOUR decision. Risk management is individual responsibility.
📈 TECHNICAL INDICATORS ANALYZED
✅ LSMA Moving Average - Bullish Structure Confirmation
✅ Price Action - Pullback to Support
✅ Resistance/Support Levels - Multi-timeframe confluence
✅ Overbought/Oversold Zones - Trap identification
🔗 CORRELATED PAIRS TO WATCH
1. EURUSD (EUR/USD) - Inverse Correlation ⚠️
Gold typically strengthens when USD weakens
If EURUSD rallies, XAU/USD may follow (USD weakness)
Key Point: Monitor US Dollar strength/weakness for directional bias
Setup Link: EUR strength = Gold strength
2. DXY (US Dollar Index) - Direct Inverse Correlation 📉
Most Important Correlation
When DXY falls → Gold typically rises
When DXY rises → Gold typically falls
Key Levels to Watch: DXY 105.50 - 106.50 (Major support/resistance)
Our Edge: If DXY breaks below support, XAU/USD bullish case strengthens
3. USDJPY (USD/JPY) - Strong USD Indicator 💹
High positive correlation with USD strength
If USDJPY rises sharply = USD strengthening = Gold pressure
Key Point: Monitor for conflicting signals before entry
Watch Zone: 150.00 - 151.50 resistance
4. SPX500 (S&P 500) - Risk Sentiment Indicator 📊
Risk-off environment = Gold strength
During market corrections, gold rallies (safe-haven)
Key Point: If SPX breaks major support, expect gold rally acceleration
Current Context: Monitor for equity weakness signals
5. UST10Y (US 10-Year Treasury Yield) - Rate Pressure 📉
Inverse relationship with Gold prices
Rising yields = Gold headwinds
Falling yields = Gold tailwinds
Our Setup: Lower yields support bullish gold bias
💡 PRE-TRADE CHECKLIST
Confirm LSMA bullish alignment on primary timeframe
Check DXY weakness (< 106.00 = favorable)
Verify no major economic data releases (next 4 hours)
Set layer entry limit orders (avoid FOMO market entries)
Confirm risk/reward = minimum 1:2.5
Position size = 1-2% account risk maximum
Set alerts at entry/SL/TP levels
⚡ TRADING RULES
ONLY enter on confirmed LSMA bullish structure
Use limit orders (never market buy at resistance)
Trail stop-loss once +50 pips profit locked
Take 50% profit at +100 pips minimum
Move remaining SL to breakeven + 5 pips after TP1 hit
Never add to losing position
Created For: Active Swing Traders | Technical Analysis Enthusiasts
Best Used: Combined with your own analysis & risk management
Updated: Real-time market conditions check recommended before entry
"The best trade is the one you DON'T take because it doesn't fit your plan."

gold on sideways until breakout#XAUUSD price today is total sideways, but we monitor those price if decline continues. 4046-4040 shows entry on sell, 2 times breakout above 4055.5 on bullish
4046-4040 on sell limit, target 4026-3995, SL 4055.5.
Below 4026 on H4 need reverse back unless the H1 closes below there before selling can continues. The 4055.5 is a strong range which needs 2 times breakout before buying.

XAU/USD (Gold) Price Action Analysis: Trendline Retest & PotentiCurrent Market Structure & Key Observations
Previous Trend: The chart shows a strong uptrend from late October, peaking around November 14th at approximately $4,400. This peak marked a significant reversal.
Correction/Reversal: Since the peak, the price has undergone a sharp downward correction or potential reversal.
Trendline Interaction: The price has recently fallen to and is currently interacting with a major long-term ascending trendline (the solid black line).
Current Price: The price is hovering right at the trendline, indicated by the dashed pink line at approximately $4,034.
Analysis of the Projected Path (Red Lines)
The red lines drawn on the chart suggest a specific bearish scenario:
Trendline Break and Retest: The price is shown to break below the ascending trendline. This is a critical technical signal, often indicating the end of the uptrend and the start of a downtrend.
Pullback/Retest: The price then executes a pullback back up to the broken trendline (now acting as a resistance level). The projected high for this pullback is around $4,060.
Bearish Continuation: After failing to break back above the trendline, the price is projected to continue its decline, heading towards the area of $3,900 and then possibly $3,850 in the following days.
Potential Scenarios (Alternative View)
While the red lines illustrate a clear bearish path, it's important to consider an alternative:
Scenario 1: Bearish Continuation (As Projected)
Action: If the price confirms a breakout below the trendline (closes below it on multiple candles), the trendline turns into resistance.
Target: The focus shifts to lower support levels, with initial targets around $3,900 - $3,850. This confirms the end of the recent uptrend.
Scenario 2: Trendline Hold/Bounce
Action: If the trendline acts as strong support and the price fails to close significantly below it, it could lead to a bounce.
Target: A bounce would target the previous swing high before the major drop, potentially aiming back toward $4,150. This would maintain the longer-term bullish structure.
